


Employer-sponsored health insurance plans are the most common way for Americans to receive health insurance coverage, covering around half of Americans. As a core part of an employer’s benefits package for attracting and retaining employees, employer-sponsored coverage is a major expense for businesses, especially for small businesses.
In this study, AdvisorSmith examined costs for health insurance premiums paid by small businesses in all 50 states and Washington, D.C., to find the states where costs are rising the fastest. Our study considered the three-year period from 2015-2018 and examined premium rates for small businesses with less than 50 employees.
The cost data in this study excludes the impact of tax subsidies that select small businesses receive under the Small Business Health Care Tax Credit for plans purchased from the Small Business Health Options Program (SHOP) Marketplace.
How much does health insurance coverage cost small businesses?
Nationally, the average cost of health insurance for small businesses with under 50 employees was $7,433 per employee.
This figure includes the cost of employee-only, employee-plus-one, and family coverage, while excluding the portion of the premiums paid by the employee. Nationwide, this figure has grown by a compounded annual growth rate of 3.0% over the study period.
Cost Per Employee to Small Business Employers
Employer-sponsored health insurance is usually offered in one of three configurations, which include single coverage, employee-plus-one coverage, and family coverage. In terms of premiums, single coverage costs the least and is the most popular offering, while employee-plus-one costs more than single coverage, and family coverage costs the most. We calculated the employer cost by taking a weighted average of the three offerings based upon the national proportion of the three options among small businesses with fewer than 50 employees.
Two major factors impact the cost to small business employers of employee health insurance. The first is the insurance premium, which is usually determined by the plans available to small businesses in each state, as well as options chosen by the employer around plan design variables such as medical networks, deductibles, and out of pocket maximums. Secondly, employers can reduce their costs by passing on a portion of the premium costs to employees. The interaction of these two factors determines the ultimate cost of the health insurance coverage to the employer.
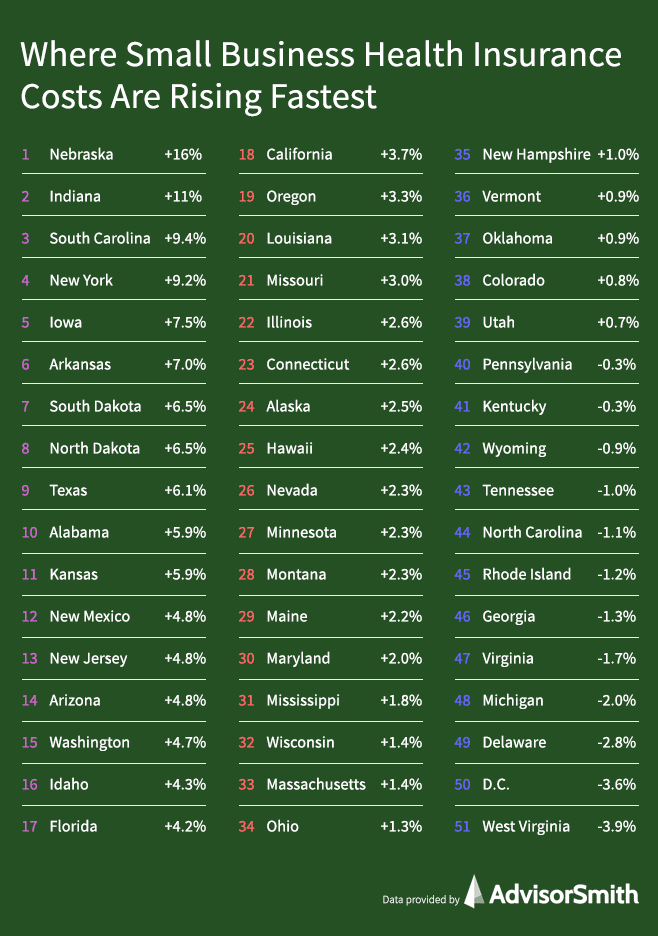
States Where Health Insurance Costs are Rising Fastest for Small Businesses
1. Nebraska

The cost to small businesses for health insurance coverage in the state of Nebraska grew by a nation-leading 16.7% on a compounded basis from 2015-2018. In 2015, small businesses paid an average of $4,875 per employee, with this figure rising to $7,751 in 2018.
Premiums in Nebraska rose an annualized 11.4% for single plans, 5.4% for employee-plus-one plans, and 13.0% for family plans during the study period. In addition to the premium increases, small businesses in Nebraska reduced employee contributions for family and employee-plus-one plans, absorbing additional costs, while employee contributions for single plans rose slightly.
2. Indiana
Indiana’s small businesses paid an average of $7,550 per employee for health insurance costs in 2018, compared with $5,525 in 2015, an annualized growth rate of 11.0%. The growth in health insurance costs for small businesses in Indiana was driven by annualized premiums growth of 9.3% for single plans, 4.8% for employee-plus-one plans, and 6.6% for family plans over the study period.
Additionally, employee contributions fell for the most expensive types of plans in Indiana—family plans. Employee contributions rose modestly for single and employee-plus-one plans. The net effect of these changes led to Indiana having the second highest rate of increase in small business health insurance costs nationwide.
3. South Carolina
In South Carolina, employer costs for small business health insurance rose by 9.4% annualized over the study period, the third highest in the country. The state ended 2018 with employers paying $7,423 per employee in health insurance costs, up from $5,674 at the beginning of the study period.
Premiums in South Carolina grew by 5.1% for single plans, 6.0% for employee-plus-one plans, and 9.2% for family plans on an annualized basis, while employee contributions for single plans were roughly flat. Employee contributions for family plans increased, while they decreased for employee-plus-one plans.
4. New York
New York had an annualized increase in employer costs of 9.2% from 2015-2018. Small business costs for health insurance rose from $7,818 to $10,167 per employee over the study period.
Most of the growth in employer costs was driven by premiums increases, as premiums in the state increased 8.3% for single plans, 7.4% for employee-plus-one plans, and 7.4% for family plans. Employee contributions increased for single and employee-plus-one plans but decreased for the most expensive type of plan—family plans.
5. Iowa
The state of Iowa’s small businesses saw increased health insurance costs of 7.5% on an annualized basis over the past 3 years. On a per-employee basis, costs rose from $5,752 to $7,137.
Premiums in Iowa grew by 9.3% for single plans and 5.1% for family plans, but they fell (0.2%) for employee-plus-one plans on an annualized basis. Employee contributions grew for single and employee-plus-one plans, but they fell for family plans.
Ranking of States by Growth in Small Business Health Insurance Costs
Below is a ranking of the 50 states and the District of Columbia on the rate of growth in health insurance costs borne by small business employers, along with the average health insurance cost paid per employee by employers in each state in 2015 and 2018.
| Rank | State | 2018 | 2015 | Growth Rate |
|---|---|---|---|---|
| 1 | Nebraska | $7,751 | $4,875 | 16.7% |
| 2 | Indiana | $7,550 | $5,525 | 11.0% |
| 3 | South Carolina | $7,423 | $5,674 | 9.4% |
| 4 | New York | $10,167 | $7,818 | 9.2% |
| 5 | Iowa | $7,137 | $5,752 | 7.5% |
| 6 | Arkansas | $6,206 | $5,061 | 7.0% |
| 7 | South Dakota | $7,893 | $6,529 | 6.5% |
| 8 | North Dakota | $6,904 | $5,720 | 6.5% |
| 9 | Texas | $7,367 | $6,164 | 6.1% |
| 10 | Alabama | $6,709 | $5,654 | 5.9% |
| 11 | Kansas | $6,801 | $5,733 | 5.9% |
| 12 | New Mexico | $7,219 | $6,268 | 4.8% |
| 13 | New Jersey | $8,372 | $7,279 | 4.8% |
| 14 | Arizona | $6,628 | $5,767 | 4.8% |
| 15 | Washington | $6,993 | $6,097 | 4.7% |
| 16 | Idaho | $5,802 | $5,115 | 4.3% |
| 17 | Florida | $7,890 | $6,971 | 4.2% |
| 18 | California | $7,392 | $6,625 | 3.7% |
| 19 | Oregon | $7,313 | $6,643 | 3.3% |
| 20 | Louisiana | $6,460 | $5,894 | 3.1% |
| 21 | Missouri | $6,930 | $6,346 | 3.0% |
| 22 | Illinois | $8,198 | $7,600 | 2.6% |
| 23 | Connecticut | $7,887 | $7,313 | 2.6% |
| 24 | Alaska | $12,280 | $11,415 | 2.5% |
| 25 | Hawaii | $7,924 | $7,376 | 2.4% |
| 26 | Nevada | $6,351 | $5,926 | 2.3% |
| 27 | Minnesota | $6,213 | $5,809 | 2.3% |
| 28 | Montana | $7,606 | $7,112 | 2.3% |
| 29 | Maine | $6,511 | $6,091 | 2.2% |
| 30 | Maryland | $6,588 | $6,204 | 2.0% |
| 31 | Mississippi | $5,823 | $5,513 | 1.8% |
| 32 | Wisconsin | $7,774 | $7,459 | 1.4% |
| 33 | Massachusetts | $7,585 | $7,283 | 1.4% |
| 34 | Ohio | $7,114 | $6,848 | 1.3% |
| 35 | New Hampshire | $7,466 | $7,251 | 1.0% |
| 36 | Vermont | $7,408 | $7,206 | 0.9% |
| 37 | Oklahoma | $6,329 | $6,166 | 0.9% |
| 38 | Colorado | $6,900 | $6,733 | 0.8% |
| 39 | Utah | $5,828 | $5,700 | 0.7% |
| 40 | Pennsylvania | $7,382 | $7,443 | -0.3% |
| 41 | Kentucky | $6,377 | $6,444 | -0.3% |
| 42 | Wyoming | $7,174 | $7,363 | -0.9% |
| 43 | Tennessee | $5,883 | $6,057 | -1.0% |
| 44 | North Carolina | $5,809 | $6,010 | -1.1% |
| 45 | Rhode Island | $7,304 | $7,564 | -1.2% |
| 46 | Georgia | $6,365 | $6,625 | -1.3% |
| 47 | Virginia | $6,501 | $6,850 | -1.7% |
| 48 | Michigan | $7,190 | $7,644 | -2.0% |
| 49 | Delaware | $7,254 | $7,909 | -2.8% |
| 50 | District of Columbia | $8,197 | $9,156 | -3.6% |
| 51 | West Virginia | $7,165 | $8,085 | -3.9% |
Growth in Small Business Insurance Premiums
One of the primary drivers of small business insurance costs is the underlying cost of insurance. This is reflected in the premiums paid, which are partially funded by the employer and partially by employee contributions. Below, we list premiums growth rate in each of the 50 states and Washington, D.C., for the three major types of plans: single, employee-plus-one, and family plans.
| State | Single | Employee-Plus-One | Family |
|---|---|---|---|
| United States | 3.9% | 3.8% | 4.7% |
| Alabama | 3.6% | 2.2% | 5.1% |
| Alaska | 4.0% | 3.9% | 1.3% |
| Arizona | 3.9% | 5.2% | 4.9% |
| Arkansas | 3.9% | 2.9% | 16.6% |
| California | 2.5% | 5.9% | 4.9% |
| Colorado | -1.3% | -2.3% | 2.8% |
| Connecticut | 0.8% | -3.2% | 0.1% |
| Delaware | -1.9% | -2.3% | 7.2% |
| District of Columbia | 2.1% | 0.4% | 0.1% |
| Florida | 2.0% | 9.5% | 5.4% |
| Georgia | 4.1% | 0.4% | 0.9% |
| Hawaii | 3.2% | -3.3% | 4.8% |
| Idaho | 3.0% | 11.8% | 8.9% |
| Illinois | 5.2% | 1.4% | 8.2% |
| Indiana | 9.3% | 4.8% | 6.6% |
| Iowa | 9.3% | -0.2% | 5.1% |
| Kansas | 6.6% | 8.1% | 6.5% |
| Kentucky | 4.0% | -1.4% | 12.6% |
| Louisiana | 4.6% | 8.7% | 4.5% |
| Maine | 5.6% | 6.0% | 7.4% |
| Maryland | 2.6% | 0.1% | 3.5% |
| Massachusetts | 5.8% | 1.2% | 3.3% |
| Michigan | 2.2% | -2.6% | -0.2% |
| Minnesota | 8.5% | -1.8% | 7.2% |
| Mississippi | 6.7% | 6.0% | 5.8% |
| Missouri | 1.2% | 8.2% | 3.7% |
| Montana | 3.7% | -0.2% | 3.3% |
| Nebraska | 11.4% | 5.4% | 13.0% |
| Nevada | 0.1% | -1.0% | -2.6% |
| New Hampshire | 3.5% | 4.7% | 1.2% |
| New Jersey | 3.8% | 3.9% | 5.0% |
| New Mexico | 1.8% | 8.7% | 5.1% |
| New York | 8.3% | 7.4% | 7.4% |
| North Carolina | 3.0% | -0.1% | 0.9% |
| North Dakota | 4.3% | 6.7% | 5.0% |
| Ohio | 0.8% | 2.0% | 5.6% |
| Oklahoma | 2.4% | -0.1% | 1.5% |
| Oregon | 3.6% | 3.5% | 3.3% |
| Pennsylvania | -1.4% | 1.1% | 3.7% |
| Rhode Island | 3.0% | 2.3% | 3.5% |
| South Carolina | 5.1% | 6.0% | 9.2% |
| South Dakota | 6.7% | 2.0% | 7.8% |
| Tennessee | 1.6% | 3.5% | 3.4% |
| Texas | 9.7% | 9.0% | 9.3% |
| Utah | -0.4% | 4.2% | 0.9% |
| Vermont | 1.3% | 3.0% | 6.8% |
| Virginia | 3.1% | 6.4% | 5.1% |
| Washington | 4.8% | 5.9% | 12.6% |
| West Virginia | 4.7% | -3.3% | -0.1% |
| Wisconsin | 1.4% | 8.5% | -0.8% |
| Wyoming | 0.3% | -2.4% | 3.0% |
Methodology
This study was based upon data collected through the Medical Expenditure Panel Survey, which is conducted by the U.S. Department of Health & Human Services, Agency for Healthcare Research and Quality. We used data on average healthcare premiums paid by employers in all 50 states and the District of Columbia for the years 2015-2018.
Additionally, the average employee contribution to employee-sponsored health insurance plans in each state was subtracted from the average total health insurance premium in order to determine the employer’s total cost.
Our study considered three plan configurations: single coverage, which covers the employee only; employee-plus-one coverage, which covers the employee and one other family member; and family coverage, which covers the employee plus multiple family members.
To determine the proportion of each type of plan, our study used the nationwide averages of each type of plan in 2018 for companies with less than 50 employees. This proportion was 63.2% of employees who elected single coverage, 14.8% who elected employee-plus-one coverage, and 22% who elected family coverage.
To determine the cost per employee, we calculated a blended cost across the different plan configurations to calculate an average cost to the employer for each employee for each state. We then calculated the compounded annual growth rate from 2015-2018 of this cost metric for each state and ranked the states based on the growth rate.
Sources
1. US Department of Health & Human Services, Agency for Healthcare Research and Quality, Medical Expenditure Panel Survey