


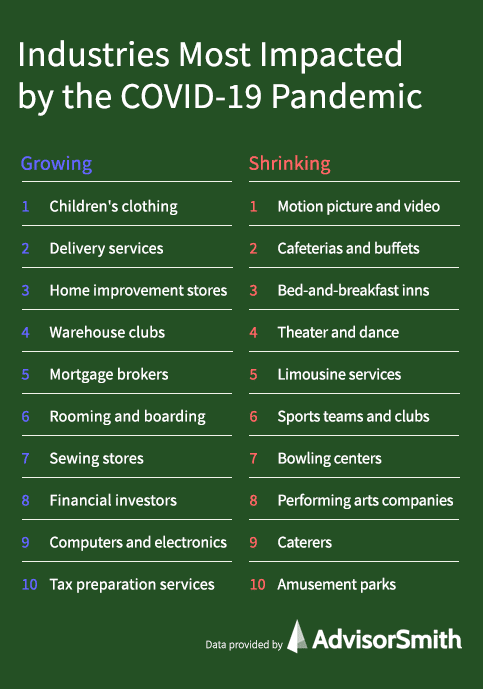
The coronavirus pandemic has had a major impact on the U.S. economy, with shutdowns having major effects on brick-and-mortar businesses in food and hospitality, live entertainment, and more. In the midst of the economic downturn, there are bright spots in the economy as businesses and consumers shift their behavior to adjust to the current realities of the pandemic. In this study, AdvisorSmith examines the industries that are thriving in spite of or because of the effects of the economy.
To determine the industries that are thriving, AdvisorSmith examined seasonally adjusted employment in 881 American industries, comparing industry employment in August 2020 to the industry employment in January. We calculated the percentage growth in employment in each industry and ranked the industries based upon their percentage employment growth. To find the industries that are thriving, we identified 100 industries where employment has remained level or increased during the pandemic.
Additionally, we found the 100 industries that have been hit hardest by the pandemic, with the largest decreases in employment over the course of the year. Most of these industries are related to travel, dining, or entertainment. Overall, the U.S. economy lost about 10.5 million jobs between January and September 2020, a drop of approximately 7.4%. About 9.6 million of the jobs lost were in the private sector.

Industries with 2020’s Best Employment Growth
1. Children’s and infants’ clothing stores
January 2020 Employment (thousands): 42.8
August 2020 Employment (thousands): 56.9
Employment Growth Rate: 32.9%
While most children’s and infants’ clothing stores closed during the height of business shutdowns in March 2020, the ability to sell through online platforms kept these retail stores growing, as e-commerce overall has experienced a large boom during the pandemic. Additionally, with more families and parents staying home due to the pandemic, parents have been spending more time with their children, leading to an overall increase in spending on children, from educational activities and toys to clothing. These factors, along with federal stimulus helping small businesses and retail clothing stores being some of the first stores to re-open after shutdown restrictions were lifted, led to increased employment in children’s and infants’ clothing stores.
2. Local messengers and delivery and private postal service
January 2020 Employment (thousands): 113.1
August 2020 Employment (thousands): 130.6
Employment Growth Rate: 15.5%
Due to many people staying home to avoid exposure to others, there has been an increase in ordering merchandise, food, groceries, and other goods to be delivered to homes. This increase in delivery has led to increased demand for local delivery services and created a resulting increase in employment in local messengers and delivery services.
3. Home centers
January 2020 Employment (thousands): 709.4
August 2020 Employment (thousands): 806.1
Employment Growth Rate: 13.6%
Home centers are home improvement stores that offer a combination of products from hardware stores and lumberyards. The most well-known home centers include Home Depot and Lowe’s. With many Americans choosing to socially distance themselves, they are spending increasing amounts of time in their homes. This increased exposure to the home has led many Americans to pursue home improvement projects to spruce up their living spaces. Additionally, with sales of existing homes being strong, remodeling projects have also been a priority for those who are choosing to move to new homes.
4. Warehouse clubs and supercenters
January 2020 Employment (thousands): 1,450.3
August 2020 Employment (thousands): 1,628.9
Employment Growth Rate: 12.3%
A major casualty of the pandemic has been the restaurant industry, with many Americans choosing to stay home and cook rather than risk exposure to the virus in dining rooms where it is not as easy to socially distance themselves. A primary beneficiary of this trend are warehouse clubs and supercenters, which offer discounted groceries, as well as other discounted products for the home. Employment in this industry has surged to keep up with the demand for people spending additional time in their homes.
5. Mortgage and nonmortgage loan brokers
January 2020 Employment (thousands): 89.3
August 2020 Employment (thousands): 100.0
Employment Growth Rate: 12.0%
One response of the Federal Reserve to the pandemic has been to slash interest rates to a target range of 0%-0.25% in March. This reduction in interest rates has led to a reduction in borrowing costs for borrowers. In particular, mortgage rates have dropped to historic lows, with average rates for traditional 30-year fixed-rate mortgages dropping as low as 2.8% near the end of October 2020. These low rates have led to a boom in refinancing, as homeowners seek to reduce their monthly mortgage payments. The refinancing boom, along with a strong purchase market, has led to growth in demand for mortgage and other loan brokers.
| Rank | Industry | Employment (Jan 2020) | Employment (Aug 2020) | Employment Growth |
|---|---|---|---|---|
| 1 | Children's and infants' clothing stores | 42.8 | 56.9 | 32.9% |
| 2 | Local messengers and delivery and private postal service | 113.1 | 130.6 | 15.5% |
| 3 | Home centers | 709.4 | 806.1 | 13.6% |
| 4 | Warehouse clubs and supercenters | 1,450.3 | 1,628.9 | 12.3% |
| 5 | Mortgage and nonmortgage loan brokers | 89.3 | 100.0 | 12.0% |
| 6 | All other traveler accommodation and rooming and boarding houses | 24.5 | 27.0 | 10.2% |
| 7 | Sewing, needlework, and piece goods stores | 36.6 | 39.9 | 9.0% |
| 8 | Financial investors | 28.9 | 31.5 | 9.0% |
| 9 | Miscellaneous computer and electronic products | 32.6 | 35.2 | 8.0% |
| 10 | Tax preparation services | 88.4 | 95.1 | 7.6% |
| 11 | Building material and supplies dealers | 1,149.0 | 1,230.5 | 7.1% |
| 12 | Couriers and express delivery services | 747.7 | 797.9 | 6.7% |
| 13 | New multifamily general contractors | 38.4 | 40.7 | 6.0% |
| 14 | Surgical appliances and supplies | 105.2 | 111.5 | 6.0% |
| 15 | Motor vehicle power train components | 78.5 | 83.1 | 5.9% |
| 16 | Other building exterior contractors | 46.1 | 48.8 | 5.9% |
| 17 | General merchandise stores | 3,046.6 | 3,218.2 | 5.6% |
| 18 | Roofing, siding, and other construction materials | 70.1 | 74.0 | 5.6% |
| 19 | Animal slaughtering, except poultry | 143.3 | 151.0 | 5.4% |
| 20 | Breakfast cereal | 13.2 | 13.9 | 5.3% |
| 21 | Real estate credit | 219.5 | 230.8 | 5.1% |
| 22 | Soaps and cleaning compounds | 55.6 | 58.4 | 5.0% |
| 23 | Real estate appraisers | 32.6 | 34.1 | 4.6% |
| 24 | Art dealers | 15.7 | 16.3 | 3.8% |
| 25 | Ornamental and architectural metal work | 44.5 | 46.1 | 3.6% |
| 26 | Research and development in biotechnology, except nanobiotechnology | 218.4 | 226.1 | 3.5% |
| 27 | Agricultural chemicals | 36.7 | 37.9 | 3.3% |
| 28 | Supermarkets and other grocery stores | 2,539.4 | 2,615.3 | 3.0% |
| 29 | Small arms, ammunition, and other ordnance and accessories | 45.1 | 46.3 | 2.7% |
| 30 | Tires | 58.5 | 59.9 | 2.4% |
| 31 | New housing builders (speculative builders) | 41.9 | 42.9 | 2.4% |
| 32 | Grocery stores | 2,703.9 | 2,768.3 | 2.4% |
| 33 | General warehousing and storage | 1,073.5 | 1,096.7 | 2.2% |
| 34 | Internet publishing and broadcasting and web search portals | 286.0 | 291.9 | 2.1% |
| 35 | Activities related to credit intermediation | 305.7 | 311.7 | 2.0% |
| 36 | Electronic shopping and mail-order houses | 374.4 | 381.5 | 1.9% |
| 37 | Veterinary services | 408.3 | 416.0 | 1.9% |
| 38 | Search, detection, and navigation instruments | 137.9 | 140.5 | 1.9% |
| 39 | Electromedical apparatus | 75.4 | 76.8 | 1.9% |
| 40 | Warehousing and storage | 1,200.4 | 1,221.6 | 1.8% |
| 41 | Miscellaneous professional and similar organizations | 165.3 | 168.2 | 1.8% |
| 42 | Nursery, garden, and farm supply stores | 127.0 | 129.2 | 1.7% |
| 43 | Claims adjusting | 52.3 | 53.2 | 1.7% |
| 44 | Guided missiles, space vehicles, and parts | 88.2 | 89.6 | 1.6% |
| 45 | Direct life insurance carriers | 348.2 | 353.7 | 1.6% |
| 46 | Animal food | 63.9 | 64.9 | 1.6% |
| 47 | Motor vehicle seating and interior trim | 78.4 | 79.5 | 1.4% |
| 48 | Lawn and garden equipment and supplies stores | 157.1 | 159.3 | 1.4% |
| 49 | Folding boxes and miscellaneous paperboard containers | 52.4 | 53.1 | 1.3% |
| 50 | Sporting goods | 53.6 | 54.3 | 1.3% |
| 51 | Food and beverage stores | 3,091.4 | 3,131.6 | 1.3% |
| 52 | Securities brokerage | 279.2 | 282.6 | 1.2% |
| 53 | Investment advice | 202.4 | 204.8 | 1.2% |
| 54 | Snack food | 59.4 | 60.1 | 1.2% |
| 55 | Credit card issuing | 71.9 | 72.7 | 1.1% |
| 56 | Community food services | 37.0 | 37.4 | 1.1% |
| 57 | All other wood products | 68.9 | 69.6 | 1.0% |
| 58 | Construction sand and gravel mining | 30.1 | 30.4 | 1.0% |
| 59 | Other information services | 351.9 | 355.4 | 1.0% |
| 60 | Other management consulting services | 107.8 | 108.8 | 0.9% |
| 61 | Other financial investment activities, including funds and trusts | 512.2 | 516.8 | 0.9% |
| 62 | Pharmaceutical preparations | 212.4 | 214.3 | 0.9% |
| 63 | Federal hospitals | 359.1 | 362.3 | 0.9% |
| 64 | State hospitals | 392.3 | 395.7 | 0.9% |
| 65 | Animal slaughtering and processing | 534.3 | 538.6 | 0.8% |
| 66 | Offices of chiropractors | 140.3 | 141.4 | 0.8% |
| 67 | Metal windows and doors | 65.6 | 66.1 | 0.8% |
| 68 | Research and development in the physical, engineering, and life sciences | 679.8 | 684.9 | 0.8% |
| 69 | Direct title insurance and other direct insurance carriers | 93.9 | 94.6 | 0.7% |
| 70 | Nonupholstered wood household furniture | 28.7 | 28.9 | 0.7% |
| 71 | Insurance agencies and brokerages | 850.6 | 856.1 | 0.6% |
| 72 | Refrigerated warehousing and storage | 66.7 | 67.1 | 0.6% |
| 73 | Semiconductors and related devices | 186.5 | 187.6 | 0.6% |
| 74 | Other nondepository credit intermediation | 416.3 | 418.7 | 0.6% |
| 75 | Farm product raw materials | 70.1 | 70.5 | 0.6% |
| 76 | Soft drinks | 78.7 | 79.1 | 0.5% |
| 77 | Plastics packaging materials, film, and sheet | 99.2 | 99.7 | 0.5% |
| 78 | Nuclear and other electric power generation | 61.3 | 61.6 | 0.5% |
| 79 | Grains and field beans | 41.2 | 41.4 | 0.5% |
| 80 | Credit bureaus | 22.3 | 22.4 | 0.4% |
| 81 | Direct life and health insurance carriers | 931.9 | 935.8 | 0.4% |
| 82 | Computer and peripheral equipment | 169.1 | 169.8 | 0.4% |
| 83 | Direct property and casualty insurers | 559.1 | 561.3 | 0.4% |
| 84 | Scientific research and development services | 744.7 | 747.6 | 0.4% |
| 85 | Petrochemicals, industrial gases, synthetic dyes, and pigments | 56.8 | 57.0 | 0.4% |
| 86 | Direct insurers, except life and health | 653.2 | 655.5 | 0.4% |
| 87 | Securities, commodity contracts, investments, and funds and trusts | 967.7 | 970.6 | 0.3% |
| 88 | Other technical consulting services | 201.3 | 201.9 | 0.3% |
| 89 | Pharmaceuticals and medicines | 308.8 | 309.6 | 0.3% |
| 90 | Sporting and athletic goods | 43.6 | 43.7 | 0.2% |
| 91 | Insurance carriers | 1,614.1 | 1,617.7 | 0.2% |
| 92 | Building inspection, surveying, and mapping services | 90.8 | 91.0 | 0.2% |
| 93 | Soaps, cleaning compounds, and toiletries | 110.6 | 110.8 | 0.2% |
| 94 | Insurance carriers and related activities | 2,814.0 | 2,818.8 | 0.2% |
| 95 | Kidney dialysis centers | 131.9 | 132.1 | 0.2% |
| 96 | Oil and gas extraction | 155.8 | 156.0 | 0.1% |
| 97 | Hardware stores | 158.6 | 158.7 | 0.1% |
| 98 | Insurance agencies, brokerages, and related services | 1,200.5 | 1,200.7 | 0.0% |
| 99 | Meat processed from carcasses, and rendering and meat byproduct processing | 142.3 | 142.3 | 0.0% |
| 100 | All other financial investment activities, including funds and trusts | 63.0 | 63.0 | 0.0% |
Hardest-Hit Industries in 2020
1. Motion picture and video exhibition
January 2020 Employment (thousands): 158.2
August 2020 Employment (thousands): 30.7
Employment Growth Rate: -80.6%
The movie theater industry has been one of the hardest-hit industries, as many are closed due to local restrictions on the number of people who can gather indoors. In addition, demand for theaters in places where they are open has been weak, as many people fear the possibility of a superspreader event while sharing the same air with strangers for an extended period of several hours.
2. Cafeterias, grill buffets, and buffets
January 2020 Employment (thousands): 111.6
August 2020 Employment (thousands): 36.8
Employment Growth Rate: -67.0%
The entire restaurant industry has been devastated by the pandemic, and cafeterias and buffets have been especially hard hit, as many patrons are hesitant to share serving utensils or common food with others. Additionally, in many states, indoor dining has been disallowed or capacity constrained in some way.
3. Bed-and-breakfast inns
January 2020 Employment (thousands): 16.4
August 2020 Employment (thousands): 7.3
Employment Growth Rate: -55.5%
Tourism is another industry that has been hard hit by the pandemic, and employment in bed-and-breakfasts has decreased substantially. In particular, the social nature of bed-and-breakfasts, in which customers can eat a communal breakfast in the kitchen, has less appeal for those trying to social distance.
4. Theater, dance, and other performing arts companies
January 2020 Employment (thousands): 95.8
August 2020 Employment (thousands): 43.3
Employment Growth Rate: -54.8%
Live entertainment has also been decimated by the pandemic, as indoor events with many people are potentially dangerous for virus spread. For performing arts companies, this has led to large decreases in employment.
5. Limousine service
January 2020 Employment (thousands): 37.3
August 2020 Employment (thousands): 17.0
Employment Growth Rate: -54.4%
With many social events canceled due to the pandemic, the need for limousine services for events such as weddings, school dances, bachelor and bachelorette parties, and the like has diminished significantly. Employment in the limousine service industry has more than halved over the course of the pandemic.
| Rank | Industry | Employment (Jan 2020) | Employment (Aug 2020) | Employment Growth |
|---|---|---|---|---|
| 1 | Motion picture and video exhibition | 158.2 | 30.7 | -80.6% |
| 2 | Cafeterias, grill buffets, and buffets | 111.6 | 36.8 | -67.0% |
| 3 | Bed-and-breakfast inns | 16.4 | 7.3 | -55.5% |
| 4 | Theater, dance, and other performing arts companies | 95.8 | 43.3 | -54.8% |
| 5 | Limousine service | 37.3 | 17.0 | -54.4% |
| 6 | Sports teams and clubs | 101.0 | 47.3 | -53.2% |
| 7 | Bowling centers | 70.2 | 34.2 | -51.3% |
| 8 | Performing arts companies | 132.5 | 65.4 | -50.6% |
| 9 | Caterers and mobile food services | 200.4 | 99.0 | -50.6% |
| 10 | Amusement parks and arcades | 229.5 | 117.8 | -48.7% |
| 11 | Arts and sports promoters and agents and managers for public figures | 182.3 | 94.0 | -48.4% |
| 12 | Motion picture and sound recording industries | 456.8 | 241.1 | -47.2% |
| 13 | Performing arts and spectator sports | 516.8 | 274.0 | -47.0% |
| 14 | Spectator sports | 146.5 | 79.2 | -45.9% |
| 15 | Tour operators | 31.2 | 17.3 | -44.6% |
| 16 | Book stores and news dealers | 80.6 | 45.0 | -44.2% |
| 17 | Drinking places, alcoholic beverages | 391.5 | 224.6 | -42.6% |
| 18 | Racetracks | 23.8 | 13.7 | -42.4% |
| 19 | Scenic and sightseeing transportation | 36.2 | 20.9 | -42.3% |
| 20 | Parking lots and garages | 142.2 | 82.3 | -42.1% |
| 21 | Casinos, except casino hotels | 76.1 | 44.7 | -41.3% |
| 22 | Fitness and recreational sports centers | 664.8 | 396.4 | -40.4% |
| 23 | Women's clothing stores | 256.2 | 152.8 | -40.4% |
| 24 | Motion picture and video production | 248.0 | 149.8 | -39.6% |
| 25 | Taxi and limousine service | 70.5 | 42.6 | -39.6% |
| 26 | Convention and trade show organizers | 69.8 | 42.2 | -39.5% |
| 27 | Special food services | 721.8 | 441.1 | -38.9% |
| 28 | Gambling industries | 115.6 | 71.1 | -38.5% |
| 29 | Hotels and motels, except casino hotels | 1,696.2 | 1,048.6 | -38.2% |
| 30 | Civic and social organizations | 389.5 | 242.2 | -37.8% |
| 31 | Traveler accommodation | 2,019.2 | 1,263.1 | -37.4% |
| 32 | Accommodation | 2,095.4 | 1,314.9 | -37.2% |
| 33 | Independent artists, writers, and performers | 52.7 | 33.2 | -37.0% |
| 34 | Musical groups and artists | 35.7 | 22.5 | -37.0% |
| 35 | Travel agencies | 91.2 | 58.9 | -35.4% |
| 36 | Cosmetic and beauty supply stores | 173.4 | 112.5 | -35.1% |
| 37 | Arts, entertainment, and recreation | 2,480.7 | 1,609.6 | -35.1% |
| 38 | Casino hotels | 280.5 | 182.3 | -35.0% |
| 39 | Food service contractors | 523.3 | 341.6 | -34.7% |
| 40 | School and employee bus transportation | 212.2 | 139.7 | -34.2% |
| 41 | Other gambling industries | 39.8 | 26.4 | -33.7% |
| 42 | Clothing accessories stores | 49.4 | 33.3 | -32.6% |
| 43 | Amusements, gambling, and recreation | 1,787.9 | 1,209.3 | -32.4% |
| 44 | Transit and ground passenger transportation | 507.5 | 346.2 | -31.8% |
| 45 | Passenger car rental and leasing | 136.5 | 93.8 | -31.3% |
| 46 | Museums | 103.3 | 71.2 | -31.1% |
| 47 | Family clothing stores | 453.7 | 314.6 | -30.7% |
| 48 | Men's clothing stores | 49.5 | 34.4 | -30.5% |
| 49 | Travel arrangement and reservation services | 223.1 | 156.0 | -30.1% |
| 50 | Other amusement and recreation industries | 1,434.9 | 1,008.1 | -29.7% |
| 51 | Clothing stores | 967.1 | 680.1 | -29.7% |
| 52 | Airport operations | 112.6 | 79.9 | -29.0% |
| 53 | Document preparation services | 49.0 | 34.9 | -28.8% |
| 54 | Clothing and clothing accessories stores | 1,290.3 | 924.4 | -28.4% |
| 55 | All other amusement and recreation industries | 244.8 | 175.4 | -28.3% |
| 56 | Drycleaning and laundry services, except coin-operated | 120.0 | 86.0 | -28.3% |
| 57 | Museums, historical sites, and similar institutions | 176.0 | 126.3 | -28.2% |
| 58 | Support activities for oil and gas operations | 247.8 | 178.4 | -28.0% |
| 59 | Support activities for mining | 312.7 | 225.5 | -27.9% |
| 60 | Marinas | 45.2 | 32.7 | -27.7% |
| 61 | Automobiles | 137.5 | 101.2 | -26.4% |
| 62 | Hobby, toy, and game stores | 128.0 | 94.6 | -26.1% |
| 63 | Shoe stores | 194.2 | 144.8 | -25.4% |
| 64 | Full-service restaurants | 5,608.2 | 4,189.9 | -25.3% |
| 65 | Cut and sew apparel contractors | 30.7 | 23.1 | -24.8% |
| 66 | Urban, interurban, rural, and charter bus transportation | 108.8 | 82.1 | -24.5% |
| 67 | Historical sites and other similar institutions | 72.6 | 54.8 | -24.5% |
| 68 | Leisure and hospitality | 16,808.0 | 12,709.0 | -24.4% |
| 69 | Musical instrument and supplies stores | 32.8 | 24.9 | -24.1% |
| 70 | Other personal services | 363.6 | 276.4 | -24.0% |
| 71 | Skiing facilities | 43.8 | 33.3 | -24.0% |
| 72 | Linen supply | 67.2 | 51.1 | -24.0% |
| 73 | Gift, novelty, and souvenir stores | 135.5 | 104.1 | -23.2% |
| 74 | Other ground passenger transportation | 116.4 | 89.5 | -23.1% |
| 75 | Oil and gas pipeline construction | 152.4 | 117.4 | -23.0% |
| 76 | Golf courses and country clubs | 370.9 | 286.0 | -22.9% |
| 77 | Motor vehicles | 236.4 | 182.5 | -22.8% |
| 78 | Accommodation and food services | 14,327.7 | 11,099.7 | -22.5% |
| 79 | Sports and recreation instruction | 146.3 | 113.6 | -22.4% |
| 80 | Office equipment and other machinery rental and leasing | 85.7 | 66.6 | -22.3% |
| 81 | Other clothing stores | 115.4 | 89.9 | -22.1% |
| 82 | Drycleaning and laundry services | 291.1 | 227.5 | -21.8% |
| 83 | Jewelry, luggage, and leather goods stores | 126.8 | 99.2 | -21.8% |
| 84 | Scheduled air transportation | 462.1 | 362.4 | -21.6% |
| 85 | Advertising material distribution and other advertising services | 113.8 | 89.7 | -21.2% |
| 86 | Cut and sew apparel | 80.3 | 63.4 | -21.0% |
| 87 | Miscellaneous schools and instruction | 218.5 | 172.9 | -20.9% |
| 88 | Other schools and instruction | 482.4 | 381.9 | -20.8% |
| 89 | Automotive equipment rental and leasing | 227.4 | 180.3 | -20.7% |
| 90 | Fine arts schools | 118.1 | 93.8 | -20.6% |
| 91 | Air transportation | 509.2 | 405.9 | -20.3% |
| 92 | Other travel arrangement services | 99.8 | 79.6 | -20.2% |
| 93 | Food services and drinking places | 12,232.3 | 9,784.8 | -20.0% |
| 94 | Linen and uniform supply | 134.7 | 107.9 | -19.9% |
| 95 | Frozen fruits and vegetables | 33.3 | 26.7 | -19.8% |
| 96 | Child day care services | 1,036.8 | 835.3 | -19.4% |
| 97 | Cut and sew apparel, except contractors | 49.7 | 40.2 | -19.1% |
| 98 | Taxi service | 33.0 | 26.7 | -19.1% |
| 99 | Other personal care services | 171.9 | 139.5 | -18.8% |
| 100 | Office supplies, stationery, and gift stores | 227.8 | 184.9 | -18.8% |
Methodology
AdvisorSmith used industry data published by the U.S. Bureau of Labor Statistics to determine the industries where employment has increased and decreased the most during 2020. To find these industries, we used seasonally adjusted employment data from January 2020, before the coronavirus pandemic had a major impact on the U.S. economy, and August 2020, the most recent data available.
We calculated the employment growth rate for 881 U.S. industries and ranked the top 100 and bottom 100 by employment growth rate. The top 100 represented the industries that were thriving in the current economy because they added workers between January and August. The hardest-hit industries were those that lost the most jobs between January and August. We excluded government jobs from our top 100 list.
Sources
- U.S. Bureau of Labor Statistics, Current Employment Statistics, Employment, Hours, and Earnings – National