


Education is often an important factor in determining the health of local economies. The quality of local education, as well as the size and reach of schools, can directly influence the number and type of businesses, jobs, and social opportunities in an area. In our deep dive into education in the United States, we took a look at educational attainment levels across different metropolitan areas around the nation and examined which cities were the most and least educated.
Our study was based on data from the U.S. Census Bureau’s American Community Survey. We analyzed data from 511 metropolitan areas and assigned a composite score to each one based on a proprietary scoring model. Our scoring model assigned points to each city based on the percentage of the population that had attained different educational attainment levels. These educational attainment levels were: high school graduate, associate’s degree holder, bachelor’s degree holder, and graduate or professional degree holder. Graduate or professional degrees include master’s degrees, doctoral graduate degrees, and professional degrees like juris doctor degrees and master of social work degrees.
Our study only included adults aged 25 or older in the study. Nationwide, 219.8 million people fit into this category. Out of those people, 197.4 million, or 89.8% of adults aged 25 or older, have attained at least a high school diploma. Also, 76.9 million people, or 35.0%, have at least a bachelor’s degree, and 28.7 million people, or 13.1%, have a graduate or professional degree.
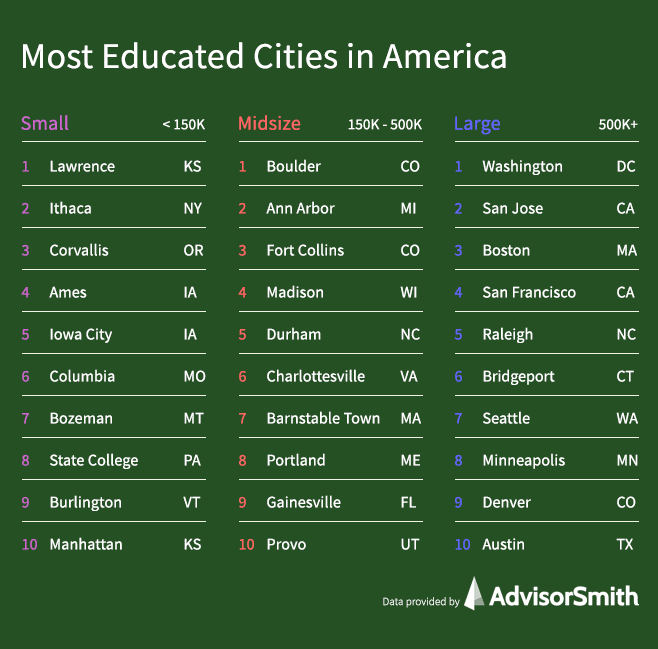
Most Educated Cities by City Size
The population used for each city was the number of adults aged 25 or older within the metropolitan statistical area. Cities were segmented into small (<150,000 population), midsize (population between 150,000 and 500,000), and large (over 500,000 population) based on these adjusted numbers.
The majority of the most educated cities in America were small and midsize cities with major universities, but the top 50 consisted of a fairly even mix of small, midsize, and large cities.

Most Educated Cities in America
1. Boulder, CO
Boulder is a midsize city in northern Colorado that is home to the University of Colorado, Boulder, and Naropa University, a private university. University of Colorado, Boulder, is the largest university in Colorado and enrolls approximately 36,000 students every year. It is known for its research and graduate school programs and is the only university in the Rocky Mountain region to gain acceptance into the Association of American Universities. Outside the school, Boulder fields a lively atmosphere with plenty of outdoor opportunities, including ski slopes and miles of walking and biking trails.
In our study, Boulder was the city with the highest percentage of people attaining a bachelor’s degree or higher at 62.5% of the metro area population. Boulder had the fourth-highest percentage of population with a graduate or professional degree at 27.8%.
2. Lawrence, KS
Lawrence, Kansas, is a small city in northeast Kansas that is home to the University of Kansas and Haskell Indian Nations University, a tribal university. The University of Kansas is the largest public university in the state and enrolls more than 27,000 students every year. It is known for its comprehensive research and teaching facilities, and it offers more than 170 different academic programs between its undergraduate and graduate schools. The sizable student population at the University of Kansas lends Lawrence a small college town feel.
Lawrence had the second-highest percentage of population with a graduate or professional degree at 29.3%. It also had the third-highest percentage of people with a bachelor’s degree or higher at 56.2%, and the third-highest percentage with a high school diploma or higher at 96.6%. Overall, Lawrence was the most educated small city in the study.
3. Ann Arbor, MI
Ann Arbor, Michigan, is a midsize city in southern Michigan that is home to the University of Michigan, one of the top research universities in the nation and the oldest university in Michigan. Much of life and work in Ann Arbor revolve around the University of Michigan, which enrolls over 45,000 students per year and serves as an employer for over 30,000 people in the region. Ann Arbor is also a college town like many of the other cities in the top five.
Ann Arbor is the second-most educated midsize city in our study. 95.3% of people in the Ann Arbor metropolitan area have attained a high school diploma or higher. 56.4% of the population have attained at least a bachelor’s degree, which is the second-highest percentage for that educational attainment level in the nation. Lastly, 29.2% of people in the Ann Arbor metropolitan area have a graduate or professional degree, the third-highest percentage in the nation.
4. Ithaca, NY
Ithaca is a small city in central New York known for being the host of Cornell University, an Ivy League school and one of the top universities in the nation. Every year, more than 20,000 students study at Cornell University, directly bolstering the local economy and businesses. The large influx of students is also supported by students at Ithaca College, a private university, and Tompkins Cortland Community College. Together, these three schools contribute to the high rates of educational attainment in the Ithaca metropolitan area.
Among all cities in our study, Ithaca had the highest percentage with a graduate or professional degree at 30.9% of the metro area population. It also had the sixth-highest percentage with a bachelor’s degree or higher at 51.9%, and one of the highest percentages with a high school diploma or higher at 93.7% of the metro area population.
5. Corvallis, OR
Corvallis, Oregon, is a small city in western Oregon that serves as the home of Oregon State University, Oregon’s largest public research university. Oregon State University is home to more than 30,000 students every school year and functions as a major employer in the area like many other college towns. Located only an hour away from the Pacific Coast and surrounded by lush forests, Corvallis enjoys an amenable small town atmosphere with a variety of outdoor opportunities.
Corvallis had the fourth-highest percentage with a high school diploma or higher at 96.1% of the metro area population. It also had the fourth-highest percentage of people with at least a bachelor’s degree at 53.4% of the population.
Top 50 Most Educated Cities
Listed below are the top 50 most educated cities in the U.S. We include the population aged 25 and over, along with the percentage of residents with the following education levels: less than 9th grade, 9th to 12th grade with no diploma, high school graduates, some college but no degree, associate’s degree holders, bachelor’s degree holders, and graduate or professional degree holders. We also list our educational attainment score for each city.
| Rank | City | City Size | Total Score | Less than 9th grade | 9th to 12th grade, no diploma | High school graduate (includes equivalency) | Some college, no degree | Associate's degree | Bachelor's degree | Graduate or professional degree | Population 25 years old and over |
|---|---|---|---|---|---|---|---|---|---|---|---|
| 1 | Boulder, CO | Midsize | 70.0 | 1.4% | 2.8% | 10.9% | 16.6% | 5.7% | 34.7% | 27.8% | 216,163 |
| 2 | Lawrence, KS | Small | 68.3 | 0.9% | 2.5% | 14.9% | 18.9% | 6.6% | 26.9% | 29.3% | 71,392 |
| 3 | Ann Arbor, MI | Midsize | 67.9 | 1.0% | 3.7% | 14.4% | 17.4% | 7.1% | 27.2% | 29.2% | 232,636 |
| 4 | Ithaca, NY | Small | 66.3 | 2.9% | 3.4% | 19.3% | 13.2% | 9.4% | 21.0% | 30.9% | 59,759 |
| 5 | Corvallis, OR | Small | 66.3 | 2.0% | 1.9% | 14.9% | 20.6% | 7.2% | 28.2% | 25.2% | 55,736 |
| 6 | Ames, IA | Small | 66.2 | 1.0% | 1.8% | 16.0% | 16.9% | 13.5% | 28.9% | 21.8% | 51,425 |
| 7 | Iowa City, IA | Small | 64.9 | 2.4% | 2.3% | 16.9% | 18.8% | 10.3% | 24.2% | 25.1% | 103,619 |
| 8 | Columbia, MO | Small | 63.4 | 1.5% | 3.3% | 19.0% | 20.6% | 7.3% | 26.0% | 22.4% | 107,408 |
| 9 | Washington, DC | Large | 63.4 | 4.2% | 4.5% | 17.9% | 15.8% | 6.1% | 26.1% | 25.4% | 4,268,088 |
| 10 | San Jose, CA | Large | 63.2 | 6.1% | 4.8% | 14.1% | 14.8% | 7.4% | 28.0% | 24.8% | 1,390,276 |
| 11 | Bozeman, MT | Small | 63.1 | 1.5% | 1.8% | 17.9% | 23.3% | 7.0% | 30.2% | 18.3% | 71,796 |
| 12 | Fort Collins, CO | Midsize | 62.8 | 1.3% | 3.5% | 16.5% | 21.7% | 9.3% | 28.3% | 19.3% | 232,676 |
| 13 | State College, PA | Small | 62.6 | 2.2% | 3.2% | 28.9% | 11.6% | 7.4% | 23.5% | 23.2% | 97,947 |
| 14 | Boston, MA | Large | 62.2 | 4.3% | 4.0% | 21.1% | 14.4% | 7.0% | 26.4% | 22.7% | 3,417,972 |
| 15 | San Francisco, CA | Large | 62.0 | 5.1% | 4.8% | 15.7% | 16.8% | 6.6% | 29.9% | 21.1% | 3,432,405 |
| 16 | Madison, WI | Midsize | 61.9 | 1.9% | 3.4% | 20.8% | 18.0% | 10.2% | 27.1% | 18.6% | 443,182 |
| 17 | Durham, NC | Midsize | 61.8 | 4.7% | 4.7% | 19.2% | 15.3% | 8.0% | 24.4% | 23.7% | 391,802 |
| 18 | Raleigh, NC | Large | 61.5 | 3.3% | 4.3% | 17.6% | 18.0% | 8.8% | 30.3% | 17.7% | 914,534 |
| 19 | Bridgeport, CT | Large | 61.1 | 5.4% | 4.5% | 20.6% | 14.5% | 6.7% | 26.8% | 21.6% | 645,814 |
| 20 | Burlington, VT | Small | 61.0 | 1.3% | 4.9% | 22.9% | 16.2% | 9.0% | 28.6% | 17.1% | 149,236 |
| 21 | Manhattan, KS | Small | 60.9 | 1.3% | 4.1% | 20.5% | 22.3% | 6.9% | 25.7% | 19.1% | 51,924 |
| 22 | Charlottesville, VA | Midsize | 60.7 | 2.9% | 7.6% | 21.2% | 15.6% | 4.8% | 23.9% | 24.0% | 159,172 |
| 23 | Bloomington, IL | Small | 60.4 | 1.0% | 3.2% | 25.3% | 19.4% | 8.1% | 26.8% | 16.2% | 117,675 |
| 24 | Barnstable Town, MA | Midsize | 60.4 | 1.3% | 4.2% | 24.0% | 18.7% | 10.0% | 22.6% | 19.2% | 166,596 |
| 25 | Champaign, IL | Small | 60.2 | 1.3% | 4.8% | 23.0% | 20.2% | 8.8% | 20.8% | 21.0% | 140,821 |
| 26 | Bloomington, IN | Small | 60.1 | 1.7% | 5.3% | 23.6% | 18.2% | 8.5% | 21.9% | 20.8% | 98,957 |
| 27 | Seattle, WA | Large | 59.8 | 3.0% | 4.1% | 19.1% | 20.8% | 9.3% | 26.8% | 16.8% | 2,769,714 |
| 28 | Portland, ME | Midsize | 59.7 | 2.0% | 2.9% | 24.7% | 19.5% | 9.5% | 25.8% | 15.7% | 394,599 |
| 29 | Minneapolis, MN | Large | 59.6 | 2.7% | 3.5% | 20.9% | 19.8% | 10.5% | 27.8% | 14.8% | 2,466,476 |
| 30 | Gainesville, FL | Midsize | 59.5 | 3.9% | 4.0% | 21.4% | 17.8% | 11.4% | 23.2% | 18.4% | 181,137 |
| 31 | Missoula, MT | Small | 59.5 | 1.2% | 3.2% | 20.3% | 25.1% | 10.6% | 23.8% | 15.9% | 81,094 |
| 32 | Denver, CO | Large | 59.4 | 3.7% | 4.9% | 19.6% | 19.3% | 7.8% | 28.3% | 16.5% | 2,039,409 |
| 33 | Austin, TX | Large | 59.2 | 4.9% | 5.0% | 18.7% | 18.5% | 6.3% | 29.6% | 16.9% | 1,458,805 |
| 34 | Provo, UT | Midsize | 59.1 | 2.0% | 3.6% | 17.1% | 24.9% | 11.0% | 28.3% | 13.1% | 315,665 |
| 35 | Rochester, MN | Small | 59.1 | 2.6% | 3.6% | 23.2% | 17.8% | 13.7% | 23.0% | 16.1% | 149,921 |
| 36 | Lincoln, NE | Midsize | 58.9 | 2.9% | 3.2% | 21.6% | 20.0% | 11.7% | 26.1% | 14.4% | 208,853 |
| 37 | Helena, MT | Small | 58.6 | 1.5% | 4.1% | 22.1% | 22.9% | 10.4% | 23.0% | 16.0% | 56,224 |
| 38 | Pinehurst, NC | Small | 58.6 | 2.6% | 4.6% | 20.9% | 20.5% | 11.8% | 23.3% | 16.3% | 71,231 |
| 39 | Colorado Springs, CO | Midsize | 58.2 | 2.1% | 4.5% | 19.7% | 23.8% | 11.3% | 23.0% | 15.6% | 483,326 |
| 40 | Olympia, WA | Midsize | 58.2 | 1.4% | 3.8% | 21.6% | 24.9% | 10.0% | 23.1% | 15.1% | 202,731 |
| 41 | Albany, NY | Large | 58.2 | 2.4% | 5.1% | 25.8% | 16.8% | 12.1% | 20.1% | 17.8% | 608,198 |
| 42 | Fargo, ND | Midsize | 58.1 | 2.7% | 3.1% | 20.7% | 20.3% | 15.0% | 28.1% | 10.2% | 154,615 |
| 43 | Baltimore, MD | Large | 58.1 | 3.0% | 5.8% | 24.7% | 18.5% | 6.7% | 22.7% | 18.6% | 1,943,831 |
| 44 | Hartford, CT | Large | 58.0 | 3.4% | 5.0% | 26.1% | 16.6% | 8.8% | 22.1% | 18.0% | 842,589 |
| 45 | Greenfield Town, MA | Small | 57.8 | 2.2% | 5.7% | 25.3% | 18.1% | 9.2% | 22.7% | 16.8% | 53,672 |
| 46 | Portland, OR | Large | 57.7 | 3.1% | 4.7% | 20.0% | 23.0% | 9.2% | 24.9% | 15.1% | 1,750,298 |
| 47 | Hilton Head Island, SC | Midsize | 57.6 | 2.3% | 5.9% | 25.1% | 19.0% | 7.8% | 23.3% | 16.6% | 153,838 |
| 48 | Des Moines, IA | Midsize | 57.5 | 3.3% | 3.5% | 24.6% | 19.0% | 10.9% | 27.0% | 11.9% | 434,042 |
| 49 | La Crosse, WI | Small | 57.5 | 1.9% | 2.4% | 27.6% | 21.3% | 11.6% | 21.8% | 13.5% | 89,492 |
| 50 | Morgantown, WV | Small | 57.4 | 1.6% | 5.4% | 32.9% | 16.0% | 6.0% | 18.7% | 19.3% | 91,251 |
Top 50 Least Educated Cities
Listed below are the top 50 least educated cities in the U.S.
| Rank | City | City Size | Total Score | Less than 9th grade | 9th to 12th grade, no diploma | High school graduate (includes equivalency) | Some college, no degree | Associate's degree | Bachelor's degree | Graduate or professional degree | Population 25 years old and over |
|---|---|---|---|---|---|---|---|---|---|---|---|
| 1 | Hobbs, NM | Small | 35.5 | 11.9% | 16.6% | 31.3% | 22.4% | 6.2% | 6.4% | 5.2% | 41,300 |
| 2 | El Centro, CA | Small | 35.8 | 14.4% | 15.6% | 25.5% | 24.1% | 6.2% | 9.5% | 4.6% | 111,825 |
| 3 | Merced, CA | Midsize | 36.1 | 17.0% | 13.2% | 27.2% | 21.9% | 6.1% | 9.3% | 5.4% | 163,014 |
| 4 | Madera, CA | Small | 36.1 | 20.3% | 11.1% | 23.2% | 22.2% | 7.9% | 10.8% | 4.6% | 99,401 |
| 5 | McAllen, TX | Midsize | 36.2 | 20.0% | 13.7% | 24.0% | 18.5% | 5.2% | 13.2% | 5.5% | 489,388 |
| 6 | Laredo, TX | Midsize | 36.8 | 18.7% | 15.4% | 21.4% | 17.3% | 7.3% | 14.7% | 5.2% | 153,546 |
| 7 | Brownsville, TX | Midsize | 37.1 | 17.3% | 13.2% | 27.6% | 17.8% | 7.2% | 11.8% | 5.2% | 250,704 |
| 8 | Dalton, GA | Small | 37.1 | 14.3% | 13.8% | 32.1% | 17.9% | 6.7% | 10.4% | 4.8% | 93,514 |
| 9 | Visalia, CA | Midsize | 37.6 | 18.5% | 10.4% | 25.5% | 21.4% | 8.3% | 10.1% | 5.8% | 275,220 |
| 10 | Opelousas, LA | Small | 38.2 | 9.0% | 14.2% | 41.6% | 16.9% | 4.6% | 8.7% | 5.1% | 53,097 |
| 11 | Gallup, NM | Small | 38.5 | 7.6% | 14.2% | 34.1% | 25.7% | 6.5% | 6.1% | 5.8% | 44,305 |
| 12 | Hanford, CA | Small | 38.5 | 12.6% | 13.3% | 25.0% | 24.4% | 10.0% | 10.1% | 4.7% | 94,303 |
| 13 | Bakersfield, CA | Large | 38.7 | 12.5% | 13.7% | 26.8% | 23.0% | 7.8% | 10.4% | 5.8% | 547,240 |
| 14 | Yakima, WA | Midsize | 39.1 | 13.9% | 12.7% | 27.7% | 20.7% | 8.3% | 10.2% | 6.6% | 152,659 |
| 15 | Odessa, TX | Small | 39.3 | 10.2% | 13.9% | 30.0% | 23.0% | 6.9% | 10.8% | 5.3% | 96,980 |
| 16 | Martinsville, VA | Small | 39.3 | 9.3% | 13.9% | 33.5% | 19.3% | 9.9% | 9.9% | 4.3% | 47,747 |
| 17 | Lumberton, NC | Small | 39.4 | 8.0% | 14.7% | 30.0% | 23.0% | 10.6% | 9.2% | 4.5% | 85,742 |
| 18 | Yuma, AZ | Small | 39.6 | 11.7% | 12.7% | 27.1% | 23.6% | 8.0% | 11.5% | 5.3% | 135,113 |
| 19 | Roswell, NM | Small | 39.8 | 12.8% | 10.4% | 25.2% | 28.1% | 7.4% | 10.2% | 5.9% | 42,081 |
| 20 | Moses Lake, WA | Small | 39.8 | 15.6% | 8.4% | 26.3% | 24.6% | 7.8% | 12.6% | 4.7% | 59,642 |
| 21 | Fort Payne, AL | Small | 39.9 | 13.9% | 10.3% | 29.8% | 19.8% | 11.4% | 8.2% | 6.7% | 48,169 |
| 22 | Houma, LA | Small | 40.4 | 9.2% | 12.1% | 39.5% | 17.4% | 5.3% | 10.6% | 6.0% | 139,779 |
| 23 | Talladega, AL | Small | 40.6 | 3.6% | 15.2% | 35.3% | 24.8% | 6.5% | 9.2% | 5.3% | 66,908 |
| 24 | Cullman, AL | Small | 41.1 | 4.7% | 12.9% | 31.1% | 26.8% | 12.5% | 8.4% | 3.7% | 58,319 |
| 25 | Roanoke Rapids, NC | Small | 41.3 | 6.4% | 11.7% | 40.2% | 18.6% | 9.0% | 8.9% | 5.3% | 50,219 |
| 26 | Modesto, CA | Midsize | 41.3 | 9.9% | 9.9% | 31.0% | 25.0% | 7.7% | 11.4% | 5.2% | 348,796 |
| 27 | Lufkin, TX | Small | 41.4 | 10.5% | 8.6% | 31.4% | 25.2% | 7.4% | 12.4% | 4.4% | 57,205 |
| 28 | Vineland, NJ | Small | 41.5 | 8.1% | 12.8% | 35.8% | 17.6% | 9.2% | 9.8% | 6.8% | 102,903 |
| 29 | North Wilkesboro, NC | Small | 41.6 | 6.8% | 13.7% | 28.7% | 23.2% | 11.0% | 11.7% | 4.9% | 49,741 |
| 30 | Danville, VA | Small | 41.6 | 6.1% | 11.8% | 36.2% | 22.2% | 8.4% | 10.4% | 4.9% | 72,884 |
| 31 | Athens, TX | Small | 41.7 | 4.8% | 12.4% | 33.4% | 28.0% | 5.2% | 11.8% | 4.6% | 57,739 |
| 32 | Show Low, AZ | Small | 41.8 | 5.8% | 10.5% | 31.3% | 30.5% | 7.6% | 8.2% | 6.0% | 72,071 |
| 33 | Palatka, FL | Small | 41.8 | 4.9% | 9.9% | 43.5% | 18.5% | 10.8% | 8.2% | 4.0% | 52,404 |
| 34 | Yuba City, CA | Small | 42.2 | 10.0% | 10.8% | 21.8% | 28.4% | 10.9% | 11.9% | 6.1% | 113,305 |
| 35 | Stockton, CA | Midsize | 42.3 | 11.0% | 8.9% | 30.8% | 21.5% | 9.9% | 12.4% | 5.5% | 475,624 |
| 36 | Sevierville, TN | Small | 42.3 | 5.8% | 9.4% | 36.5% | 26.0% | 7.4% | 9.6% | 5.2% | 70,273 |
| 37 | Morristown, TN | Small | 42.5 | 8.6% | 9.6% | 39.0% | 17.7% | 8.1% | 10.9% | 6.2% | 83,120 |
| 38 | Hermiston, OR | Small | 42.5 | 10.2% | 8.8% | 29.7% | 23.8% | 9.7% | 11.9% | 5.8% | 57,129 |
| 39 | London, KY | Small | 42.6 | 7.0% | 11.0% | 39.4% | 18.8% | 6.5% | 8.9% | 8.3% | 84,821 |
| 40 | Salinas, CA | Midsize | 42.6 | 18.1% | 9.5% | 21.0% | 18.1% | 8.5% | 14.7% | 10.1% | 277,909 |
| 41 | Lake City, FL | Small | 42.6 | 5.2% | 8.7% | 36.9% | 25.7% | 10.9% | 7.9% | 4.7% | 49,290 |
| 42 | Russellville, AR | Small | 42.6 | 6.1% | 10.8% | 38.1% | 20.9% | 6.5% | 12.4% | 5.2% | 56,350 |
| 43 | Rome, GA | Small | 42.6 | 6.7% | 11.9% | 36.8% | 18.5% | 9.2% | 10.0% | 7.0% | 65,529 |
| 44 | Fresno, CA | Large | 42.7 | 13.6% | 9.7% | 22.6% | 23.0% | 9.3% | 14.4% | 7.4% | 614,887 |
| 45 | LaGrange, GA | Small | 42.8 | 5.4% | 9.2% | 38.2% | 25.7% | 5.6% | 10.0% | 5.9% | 44,510 |
| 46 | Mount Airy, NC | Small | 43.1 | 8.2% | 10.5% | 30.7% | 20.7% | 12.5% | 12.0% | 5.4% | 50,905 |
| 47 | Marion, OH | Small | 43.1 | 2.9% | 6.8% | 47.7% | 23.7% | 7.7% | 6.9% | 4.4% | 45,697 |
| 48 | Lake Havasu City, AZ | Midsize | 43.1 | 3.6% | 9.4% | 34.5% | 30.0% | 8.3% | 9.7% | 4.6% | 160,767 |
| 49 | Coos Bay, OR | Small | 43.1 | 2.3% | 11.9% | 27.4% | 35.1% | 7.8% | 10.2% | 5.3% | 48,685 |
| 50 | Portsmouth, OH | Small | 43.2 | 3.2% | 10.8% | 44.9% | 18.4% | 7.6% | 9.1% | 6.0% | 52,325 |
Cities with the Most High School Graduates or Above
Cities with the highest proportion of high school graduates are listed in this following table. The top 10 cities were mostly small cities, many of which host universities.
| Rank | City | Percent high school graduate or higher |
|---|---|---|
| 1 | Ames, IA | 97.1% |
| 2 | Bozeman, MT | 96.7% |
| 3 | Lawrence, KS | 96.6% |
| 4 | Corvallis, OR | 96.1% |
| 5 | Marquette, MI | 96.1% |
| 6 | Truckee, CA | 96.0% |
| 7 | Billings, MT | 95.9% |
| 8 | Bloomington, IL | 95.8% |
| 9 | Boulder, CO | 95.8% |
| 10 | La Crosse, WI | 95.8% |
| 11 | Missoula, MT | 95.7% |
| 12 | Bremerton, WA | 95.4% |
| 13 | Oak Harbor, WA | 95.4% |
| 14 | Ann Arbor, MI | 95.3% |
| 15 | Iowa City, IA | 95.3% |
| 16 | Columbia, MO | 95.2% |
| 17 | Portland, ME | 95.2% |
| 18 | Fort Collins, CO | 95.1% |
| 19 | Madison, WI | 94.8% |
| 20 | Kalispell, MT | 94.7% |
| 21 | Olympia, WA | 94.7% |
| 22 | State College, PA | 94.7% |
| 23 | Manhattan, KS | 94.6% |
| 24 | Barnstable Town, MA | 94.5% |
| 25 | Bismarck, ND | 94.4% |
| 26 | Helena, MT | 94.4% |
| 27 | Pittsburgh, PA | 94.4% |
| 28 | Provo, UT | 94.4% |
| 29 | Rapid City, SD | 94.4% |
| 30 | Anchorage, AK | 94.2% |
| 31 | Duluth, MN | 94.2% |
| 32 | Fargo, ND | 94.2% |
| 33 | Brainerd, MN | 94.1% |
| 34 | Cheyenne, WY | 94.1% |
| 35 | Grand Forks, ND | 94.1% |
| 36 | Traverse City, MI | 94.0% |
| 37 | Burlington, VT | 93.9% |
| 38 | Lincoln, NE | 93.9% |
| 39 | Cedar Rapids, IA | 93.8% |
| 40 | Champaign, IL | 93.8% |
| 41 | Midland, MI | 93.8% |
| 42 | Minneapolis, MN | 93.8% |
| 43 | Port Angeles, WA | 93.8% |
| 44 | Stevens Point, WI | 93.8% |
| 45 | Augusta, ME | 93.7% |
| 46 | Concord, NH | 93.7% |
| 47 | Eau Claire, WI | 93.7% |
| 48 | Ithaca, NY | 93.7% |
| 49 | Lewiston, ID | 93.7% |
| 50 | Rochester, MN | 93.7% |
| 51 | Appleton, WI | 93.6% |
| 52 | Casper, WY | 93.6% |
| 53 | Lansing, MI | 93.6% |
| 54 | Fairbanks, AK | 93.5% |
| 55 | Torrington, CT | 93.5% |
| 56 | Colorado Springs, CO | 93.4% |
| 57 | Logan, UT | 93.4% |
| 58 | Sioux Falls, SD | 93.4% |
| 59 | Spokane, WA | 93.4% |
| 60 | Des Moines, IA | 93.3% |
| 61 | Muskegon, MI | 93.3% |
| 62 | St. George, UT | 93.3% |
| 63 | Sheboygan, WI | 93.2% |
| 64 | Ogden, UT | 93.1% |
| 65 | Bloomington, IN | 93.0% |
| 66 | Claremont, NH | 93.0% |
| 67 | Mankato, MN | 93.0% |
| 68 | Monroe, MI | 93.0% |
| 69 | Morgantown, WV | 93.0% |
| 70 | Pittsfield, MA | 93.0% |
| 71 | Seattle, WA | 92.9% |
| 72 | Pinehurst, NC | 92.8% |
| 73 | Quincy, IL | 92.8% |
| 74 | Clarksville, TN | 92.7% |
| 75 | Grants Pass, OR | 92.6% |
| 76 | Keene, NH | 92.6% |
| 77 | Pensacola, FL | 92.6% |
| 78 | Springfield, IL | 92.6% |
| 79 | Wisconsin Rapids, WI | 92.6% |
| 80 | Albany, NY | 92.5% |
| 81 | Altoona, PA | 92.5% |
| 82 | Bend, OR | 92.5% |
| 83 | Green Bay, WI | 92.5% |
| 84 | Pocatello, ID | 92.5% |
| 85 | Watertown, WI | 92.5% |
| 86 | Wheeling, WV | 92.5% |
| 87 | Bellingham, WA | 92.4% |
| 88 | Grand Rapids, MI | 92.4% |
| 89 | Hilo, HI | 92.4% |
| 90 | Kahului, HI | 92.4% |
| 91 | Manchester, NH | 92.4% |
| 92 | Ocean City, NJ | 92.4% |
| 93 | Raleigh, NC | 92.4% |
| 94 | Stillwater, OK | 92.4% |
| 95 | Boise City, ID | 92.3% |
| 96 | Idaho Falls, ID | 92.3% |
| 97 | Akron, OH | 92.2% |
| 98 | Coeur d'Alene, ID | 92.2% |
| 99 | Dubuque, IA | 92.2% |
| 100 | Great Falls, MT | 92.2% |
| 101 | Johnstown, PA | 92.2% |
| 102 | Kansas City, MO | 92.2% |
| 103 | St. Louis, MO | 92.2% |
| 104 | Wausau, WI | 92.2% |
| 105 | Wilmington, NC | 92.2% |
| 106 | Columbus, OH | 92.1% |
| 107 | Gainesville, FL | 92.1% |
| 108 | Greenfield Town, MA | 92.1% |
| 109 | Oshkosh, WI | 92.1% |
| 110 | Portland, OR | 92.1% |
| 111 | Auburn, AL | 92.0% |
| 112 | Bangor, ME | 92.0% |
| 113 | Fond du Lac, WI | 92.0% |
| 114 | Kalamazoo, MI | 92.0% |
| 115 | Kapaa, HI | 92.0% |
| 116 | Palm Bay, FL | 92.0% |
| 117 | Peoria, IL | 92.0% |
| 118 | St. Cloud, MN | 92.0% |
| 119 | Virginia Beach, VA | 92.0% |
| 120 | Waterloo, IA | 92.0% |
| 121 | Bloomsburg, PA | 91.9% |
| 122 | Canton, OH | 91.9% |
| 123 | Erie, PA | 91.9% |
| 124 | Eugene, OR | 91.9% |
| 125 | North Port, FL | 91.9% |
| 126 | Athens, OH | 91.8% |
| 127 | Charleston, SC | 91.8% |
| 128 | Findlay, OH | 91.8% |
| 129 | Hilton Head Island, SC | 91.8% |
| 130 | Lafayette, IN | 91.8% |
| 131 | Meadville, PA | 91.8% |
| 132 | Urban Honolulu, HI | 91.8% |
| 133 | Boston, MA | 91.7% |
| 134 | Columbus, IN | 91.7% |
| 135 | Topeka, KS | 91.7% |
| 136 | Cumberland, MD | 91.6% |
| 137 | Norwich, CT | 91.6% |
| 138 | Omaha, NE | 91.6% |
| 139 | Watertown, NY | 91.6% |
| 140 | Carbondale, IL | 91.5% |
| 141 | Hartford, CT | 91.5% |
| 142 | Milwaukee, WI | 91.5% |
| 143 | The Villages, FL | 91.5% |
| 144 | Buffalo, NY | 91.4% |
| 145 | Cincinnati, OH | 91.4% |
| 146 | Denver, CO | 91.4% |
| 147 | Beaver Dam, WI | 91.3% |
| 148 | Crestview, FL | 91.3% |
| 149 | Dayton, OH | 91.3% |
| 150 | Glenwood Springs, CO | 91.3% |
| 151 | Janesville, WI | 91.3% |
| 152 | Mount Pleasant, MI | 91.3% |
| 153 | Salt Lake City, UT | 91.3% |
| 154 | Washington, DC | 91.3% |
| 155 | Worcester, MA | 91.3% |
| 156 | Baltimore, MD | 91.2% |
| 157 | Battle Creek, MI | 91.2% |
| 158 | Deltona, FL | 91.2% |
| 159 | Marinette, WI | 91.2% |
| 160 | Owensboro, KY | 91.2% |
| 161 | Terre Haute, IN | 91.2% |
| 162 | Eureka, CA | 91.1% |
| 163 | Manitowoc, WI | 91.1% |
| 164 | Philadelphia, PA | 91.1% |
| 165 | San Luis Obispo, CA | 91.1% |
| 166 | Williamsport, PA | 91.1% |
| 167 | Davenport, IA | 91.0% |
| 168 | Harrisburg, PA | 91.0% |
| 169 | Saginaw, MI | 91.0% |
| 170 | Chico, CA | 90.9% |
| 171 | Cleveland, OH | 90.9% |
| 172 | Flint, MI | 90.9% |
| 173 | Lima, OH | 90.9% |
| 174 | Columbia, SC | 90.8% |
| 175 | Evansville, IN | 90.8% |
| 176 | Mount Vernon, WA | 90.8% |
| 177 | Myrtle Beach, SC | 90.8% |
| 178 | New Castle, PA | 90.8% |
| 179 | Racine, WI | 90.8% |
| 180 | Toledo, OH | 90.8% |
| 181 | Asheville, NC | 90.7% |
| 182 | California, MD | 90.7% |
| 183 | Jacksonville, FL | 90.7% |
| 184 | Morehead City, NC | 90.7% |
| 185 | Sandusky, OH | 90.7% |
| 186 | Savannah, GA | 90.7% |
| 187 | Durham, NC | 90.6% |
| 188 | Faribault, MN | 90.6% |
| 189 | Fayetteville, NC | 90.6% |
| 190 | Hot Springs, AR | 90.6% |
| 191 | Kingston, NY | 90.6% |
| 192 | Springfield, MO | 90.6% |
| 193 | Weirton, WV | 90.6% |
| 194 | Binghamton, NY | 90.5% |
| 195 | Corning, NY | 90.5% |
| 196 | Danville, IL | 90.5% |
| 197 | Grand Junction, CO | 90.5% |
| 198 | Jackson, MI | 90.5% |
| 199 | Plattsburgh, NY | 90.5% |
| 200 | Rochester, NY | 90.5% |
| 201 | Scranton, PA | 90.5% |
| 202 | Indiana, PA | 90.4% |
| 203 | Jacksonville, NC | 90.4% |
| 204 | Jefferson City, MO | 90.4% |
| 205 | Lexington, KY | 90.4% |
| 206 | New Haven, CT | 90.4% |
| 207 | Owosso, MI | 90.4% |
| 208 | Wichita, KS | 90.4% |
| 209 | Allentown, PA | 90.3% |
| 210 | Marion, OH | 90.3% |
| 211 | Minot, ND | 90.3% |
| 212 | Paducah, KY | 90.3% |
| 213 | Parkersburg, WV | 90.3% |
| 214 | Syracuse, NY | 90.3% |
| 215 | Daphne, AL | 90.2% |
| 216 | Detroit, MI | 90.2% |
| 217 | Hutchinson, KS | 90.2% |
| 218 | Key West, FL | 90.2% |
| 219 | Longview, WA | 90.2% |
| 220 | Ogdensburg, NY | 90.2% |
| 221 | Panama City, FL | 90.2% |
| 222 | Salem, OH | 90.2% |
| 223 | Whitewater, WI | 90.2% |
| 224 | Atlanta, GA | 90.1% |
| 225 | Austin, TX | 90.1% |
| 226 | Bridgeport, CT | 90.1% |
| 227 | Holland, MI | 90.1% |
| 228 | Huntsville, AL | 90.1% |
| 229 | Killeen, TX | 90.1% |
| 230 | Little Rock, AR | 90.1% |
| 231 | Lynchburg, VA | 90.1% |
| 232 | Pueblo, CO | 90.1% |
| 233 | San Francisco, CA | 90.1% |
| 234 | East Stroudsburg, PA | 90.0% |
| 235 | Gulfport, MS | 90.0% |
| 236 | Hinesville, GA | 90.0% |
| 237 | Nashville, TN | 90.0% |
| 238 | York, PA | 90.0% |
| 239 | Youngstown, OH | 90.0% |
| 240 | Sherman, TX | 89.9% |
| 241 | Blacksburg, VA | 89.8% |
| 242 | Homosassa Springs, FL | 89.8% |
| 243 | Lewiston, ME | 89.8% |
| 244 | Louisville, KY | 89.8% |
| 245 | Reno, NV | 89.8% |
| 246 | Tampa, FL | 89.8% |
| 247 | Tulsa, OK | 89.8% |
| 248 | Sacramento, CA | 89.7% |
| 249 | Somerset, PA | 89.7% |
| 250 | Sunbury, PA | 89.7% |
| 251 | Tuscaloosa, AL | 89.7% |
| 252 | Utica, NY | 89.7% |
| 253 | Adrian, MI | 89.6% |
| 254 | Cape Coral, FL | 89.6% |
| 255 | Decatur, IL | 89.6% |
| 256 | Indianapolis, IN | 89.6% |
| 257 | Medford, OR | 89.6% |
| 258 | Monroe, LA | 89.6% |
| 259 | Niles, MI | 89.6% |
| 260 | Oklahoma City, OK | 89.6% |
| 261 | Prescott, AZ | 89.6% |
| 262 | Roanoke, VA | 89.6% |
| 263 | Charlottesville, VA | 89.5% |
| 264 | Elizabethtown, KY | 89.5% |
| 265 | Jackson, MS | 89.5% |
| 266 | Orangeburg, SC | 89.5% |
| 267 | Orlando, FL | 89.5% |
| 268 | Richmond, VA | 89.5% |
| 269 | South Bend, IN | 89.5% |
| 270 | St. Joseph, MO | 89.5% |
| 271 | Centralia, WA | 89.4% |
| 272 | Charlotte, NC | 89.4% |
| 273 | Enid, OK | 89.4% |
| 274 | Flagstaff, AZ | 89.4% |
| 275 | Gettysburg, PA | 89.4% |
| 276 | Olean, NY | 89.4% |
| 277 | Punta Gorda, FL | 89.4% |
| 278 | Tallahassee, FL | 89.3% |
| 279 | Bay City, MI | 89.2% |
| 280 | Fort Wayne, IN | 89.2% |
| 281 | Roseburg, OR | 89.2% |
| 282 | San Jose, CA | 89.1% |
| 283 | Shawnee, OK | 89.1% |
| 284 | Texarkana, TX | 89.1% |
| 285 | Vallejo, CA | 89.1% |
| 286 | Zanesville, OH | 89.1% |
| 287 | Birmingham, AL | 89.0% |
| 288 | Chicago, IL | 89.0% |
| 289 | Greeley, CO | 89.0% |
| 290 | New Bern, NC | 89.0% |
| 291 | Ottawa, IL | 89.0% |
| 292 | Huntington, WV | 88.9% |
| 293 | Knoxville, TN | 88.9% |
| 294 | Pottsville, PA | 88.9% |
| 295 | Frankfort, KY | 88.8% |
| 296 | Jamestown, NY | 88.8% |
| 297 | Pine Bluff, AR | 88.8% |
| 298 | Salisbury, MD | 88.8% |
| 299 | Santa Rosa, CA | 88.8% |
| 300 | Carson City, NV | 88.7% |
| 301 | Sebastian, FL | 88.6% |
| 302 | Sioux City, IA | 88.6% |
| 303 | Athens, GA | 88.5% |
| 304 | Auburn, NY | 88.5% |
| 305 | Chambersburg, PA | 88.5% |
| 306 | Glens Falls, NY | 88.5% |
| 307 | Muncie, IN | 88.5% |
| 308 | San Angelo, TX | 88.5% |
| 309 | Albuquerque, NM | 88.4% |
| 310 | Redding, CA | 88.4% |
| 311 | Santa Fe, NM | 88.4% |
| 312 | Grand Island, NE | 88.3% |
| 313 | Tucson, AZ | 88.3% |
| 314 | Baton Rouge, LA | 88.2% |
| 315 | Chattanooga, TN | 88.2% |
| 316 | Hagerstown, MD | 88.2% |
| 317 | Lawton, OK | 88.2% |
| 318 | Michigan City, IN | 88.2% |
| 319 | Warner Robins, GA | 88.2% |
| 320 | Cape Girardeau, MO | 88.1% |
| 321 | Charleston, WV | 88.1% |
| 322 | Gadsden, AL | 88.1% |
| 323 | Port St. Lucie, FL | 88.1% |
| 324 | Rockford, IL | 88.1% |
| 325 | Branson, MO | 88.0% |
| 326 | Burlington, NC | 88.0% |
| 327 | Cookeville, TN | 88.0% |
| 328 | Phoenix, AZ | 88.0% |
| 329 | Springfield, OH | 88.0% |
| 330 | Memphis, TN | 87.9% |
| 331 | Providence, RI | 87.9% |
| 332 | Walla Walla, WA | 87.9% |
| 333 | Atlantic City, NJ | 87.8% |
| 334 | Clarksburg, WV | 87.8% |
| 335 | DuBois, PA | 87.8% |
| 336 | Elmira, NY | 87.8% |
| 337 | Florence, AL | 87.8% |
| 338 | Rocky Mount, NC | 87.8% |
| 339 | Ukiah, CA | 87.8% |
| 340 | Winchester, VA | 87.8% |
| 341 | Aberdeen, WA | 87.7% |
| 342 | Albany, OR | 87.7% |
| 343 | Augusta, GA | 87.7% |
| 344 | Jackson, TN | 87.7% |
| 345 | Kokomo, IN | 87.7% |
| 346 | Lebanon, PA | 87.7% |
| 347 | New Orleans, LA | 87.7% |
| 348 | Ocala, FL | 87.7% |
| 349 | Richmond, KY | 87.7% |
| 350 | Wichita Falls, TX | 87.7% |
| 351 | Greenville, NC | 87.6% |
| 352 | Richmond, IN | 87.6% |
| 353 | Columbus, GA | 87.5% |
| 354 | Joplin, MO | 87.5% |
| 355 | Kankakee, IL | 87.5% |
| 356 | Johnson City, TN | 87.4% |
| 357 | Sierra Vista, AZ | 87.4% |
| 358 | Wooster, OH | 87.4% |
| 359 | Abilene, TX | 87.3% |
| 360 | Jefferson, GA | 87.3% |
| 361 | San Diego, CA | 87.3% |
| 362 | Staunton, VA | 87.3% |
| 363 | College Station, TX | 87.2% |
| 364 | Greensboro, NC | 87.2% |
| 365 | Muskogee, OK | 87.2% |
| 366 | Springfield, MA | 87.2% |
| 367 | Dunn, NC | 87.1% |
| 368 | Klamath Falls, OR | 87.1% |
| 369 | Lake Charles, LA | 87.1% |
| 370 | Lake Havasu City, AZ | 87.1% |
| 371 | Naples, FL | 87.1% |
| 372 | New York, NY | 87.1% |
| 373 | Amarillo, TX | 87.0% |
| 374 | Warsaw, IN | 87.0% |
| 375 | Trenton, NJ | 86.9% |
| 376 | Fayetteville, AR | 86.8% |
| 377 | Hammond, LA | 86.8% |
| 378 | Jonesboro, AR | 86.8% |
| 379 | Kingsport, TN | 86.8% |
| 380 | Shreveport, LA | 86.8% |
| 381 | Spartanburg, SC | 86.8% |
| 382 | Farmington, MO | 86.7% |
| 383 | Alexandria, LA | 86.6% |
| 384 | Sebring, FL | 86.6% |
| 385 | Elizabeth City, NC | 86.5% |
| 386 | Montgomery, AL | 86.5% |
| 387 | Greenville, SC | 86.4% |
| 388 | New Philadelphia, OH | 86.4% |
| 389 | Reading, PA | 86.4% |
| 390 | Mansfield, OH | 86.3% |
| 391 | Santa Cruz, CA | 86.3% |
| 392 | Lubbock, TX | 86.2% |
| 393 | Winston-Salem, NC | 86.2% |
| 394 | Dallas, TX | 86.1% |
| 395 | Harrisonburg, VA | 86.1% |
| 396 | Lake City, FL | 86.1% |
| 397 | Miami, FL | 86.1% |
| 398 | Salem, OR | 86.1% |
| 399 | Statesboro, GA | 86.1% |
| 400 | Tyler, TX | 86.1% |
| 401 | Hattiesburg, MS | 86.0% |
| 402 | Huntsville, TX | 86.0% |
| 403 | Meridian, MS | 86.0% |
| 404 | Portsmouth, OH | 86.0% |
| 405 | Bowling Green, KY | 85.9% |
| 406 | Chillicothe, OH | 85.9% |
| 407 | Las Vegas, NV | 85.9% |
| 408 | Coos Bay, OR | 85.8% |
| 409 | Mobile, AL | 85.8% |
| 410 | Macon, GA | 85.7% |
| 411 | Napa, CA | 85.7% |
| 412 | Searcy, AR | 85.7% |
| 413 | Marshall, TX | 85.6% |
| 414 | LaGrange, GA | 85.4% |
| 415 | Victoria, TX | 85.4% |
| 416 | Farmington, NM | 85.3% |
| 417 | Marion, IN | 85.3% |
| 418 | Oxnard, CA | 85.3% |
| 419 | Sumter, SC | 85.3% |
| 420 | Tullahoma, TN | 85.3% |
| 421 | Ashtabula, OH | 85.2% |
| 422 | Palatka, FL | 85.2% |
| 423 | Valdosta, GA | 85.2% |
| 424 | Lakeland, FL | 85.1% |
| 425 | San Antonio, TX | 85.1% |
| 426 | Greeneville, TN | 85.0% |
| 427 | Waco, TX | 85.0% |
| 428 | Beaumont, TX | 84.9% |
| 429 | Lancaster, PA | 84.9% |
| 430 | Dothan, AL | 84.8% |
| 431 | Seneca, SC | 84.8% |
| 432 | Anniston, AL | 84.7% |
| 433 | Longview, TX | 84.7% |
| 434 | Sevierville, TN | 84.7% |
| 435 | Alamogordo, NM | 84.6% |
| 436 | Kennewick, WA | 84.6% |
| 437 | Bluefield, WV | 84.5% |
| 438 | Brunswick, GA | 84.4% |
| 439 | Cleveland, TN | 84.3% |
| 440 | Goldsboro, NC | 84.3% |
| 441 | Beckley, WV | 84.2% |
| 442 | Florence, SC | 84.2% |
| 443 | Twin Falls, ID | 84.1% |
| 444 | Clearlake, CA | 84.0% |
| 445 | Lafayette, LA | 84.0% |
| 446 | Shelby, NC | 84.0% |
| 447 | Dover, DE | 83.9% |
| 448 | Decatur, AL | 83.8% |
| 449 | Hickory, NC | 83.8% |
| 450 | Laurel, MS | 83.8% |
| 451 | Forest City, NC | 83.7% |
| 452 | Houston, TX | 83.7% |
| 453 | Show Low, AZ | 83.7% |
| 454 | Midland, TX | 83.6% |
| 455 | Fort Smith, AR | 83.3% |
| 456 | Greenwood, SC | 83.3% |
| 457 | Russellville, AR | 83.1% |
| 458 | Tupelo, MS | 83.0% |
| 459 | Athens, TX | 82.9% |
| 460 | Albany, GA | 82.8% |
| 461 | Albertville, AL | 82.7% |
| 462 | Wenatchee, WA | 82.7% |
| 463 | Corpus Christi, TX | 82.6% |
| 464 | Cullman, AL | 82.5% |
| 465 | Nacogdoches, TX | 82.3% |
| 466 | Danville, VA | 82.1% |
| 467 | London, KY | 82.0% |
| 468 | Morristown, TN | 81.9% |
| 469 | Roanoke Rapids, NC | 81.9% |
| 470 | Riverside, CA | 81.8% |
| 471 | Elkhart, IN | 81.7% |
| 472 | Santa Maria, CA | 81.5% |
| 473 | Rome, GA | 81.4% |
| 474 | Mount Airy, NC | 81.3% |
| 475 | Talladega, AL | 81.1% |
| 476 | Hermiston, OR | 81.0% |
| 477 | Los Angeles, CA | 81.0% |
| 478 | Lufkin, TX | 80.9% |
| 479 | Modesto, CA | 80.2% |
| 480 | Stockton, CA | 80.2% |
| 481 | Wilson, NC | 80.0% |
| 482 | Las Cruces, NM | 79.6% |
| 483 | North Wilkesboro, NC | 79.5% |
| 484 | Vineland, NJ | 79.2% |
| 485 | Yuba City, CA | 79.2% |
| 486 | Houma, LA | 78.8% |
| 487 | Gainesville, GA | 78.7% |
| 488 | Gallup, NM | 78.2% |
| 489 | El Paso, TX | 77.9% |
| 490 | Lumberton, NC | 77.3% |
| 491 | Martinsville, VA | 76.8% |
| 492 | Opelousas, LA | 76.8% |
| 493 | Roswell, NM | 76.8% |
| 494 | Fresno, CA | 76.7% |
| 495 | Moses Lake, WA | 76.0% |
| 496 | Odessa, TX | 75.9% |
| 497 | Fort Payne, AL | 75.7% |
| 498 | Yuma, AZ | 75.6% |
| 499 | Hanford, CA | 74.1% |
| 500 | Bakersfield, CA | 73.8% |
| 501 | Yakima, WA | 73.5% |
| 502 | Salinas, CA | 72.4% |
| 503 | Dalton, GA | 71.9% |
| 504 | Hobbs, NM | 71.5% |
| 505 | Visalia, CA | 71.1% |
| 506 | El Centro, CA | 69.9% |
| 507 | Merced, CA | 69.8% |
| 508 | Brownsville, TX | 69.5% |
| 509 | Madera, CA | 68.6% |
| 510 | McAllen, TX | 66.3% |
| 511 | Laredo, TX | 65.9% |
Cities with the Most College Graduates or Above
Below, the cities with the highest proportion of residents who hold a bachelor’s or above are ranked. This metric includes those who have completed a graduate or professional degree. Boulder, CO, home of the University of Colorado, takes the top spot. The small and midsize college towns in the top 10 are joined by the big cities of Washington, D.C.; San Jose; and San Francisco.
| Rank | City | Percent bachelor's degree or higher |
|---|---|---|
| 1 | Boulder, CO | 62.5% |
| 2 | Ann Arbor, MI | 56.4% |
| 3 | Lawrence, KS | 56.2% |
| 4 | Corvallis, OR | 53.4% |
| 5 | San Jose, CA | 52.9% |
| 6 | Ithaca, NY | 51.9% |
| 7 | Washington, DC | 51.6% |
| 8 | San Francisco, CA | 51.0% |
| 9 | Ames, IA | 50.7% |
| 10 | Iowa City, IA | 49.3% |
| 11 | Boston, MA | 49.1% |
| 12 | Bozeman, MT | 48.5% |
| 13 | Bridgeport, CT | 48.4% |
| 14 | Columbia, MO | 48.4% |
| 15 | Durham, NC | 48.1% |
| 16 | Raleigh, NC | 48.0% |
| 17 | Charlottesville, VA | 47.8% |
| 18 | Fort Collins, CO | 47.6% |
| 19 | State College, PA | 46.7% |
| 20 | Austin, TX | 46.6% |
| 21 | Burlington, VT | 45.7% |
| 22 | Madison, WI | 45.7% |
| 23 | Manhattan, KS | 44.9% |
| 24 | Denver, CO | 44.8% |
| 25 | Seattle, WA | 43.6% |
| 26 | Bloomington, IL | 43.0% |
| 27 | Bloomington, IN | 42.6% |
| 28 | Minneapolis, MN | 42.6% |
| 29 | Trenton, NJ | 42.2% |
| 30 | Barnstable Town, MA | 41.8% |
| 31 | Champaign, IL | 41.8% |
| 32 | Gainesville, FL | 41.6% |
| 33 | Portland, ME | 41.5% |
| 34 | Provo, UT | 41.4% |
| 35 | Baltimore, MD | 41.2% |
| 36 | New York, NY | 41.1% |
| 37 | College Station, TX | 40.6% |
| 38 | Lincoln, NE | 40.6% |
| 39 | Athens, GA | 40.4% |
| 40 | Huntsville, AL | 40.3% |
| 41 | Hartford, CT | 40.1% |
| 42 | Santa Cruz, CA | 40.1% |
| 43 | Portland, OR | 40.0% |
| 44 | Hilton Head Island, SC | 39.9% |
| 45 | Missoula, MT | 39.7% |
| 46 | Glenwood Springs, CO | 39.6% |
| 47 | Pinehurst, NC | 39.6% |
| 48 | Greenfield Town, MA | 39.5% |
| 49 | Atlanta, GA | 39.4% |
| 50 | Santa Fe, NM | 39.4% |
| 51 | Rochester, MN | 39.1% |
| 52 | Des Moines, IA | 38.9% |
| 53 | Helena, MT | 38.9% |
| 54 | Colorado Springs, CO | 38.6% |
| 55 | Manchester, NH | 38.6% |
| 56 | Chicago, IL | 38.5% |
| 57 | San Diego, CA | 38.4% |
| 58 | Fargo, ND | 38.3% |
| 59 | Naples, FL | 38.3% |
| 60 | Lexington, KY | 38.2% |
| 61 | Olympia, WA | 38.2% |
| 62 | Morgantown, WV | 38.1% |
| 63 | Philadelphia, PA | 38.1% |
| 64 | Richmond, VA | 38.1% |
| 65 | Wilmington, NC | 38.1% |
| 66 | Logan, UT | 38.0% |
| 67 | Albany, NY | 37.9% |
| 68 | Columbus, OH | 37.7% |
| 69 | Stillwater, OK | 37.7% |
| 70 | Truckee, CA | 37.4% |
| 71 | Claremont, NH | 37.1% |
| 72 | Kansas City, MO | 37.0% |
| 73 | Charleston, SC | 36.5% |
| 74 | Omaha, NE | 36.5% |
| 75 | Tallahassee, FL | 36.4% |
| 76 | Rochester, NY | 36.3% |
| 77 | Asheville, NC | 36.2% |
| 78 | Charlotte, NC | 36.1% |
| 79 | Lafayette, IN | 36.1% |
| 80 | Santa Rosa, CA | 36.1% |
| 81 | Flagstaff, AZ | 36.0% |
| 82 | Milwaukee, WI | 36.0% |
| 83 | Bend, OR | 35.9% |
| 84 | Nashville, TN | 35.9% |
| 85 | Worcester, MA | 35.9% |
| 86 | Dallas, TX | 35.5% |
| 87 | Pittsburgh, PA | 35.5% |
| 88 | La Crosse, WI | 35.3% |
| 89 | Salt Lake City, UT | 35.2% |
| 90 | Urban Honolulu, HI | 35.2% |
| 91 | New Haven, CT | 35.1% |
| 92 | Indianapolis, IN | 35.0% |
| 93 | Concord, NH | 34.9% |
| 94 | Napa, CA | 34.9% |
| 95 | Ocean City, NJ | 34.8% |
| 96 | Santa Maria, CA | 34.8% |
| 97 | St. Louis, MO | 34.8% |
| 98 | California, MD | 34.7% |
| 99 | Pittsfield, MA | 34.7% |
| 100 | San Luis Obispo, CA | 34.7% |
| 101 | Los Angeles, CA | 34.6% |
| 102 | Kalamazoo, MI | 34.5% |
| 103 | Auburn, AL | 34.3% |
| 104 | Lansing, MI | 34.3% |
| 105 | Sacramento, CA | 34.3% |
| 106 | Oak Harbor, WA | 34.2% |
| 107 | Cincinnati, OH | 34.0% |
| 108 | Bellingham, WA | 33.9% |
| 109 | Key West, FL | 33.9% |
| 110 | Sioux Falls, SD | 33.9% |
| 111 | Anchorage, AK | 33.7% |
| 112 | Bremerton, WA | 33.7% |
| 113 | Buffalo, NY | 33.7% |
| 114 | Grand Rapids, MI | 33.7% |
| 115 | Blacksburg, VA | 33.3% |
| 116 | Columbus, IN | 33.3% |
| 117 | Traverse City, MI | 33.3% |
| 118 | Akron, OH | 33.2% |
| 119 | Torrington, CT | 33.2% |
| 120 | Houston, TX | 33.1% |
| 121 | Miami, FL | 33.1% |
| 122 | Norwich, CT | 33.1% |
| 123 | Orlando, FL | 33.1% |
| 124 | Mankato, MN | 33.0% |
| 125 | Springfield, IL | 33.0% |
| 126 | Virginia Beach, VA | 33.0% |
| 127 | Billings, MT | 32.9% |
| 128 | Springfield, MA | 32.9% |
| 129 | Albuquerque, NM | 32.8% |
| 130 | Cleveland, OH | 32.7% |
| 131 | Harrisburg, PA | 32.7% |
| 132 | Jackson, MS | 32.6% |
| 133 | Oxnard, CA | 32.5% |
| 134 | North Port, FL | 32.4% |
| 135 | Hattiesburg, MS | 32.2% |
| 136 | Boise City, ID | 32.1% |
| 137 | Keene, NH | 32.1% |
| 138 | Marquette, MI | 32.0% |
| 139 | Midland, MI | 32.0% |
| 140 | Ogden, UT | 32.0% |
| 141 | Stevens Point, WI | 32.0% |
| 142 | Greenville, NC | 31.9% |
| 143 | Phoenix, AZ | 31.9% |
| 144 | Providence, RI | 31.9% |
| 145 | Syracuse, NY | 31.9% |
| 146 | Bismarck, ND | 31.8% |
| 147 | Detroit, MI | 31.8% |
| 148 | Jacksonville, FL | 31.7% |
| 149 | Kingston, NY | 31.7% |
| 150 | Rapid City, SD | 31.7% |
| 151 | Fayetteville, AR | 31.6% |
| 152 | Cedar Rapids, IA | 31.5% |
| 153 | Tucson, AZ | 31.5% |
| 154 | Daphne, AL | 31.4% |
| 155 | Kapaa, HI | 31.4% |
| 156 | Reno, NV | 31.3% |
| 157 | Wichita, KS | 31.2% |
| 158 | Kalispell, MT | 31.1% |
| 159 | Palm Bay, FL | 31.1% |
| 160 | St. George, UT | 31.1% |
| 161 | Columbia, SC | 31.0% |
| 162 | Savannah, GA | 30.9% |
| 163 | The Villages, FL | 30.9% |
| 164 | Dubuque, IA | 30.8% |
| 165 | Greenville, SC | 30.8% |
| 166 | Tampa, FL | 30.8% |
| 167 | Crestview, FL | 30.7% |
| 168 | Oklahoma City, OK | 30.7% |
| 169 | Dayton, OH | 30.6% |
| 170 | New Orleans, LA | 30.6% |
| 171 | Harrisonburg, VA | 30.4% |
| 172 | Appleton, WI | 30.2% |
| 173 | Birmingham, AL | 30.2% |
| 174 | Louisville, KY | 30.2% |
| 175 | Eugene, OR | 30.1% |
| 176 | Spokane, WA | 30.1% |
| 177 | Eureka, CA | 30.0% |
| 178 | Grand Junction, CO | 30.0% |
| 179 | Greensboro, NC | 30.0% |
| 180 | Idaho Falls, ID | 29.9% |
| 181 | South Bend, IN | 29.9% |
| 182 | Sebastian, FL | 29.8% |
| 183 | Bloomsburg, PA | 29.7% |
| 184 | Port Angeles, WA | 29.7% |
| 185 | Roanoke, VA | 29.7% |
| 186 | Hilo, HI | 29.6% |
| 187 | Little Rock, AR | 29.6% |
| 188 | Allentown, PA | 29.5% |
| 189 | Kahului, HI | 29.5% |
| 190 | Niles, MI | 29.5% |
| 191 | Waterloo, IA | 29.5% |
| 192 | Cape Coral, FL | 29.3% |
| 193 | Lubbock, TX | 29.2% |
| 194 | Fairbanks, AK | 29.0% |
| 195 | Athens, OH | 28.9% |
| 196 | Montgomery, AL | 28.9% |
| 197 | Jefferson City, MO | 28.8% |
| 198 | Atlantic City, NJ | 28.7% |
| 199 | Knoxville, TN | 28.7% |
| 200 | Las Cruces, NM | 28.7% |
| 201 | Baton Rouge, LA | 28.6% |
| 202 | Peoria, IL | 28.6% |
| 203 | Lancaster, PA | 28.5% |
| 204 | Memphis, TN | 28.5% |
| 205 | Morehead City, NC | 28.5% |
| 206 | Mount Pleasant, MI | 28.5% |
| 207 | Faribault, MN | 28.4% |
| 208 | Richmond, KY | 28.3% |
| 209 | Topeka, KS | 28.3% |
| 210 | Tyler, TX | 28.3% |
| 211 | Watertown, WI | 28.3% |
| 212 | Statesboro, GA | 28.2% |
| 213 | Binghamton, NY | 28.1% |
| 214 | Duluth, MN | 28.1% |
| 215 | Grand Forks, ND | 28.1% |
| 216 | Medford, OR | 28.1% |
| 217 | Bangor, ME | 28.0% |
| 218 | Carbondale, IL | 28.0% |
| 219 | Erie, PA | 27.8% |
| 220 | Pocatello, ID | 27.8% |
| 221 | Warner Robins, GA | 27.8% |
| 222 | Clarksville, TN | 27.7% |
| 223 | Davenport, IA | 27.7% |
| 224 | Fort Wayne, IN | 27.7% |
| 225 | Lynchburg, VA | 27.7% |
| 226 | Pensacola, FL | 27.7% |
| 227 | Vallejo, CA | 27.7% |
| 228 | Walla Walla, WA | 27.7% |
| 229 | Wausau, WI | 27.7% |
| 230 | Tulsa, OK | 27.6% |
| 231 | Johnson City, TN | 27.5% |
| 232 | Midland, TX | 27.5% |
| 233 | San Antonio, TX | 27.5% |
| 234 | Greeley, CO | 27.4% |
| 235 | Kennewick, WA | 27.4% |
| 236 | Cape Girardeau, MO | 27.3% |
| 237 | Eau Claire, WI | 27.3% |
| 238 | Glens Falls, NY | 27.3% |
| 239 | Tuscaloosa, AL | 27.3% |
| 240 | St. Cloud, MN | 27.2% |
| 241 | Augusta, ME | 27.1% |
| 242 | Green Bay, WI | 27.0% |
| 243 | Plattsburgh, NY | 26.9% |
| 244 | Port St. Lucie, FL | 26.9% |
| 245 | Quincy, IL | 26.9% |
| 246 | Salisbury, MD | 26.9% |
| 247 | Mount Vernon, WA | 26.8% |
| 248 | Toledo, OH | 26.8% |
| 249 | Springfield, MO | 26.7% |
| 250 | Brunswick, GA | 26.6% |
| 251 | Chattanooga, TN | 26.6% |
| 252 | Whitewater, WI | 26.6% |
| 253 | Cheyenne, WY | 26.5% |
| 254 | Minot, ND | 26.4% |
| 255 | Myrtle Beach, SC | 26.4% |
| 256 | Prescott, AZ | 26.4% |
| 257 | Amarillo, TX | 26.3% |
| 258 | Winchester, VA | 26.3% |
| 259 | Augusta, GA | 26.2% |
| 260 | Chico, CA | 26.2% |
| 261 | Seneca, SC | 26.0% |
| 262 | Evansville, IN | 25.9% |
| 263 | Coeur d'Alene, ID | 25.8% |
| 264 | Fayetteville, NC | 25.8% |
| 265 | Winston-Salem, NC | 25.8% |
| 266 | Burlington, NC | 25.7% |
| 267 | Racine, WI | 25.7% |
| 268 | Wenatchee, WA | 25.7% |
| 269 | York, PA | 25.6% |
| 270 | Utica, NY | 25.5% |
| 271 | Findlay, OH | 25.4% |
| 272 | Scranton, PA | 25.4% |
| 273 | Bowling Green, KY | 25.3% |
| 274 | Frankfort, KY | 25.3% |
| 275 | Oshkosh, WI | 25.2% |
| 276 | Hutchinson, KS | 25.1% |
| 277 | Reading, PA | 25.1% |
| 278 | Staunton, VA | 25.1% |
| 279 | Casper, WY | 25.0% |
| 280 | Muncie, IN | 25.0% |
| 281 | Williamsport, PA | 25.0% |
| 282 | Salinas, CA | 24.8% |
| 283 | Abilene, TX | 24.7% |
| 284 | Deltona, FL | 24.7% |
| 285 | Jonesboro, AR | 24.7% |
| 286 | Las Vegas, NV | 24.6% |
| 287 | Salem, OR | 24.5% |
| 288 | Brainerd, MN | 24.4% |
| 289 | Corning, NY | 24.4% |
| 290 | Indiana, PA | 24.4% |
| 291 | Great Falls, MT | 24.3% |
| 292 | Lafayette, LA | 24.3% |
| 293 | New Bern, NC | 24.3% |
| 294 | Enid, OK | 24.2% |
| 295 | Gainesville, GA | 24.2% |
| 296 | San Angelo, TX | 24.1% |
| 297 | Sheboygan, WI | 24.0% |
| 298 | Waco, TX | 24.0% |
| 299 | Jacksonville, NC | 23.8% |
| 300 | Ukiah, CA | 23.7% |
| 301 | Jefferson, GA | 23.6% |
| 302 | El Paso, TX | 23.5% |
| 303 | Gettysburg, PA | 23.5% |
| 304 | Punta Gorda, FL | 23.5% |
| 305 | Grand Island, NE | 23.4% |
| 306 | Gulfport, MS | 23.4% |
| 307 | Shreveport, LA | 23.4% |
| 308 | Dover, DE | 23.3% |
| 309 | Holland, MI | 23.3% |
| 310 | Charleston, WV | 23.2% |
| 311 | Columbus, GA | 23.2% |
| 312 | Decatur, AL | 23.2% |
| 313 | Lawton, OK | 23.2% |
| 314 | Spartanburg, SC | 23.2% |
| 315 | Killeen, TX | 23.1% |
| 316 | Ogdensburg, NY | 23.0% |
| 317 | Searcy, AR | 23.0% |
| 318 | Macon, GA | 22.9% |
| 319 | Wichita Falls, TX | 22.9% |
| 320 | Wooster, OH | 22.9% |
| 321 | Jackson, TN | 22.8% |
| 322 | Rockford, IL | 22.8% |
| 323 | Sioux City, IA | 22.8% |
| 324 | Watertown, NY | 22.7% |
| 325 | Wheeling, WV | 22.7% |
| 326 | Albertville, AL | 22.6% |
| 327 | Monroe, MI | 22.6% |
| 328 | Panama City, FL | 22.6% |
| 329 | Wisconsin Rapids, WI | 22.6% |
| 330 | Kokomo, IN | 22.5% |
| 331 | Sandusky, OH | 22.5% |
| 332 | Carson City, NV | 22.4% |
| 333 | Huntington, WV | 22.4% |
| 334 | Paducah, KY | 22.4% |
| 335 | Wilson, NC | 22.4% |
| 336 | Mobile, AL | 22.3% |
| 337 | Flint, MI | 22.2% |
| 338 | Laurel, MS | 22.2% |
| 339 | Redding, CA | 22.2% |
| 340 | Youngstown, OH | 22.2% |
| 341 | Janesville, WI | 22.1% |
| 342 | Joplin, MO | 22.1% |
| 343 | Monroe, LA | 22.1% |
| 344 | Adrian, MI | 22.0% |
| 345 | East Stroudsburg, PA | 22.0% |
| 346 | Battle Creek, MI | 21.9% |
| 347 | Cookeville, TN | 21.9% |
| 348 | Elizabeth City, NC | 21.9% |
| 349 | Hot Springs, AR | 21.9% |
| 350 | Riverside, CA | 21.9% |
| 351 | St. Joseph, MO | 21.9% |
| 352 | Tupelo, MS | 21.9% |
| 353 | Florence, SC | 21.8% |
| 354 | Fresno, CA | 21.8% |
| 355 | Greenwood, SC | 21.8% |
| 356 | Manitowoc, WI | 21.8% |
| 357 | Muskogee, OK | 21.8% |
| 358 | Pueblo, CO | 21.8% |
| 359 | Sierra Vista, AZ | 21.8% |
| 360 | Terre Haute, IN | 21.8% |
| 361 | Warsaw, IN | 21.8% |
| 362 | Albany, OR | 21.7% |
| 363 | Jamestown, NY | 21.7% |
| 364 | Lake Charles, LA | 21.7% |
| 365 | Nacogdoches, TX | 21.7% |
| 366 | Owensboro, KY | 21.7% |
| 367 | Auburn, NY | 21.4% |
| 368 | Dunn, NC | 21.4% |
| 369 | Hagerstown, MD | 21.4% |
| 370 | Johnstown, PA | 21.4% |
| 371 | Canton, OH | 21.3% |
| 372 | Decatur, IL | 21.3% |
| 373 | Florence, AL | 21.3% |
| 374 | Klamath Falls, OR | 21.3% |
| 375 | Fond du Lac, WI | 21.2% |
| 376 | Kingsport, TN | 21.2% |
| 377 | Corpus Christi, TX | 21.1% |
| 378 | Shawnee, OK | 21.1% |
| 379 | Sherman, TX | 21.1% |
| 380 | Jackson, MI | 21.0% |
| 381 | Chambersburg, PA | 20.9% |
| 382 | Lewiston, ID | 20.8% |
| 383 | Meadville, PA | 20.8% |
| 384 | New Castle, PA | 20.7% |
| 385 | Alamogordo, NM | 20.6% |
| 386 | Lebanon, PA | 20.6% |
| 387 | Saginaw, MI | 20.6% |
| 388 | Altoona, PA | 20.5% |
| 389 | Elmira, NY | 20.5% |
| 390 | Valdosta, GA | 20.5% |
| 391 | Victoria, TX | 20.3% |
| 392 | Parkersburg, WV | 20.1% |
| 393 | Rocky Mount, NC | 20.1% |
| 394 | Sumter, SC | 20.1% |
| 395 | Elkhart, IN | 20.0% |
| 396 | Huntsville, TX | 20.0% |
| 397 | Marshall, TX | 20.0% |
| 398 | Roseburg, OR | 20.0% |
| 399 | Gadsden, AL | 19.9% |
| 400 | Laredo, TX | 19.9% |
| 401 | Ocala, FL | 19.9% |
| 402 | Dothan, AL | 19.7% |
| 403 | Hickory, NC | 19.7% |
| 404 | Kankakee, IL | 19.7% |
| 405 | Lakeland, FL | 19.7% |
| 406 | Muskegon, MI | 19.7% |
| 407 | Lewiston, ME | 19.5% |
| 408 | Twin Falls, ID | 19.5% |
| 409 | Bay City, MI | 19.4% |
| 410 | Clarksburg, WV | 19.4% |
| 411 | Cumberland, MD | 19.4% |
| 412 | Michigan City, IN | 19.3% |
| 413 | Branson, MO | 19.2% |
| 414 | Springfield, OH | 19.2% |
| 415 | Texarkana, TX | 19.2% |
| 416 | Elizabethtown, KY | 19.1% |
| 417 | Fort Smith, AR | 19.1% |
| 418 | Hammond, LA | 19.1% |
| 419 | Tullahoma, TN | 19.1% |
| 420 | Cleveland, TN | 18.9% |
| 421 | New Philadelphia, OH | 18.8% |
| 422 | Olean, NY | 18.8% |
| 423 | McAllen, TX | 18.7% |
| 424 | Salem, OH | 18.7% |
| 425 | Alexandria, LA | 18.6% |
| 426 | Bluefield, WV | 18.6% |
| 427 | Centralia, WA | 18.6% |
| 428 | Richmond, IN | 18.5% |
| 429 | Clearlake, CA | 18.4% |
| 430 | Owosso, MI | 18.4% |
| 431 | Shelby, NC | 18.4% |
| 432 | Albany, GA | 18.3% |
| 433 | Homosassa Springs, FL | 18.3% |
| 434 | Mansfield, OH | 18.3% |
| 435 | Beaumont, TX | 18.2% |
| 436 | Anniston, AL | 18.0% |
| 437 | Yuba City, CA | 18.0% |
| 438 | Greeneville, TN | 17.9% |
| 439 | Stockton, CA | 17.9% |
| 440 | Orangeburg, SC | 17.8% |
| 441 | Ottawa, IL | 17.8% |
| 442 | Hermiston, OR | 17.7% |
| 443 | Russellville, AR | 17.7% |
| 444 | Lima, OH | 17.4% |
| 445 | Longview, TX | 17.4% |
| 446 | Mount Airy, NC | 17.4% |
| 447 | London, KY | 17.3% |
| 448 | Moses Lake, WA | 17.3% |
| 449 | Sebring, FL | 17.2% |
| 450 | Morristown, TN | 17.1% |
| 451 | Beckley, WV | 17.0% |
| 452 | Brownsville, TX | 17.0% |
| 453 | Goldsboro, NC | 17.0% |
| 454 | Longview, WA | 17.0% |
| 455 | Ashtabula, OH | 16.9% |
| 456 | Lufkin, TX | 16.9% |
| 457 | Rome, GA | 16.9% |
| 458 | Yakima, WA | 16.8% |
| 459 | Yuma, AZ | 16.8% |
| 460 | Hinesville, GA | 16.7% |
| 461 | Marinette, WI | 16.7% |
| 462 | Pottsville, PA | 16.7% |
| 463 | Weirton, WV | 16.7% |
| 464 | Houma, LA | 16.6% |
| 465 | Modesto, CA | 16.6% |
| 466 | North Wilkesboro, NC | 16.6% |
| 467 | Vineland, NJ | 16.6% |
| 468 | Beaver Dam, WI | 16.5% |
| 469 | Athens, TX | 16.4% |
| 470 | Forest City, NC | 16.4% |
| 471 | Pine Bluff, AR | 16.4% |
| 472 | Grants Pass, OR | 16.3% |
| 473 | Bakersfield, CA | 16.2% |
| 474 | Farmington, NM | 16.2% |
| 475 | Sunbury, PA | 16.2% |
| 476 | Zanesville, OH | 16.2% |
| 477 | Danville, IL | 16.1% |
| 478 | Odessa, TX | 16.1% |
| 479 | Roswell, NM | 16.1% |
| 480 | Chillicothe, OH | 16.0% |
| 481 | LaGrange, GA | 16.0% |
| 482 | Meridian, MS | 15.9% |
| 483 | Visalia, CA | 15.9% |
| 484 | Farmington, MO | 15.8% |
| 485 | Somerset, PA | 15.7% |
| 486 | Coos Bay, OR | 15.5% |
| 487 | Danville, VA | 15.4% |
| 488 | DuBois, PA | 15.4% |
| 489 | Madera, CA | 15.4% |
| 490 | Dalton, GA | 15.2% |
| 491 | Portsmouth, OH | 15.2% |
| 492 | Fort Payne, AL | 14.9% |
| 493 | Marion, IN | 14.9% |
| 494 | Sevierville, TN | 14.8% |
| 495 | Hanford, CA | 14.7% |
| 496 | Merced, CA | 14.6% |
| 497 | Talladega, AL | 14.5% |
| 498 | Lake Havasu City, AZ | 14.3% |
| 499 | Show Low, AZ | 14.3% |
| 500 | Martinsville, VA | 14.2% |
| 501 | Aberdeen, WA | 14.1% |
| 502 | El Centro, CA | 14.1% |
| 503 | Roanoke Rapids, NC | 14.1% |
| 504 | Opelousas, LA | 13.8% |
| 505 | Lumberton, NC | 13.7% |
| 506 | Lake City, FL | 12.7% |
| 507 | Palatka, FL | 12.3% |
| 508 | Cullman, AL | 12.1% |
| 509 | Gallup, NM | 11.9% |
| 510 | Hobbs, NM | 11.6% |
| 511 | Marion, OH | 11.3% |
Cities with the Most People with Graduate Degrees
In the table below, we list the cities with the highest percentage of residents who hold a graduate or professional degree. The top 10 cities are mostly college towns, led by Ithaca, NY, which is home to Cornell University, but the large cities of Washington, D.C. and San Jose, CA take the 5th and 8th spots on this list.
| Rank | City | Graduate or professional degree |
|---|---|---|
| 1 | Ithaca, NY | 30.9% |
| 2 | Lawrence, KS | 29.3% |
| 3 | Ann Arbor, MI | 29.2% |
| 4 | Boulder, CO | 27.8% |
| 5 | Washington, DC | 25.4% |
| 6 | Corvallis, OR | 25.2% |
| 7 | Iowa City, IA | 25.1% |
| 8 | San Jose, CA | 24.8% |
| 9 | Charlottesville, VA | 24.0% |
| 10 | Durham, NC | 23.7% |
| 11 | State College, PA | 23.2% |
| 12 | Boston, MA | 22.7% |
| 13 | Columbia, MO | 22.4% |
| 14 | Ames, IA | 21.8% |
| 15 | Bridgeport, CT | 21.6% |
| 16 | San Francisco, CA | 21.1% |
| 17 | Champaign, IL | 21.0% |
| 18 | Bloomington, IN | 20.8% |
| 19 | Santa Fe, NM | 20.4% |
| 20 | Trenton, NJ | 20.2% |
| 21 | Athens, GA | 19.9% |
| 22 | Fort Collins, CO | 19.3% |
| 23 | Morgantown, WV | 19.3% |
| 24 | Barnstable Town, MA | 19.2% |
| 25 | Manhattan, KS | 19.1% |
| 26 | College Station, TX | 18.8% |
| 27 | Baltimore, MD | 18.6% |
| 28 | Madison, WI | 18.6% |
| 29 | Gainesville, FL | 18.4% |
| 30 | Bozeman, MT | 18.3% |
| 31 | Hartford, CT | 18.0% |
| 32 | Albany, NY | 17.8% |
| 33 | Raleigh, NC | 17.7% |
| 34 | New York, NY | 17.3% |
| 35 | Blacksburg, VA | 17.2% |
| 36 | Burlington, VT | 17.1% |
| 37 | Claremont, NH | 17.0% |
| 38 | Austin, TX | 16.9% |
| 39 | Santa Cruz, CA | 16.9% |
| 40 | Greenfield Town, MA | 16.8% |
| 41 | Seattle, WA | 16.8% |
| 42 | Concord, NH | 16.6% |
| 43 | Hilton Head Island, SC | 16.6% |
| 44 | New Haven, CT | 16.6% |
| 45 | Denver, CO | 16.5% |
| 46 | Rochester, NY | 16.4% |
| 47 | Pinehurst, NC | 16.3% |
| 48 | Bloomington, IL | 16.2% |
| 49 | Lexington, KY | 16.2% |
| 50 | Rochester, MN | 16.1% |
| 51 | Helena, MT | 16.0% |
| 52 | Missoula, MT | 15.9% |
| 53 | Tallahassee, FL | 15.8% |
| 54 | Portland, ME | 15.7% |
| 55 | Colorado Springs, CO | 15.6% |
| 56 | Naples, FL | 15.6% |
| 57 | Philadelphia, PA | 15.6% |
| 58 | Chicago, IL | 15.5% |
| 59 | Athens, OH | 15.3% |
| 60 | San Diego, CA | 15.3% |
| 61 | Huntsville, AL | 15.1% |
| 62 | Olympia, WA | 15.1% |
| 63 | Portland, OR | 15.1% |
| 64 | Atlanta, GA | 15.0% |
| 65 | Buffalo, NY | 14.9% |
| 66 | Minneapolis, MN | 14.8% |
| 67 | Syracuse, NY | 14.8% |
| 68 | Flagstaff, AZ | 14.7% |
| 69 | Richmond, VA | 14.7% |
| 70 | Santa Maria, CA | 14.7% |
| 71 | Stillwater, OK | 14.7% |
| 72 | Albuquerque, NM | 14.5% |
| 73 | Lafayette, IN | 14.5% |
| 74 | Manchester, NH | 14.5% |
| 75 | Oak Harbor, WA | 14.5% |
| 76 | Lincoln, NE | 14.4% |
| 77 | Pittsfield, MA | 14.4% |
| 78 | Springfield, MA | 14.4% |
| 79 | Midland, MI | 14.3% |
| 80 | Plattsburgh, NY | 14.2% |
| 81 | Santa Rosa, CA | 14.2% |
| 82 | St. Louis, MO | 14.2% |
| 83 | Auburn, AL | 14.1% |
| 84 | California, MD | 14.1% |
| 85 | Key West, FL | 14.1% |
| 86 | Torrington, CT | 14.1% |
| 87 | Worcester, MA | 14.1% |
| 88 | Carbondale, IL | 14.0% |
| 89 | Pittsburgh, PA | 14.0% |
| 90 | The Villages, FL | 14.0% |
| 91 | Columbus, OH | 13.9% |
| 92 | Norwich, CT | 13.9% |
| 93 | Asheville, NC | 13.8% |
| 94 | Kingston, NY | 13.8% |
| 95 | Lansing, MI | 13.7% |
| 96 | Kansas City, MO | 13.6% |
| 97 | La Crosse, WI | 13.5% |
| 98 | Columbus, IN | 13.4% |
| 99 | Kalamazoo, MI | 13.4% |
| 100 | Milwaukee, WI | 13.4% |
| 101 | North Port, FL | 13.4% |
| 102 | Logan, UT | 13.3% |
| 103 | Cincinnati, OH | 13.2% |
| 104 | Anchorage, AK | 13.1% |
| 105 | Bend, OR | 13.1% |
| 106 | Dayton, OH | 13.1% |
| 107 | Harrisonburg, VA | 13.1% |
| 108 | Mount Pleasant, MI | 13.1% |
| 109 | Provo, UT | 13.1% |
| 110 | Salt Lake City, UT | 13.1% |
| 111 | Tucson, AZ | 13.1% |
| 112 | Jackson, MS | 13.0% |
| 113 | Akron, OH | 12.9% |
| 114 | Charleston, SC | 12.9% |
| 115 | Omaha, NE | 12.9% |
| 116 | San Luis Obispo, CA | 12.9% |
| 117 | Savannah, GA | 12.9% |
| 118 | Bellingham, WA | 12.8% |
| 119 | Cleveland, OH | 12.8% |
| 120 | Nashville, TN | 12.8% |
| 121 | Providence, RI | 12.8% |
| 122 | Statesboro, GA | 12.8% |
| 123 | Virginia Beach, VA | 12.8% |
| 124 | Corning, NY | 12.7% |
| 125 | Detroit, MI | 12.7% |
| 126 | Glens Falls, NY | 12.6% |
| 127 | Springfield, IL | 12.6% |
| 128 | Bloomsburg, PA | 12.5% |
| 129 | Fayetteville, AR | 12.5% |
| 130 | Miami, FL | 12.5% |
| 131 | Binghamton, NY | 12.4% |
| 132 | Dallas, TX | 12.4% |
| 133 | Indianapolis, IN | 12.4% |
| 134 | Port Angeles, WA | 12.4% |
| 135 | Fairbanks, AK | 12.3% |
| 136 | Richmond, KY | 12.3% |
| 137 | Traverse City, MI | 12.2% |
| 138 | Columbia, SC | 12.1% |
| 139 | Oxnard, CA | 12.1% |
| 140 | Sacramento, CA | 12.1% |
| 141 | Urban Honolulu, HI | 12.1% |
| 142 | Wilmington, NC | 12.1% |
| 143 | Harrisburg, PA | 12.0% |
| 144 | Houston, TX | 12.0% |
| 145 | Los Angeles, CA | 12.0% |
| 146 | Montgomery, AL | 12.0% |
| 147 | Ocean City, NJ | 12.0% |
| 148 | Charlotte, NC | 11.9% |
| 149 | Des Moines, IA | 11.9% |
| 150 | Hattiesburg, MS | 11.9% |
| 151 | Louisville, KY | 11.9% |
| 152 | Ogdensburg, NY | 11.9% |
| 153 | Reno, NV | 11.9% |
| 154 | South Bend, IN | 11.9% |
| 155 | St. George, UT | 11.9% |
| 156 | Crestview, FL | 11.8% |
| 157 | Little Rock, AR | 11.8% |
| 158 | Truckee, CA | 11.8% |
| 159 | Bremerton, WA | 11.7% |
| 160 | Indiana, PA | 11.7% |
| 161 | Muncie, IN | 11.7% |
| 162 | Phoenix, AZ | 11.7% |
| 163 | Knoxville, TN | 11.6% |
| 164 | Orlando, FL | 11.6% |
| 165 | Wichita, KS | 11.6% |
| 166 | Winchester, VA | 11.6% |
| 167 | Eugene, OR | 11.5% |
| 168 | Greenville, SC | 11.5% |
| 169 | Johnson City, TN | 11.5% |
| 170 | Palm Bay, FL | 11.5% |
| 171 | Jacksonville, FL | 11.4% |
| 172 | Dubuque, IA | 11.3% |
| 173 | Grand Rapids, MI | 11.3% |
| 174 | Keene, NH | 11.3% |
| 175 | Oklahoma City, OK | 11.3% |
| 176 | Utica, NY | 11.3% |
| 177 | Allentown, PA | 11.2% |
| 178 | Brunswick, GA | 11.2% |
| 179 | Napa, CA | 11.2% |
| 180 | Tuscaloosa, AL | 11.2% |
| 181 | New Orleans, LA | 11.1% |
| 182 | Warner Robins, GA | 11.1% |
| 183 | Birmingham, AL | 11.0% |
| 184 | Kennewick, WA | 11.0% |
| 185 | Cape Coral, FL | 10.9% |
| 186 | Roanoke, VA | 10.9% |
| 187 | Salisbury, MD | 10.9% |
| 188 | Sebastian, FL | 10.9% |
| 189 | Tampa, FL | 10.9% |
| 190 | Erie, PA | 10.8% |
| 191 | Daphne, AL | 10.7% |
| 192 | Grand Junction, CO | 10.7% |
| 193 | Greenville, NC | 10.7% |
| 194 | Spokane, WA | 10.7% |
| 195 | Walla Walla, WA | 10.7% |
| 196 | Glenwood Springs, CO | 10.6% |
| 197 | Lancaster, PA | 10.6% |
| 198 | Las Cruces, NM | 10.6% |
| 199 | Lynchburg, VA | 10.6% |
| 200 | Medford, OR | 10.6% |
| 201 | Memphis, TN | 10.6% |
| 202 | Rapid City, SD | 10.6% |
| 203 | Springfield, MO | 10.6% |
| 204 | Atlantic City, NJ | 10.5% |
| 205 | Hilo, HI | 10.5% |
| 206 | Morehead City, NC | 10.5% |
| 207 | Sioux Falls, SD | 10.5% |
| 208 | Toledo, OH | 10.5% |
| 209 | Boise City, ID | 10.4% |
| 210 | Kahului, HI | 10.4% |
| 211 | Mankato, MN | 10.4% |
| 212 | Niles, MI | 10.4% |
| 213 | Peoria, IL | 10.4% |
| 214 | Cape Girardeau, MO | 10.3% |
| 215 | Gettysburg, PA | 10.3% |
| 216 | Lawton, OK | 10.3% |
| 217 | Port St. Lucie, FL | 10.3% |
| 218 | Bowling Green, KY | 10.2% |
| 219 | Fargo, ND | 10.2% |
| 220 | Greensboro, NC | 10.2% |
| 221 | Tyler, TX | 10.2% |
| 222 | Augusta, GA | 10.1% |
| 223 | Augusta, ME | 10.1% |
| 224 | Bangor, ME | 10.1% |
| 225 | Baton Rouge, LA | 10.1% |
| 226 | Columbus, GA | 10.1% |
| 227 | Cookeville, TN | 10.1% |
| 228 | Kalispell, MT | 10.1% |
| 229 | Lubbock, TX | 10.1% |
| 230 | Prescott, AZ | 10.1% |
| 231 | Salinas, CA | 10.1% |
| 232 | San Antonio, TX | 10.0% |
| 233 | Charleston, WV | 9.9% |
| 234 | Pensacola, FL | 9.9% |
| 235 | Seneca, SC | 9.9% |
| 236 | Dover, DE | 9.8% |
| 237 | Frankfort, KY | 9.8% |
| 238 | Jefferson City, MO | 9.8% |
| 239 | Ogden, UT | 9.8% |
| 240 | Duluth, MN | 9.7% |
| 241 | Findlay, OH | 9.7% |
| 242 | Jamestown, NY | 9.7% |
| 243 | Wenatchee, WA | 9.7% |
| 244 | Chattanooga, TN | 9.6% |
| 245 | Eureka, CA | 9.6% |
| 246 | Fort Wayne, IN | 9.6% |
| 247 | Marquette, MI | 9.6% |
| 248 | Pocatello, ID | 9.6% |
| 249 | Topeka, KS | 9.6% |
| 250 | Billings, MT | 9.5% |
| 251 | St. Cloud, MN | 9.5% |
| 252 | Huntington, WV | 9.4% |
| 253 | Stevens Point, WI | 9.4% |
| 254 | Waterloo, IA | 9.4% |
| 255 | Appleton, WI | 9.3% |
| 256 | Idaho Falls, ID | 9.3% |
| 257 | Punta Gorda, FL | 9.3% |
| 258 | Scranton, PA | 9.3% |
| 259 | Whitewater, WI | 9.3% |
| 260 | Clarksville, TN | 9.2% |
| 261 | Holland, MI | 9.2% |
| 262 | Kapaa, HI | 9.2% |
| 263 | Macon, GA | 9.2% |
| 264 | Staunton, VA | 9.2% |
| 265 | Watertown, NY | 9.2% |
| 266 | Casper, WY | 9.1% |
| 267 | Davenport, IA | 9.1% |
| 268 | Jefferson, GA | 9.1% |
| 269 | Myrtle Beach, SC | 9.1% |
| 270 | Olean, NY | 9.1% |
| 271 | Quincy, IL | 9.1% |
| 272 | Racine, WI | 9.1% |
| 273 | Winston-Salem, NC | 9.1% |
| 274 | Wooster, OH | 9.1% |
| 275 | Coeur d'Alene, ID | 9.0% |
| 276 | East Stroudsburg, PA | 9.0% |
| 277 | Mount Vernon, WA | 9.0% |
| 278 | Reading, PA | 9.0% |
| 279 | Wausau, WI | 9.0% |
| 280 | Cedar Rapids, IA | 8.9% |
| 281 | Chico, CA | 8.9% |
| 282 | Eau Claire, WI | 8.9% |
| 283 | Fayetteville, NC | 8.9% |
| 284 | Hutchinson, KS | 8.9% |
| 285 | New Bern, NC | 8.9% |
| 286 | Paducah, KY | 8.9% |
| 287 | Rockford, IL | 8.9% |
| 288 | Vallejo, CA | 8.9% |
| 289 | Elizabethtown, KY | 8.8% |
| 290 | Elmira, NY | 8.8% |
| 291 | Gulfport, MS | 8.8% |
| 292 | Sierra Vista, AZ | 8.8% |
| 293 | Tulsa, OK | 8.8% |
| 294 | Ukiah, CA | 8.8% |
| 295 | York, PA | 8.8% |
| 296 | Cheyenne, WY | 8.7% |
| 297 | Gainesville, GA | 8.7% |
| 298 | Jonesboro, AR | 8.7% |
| 299 | Laurel, MS | 8.7% |
| 300 | Sandusky, OH | 8.7% |
| 301 | Warsaw, IN | 8.7% |
| 302 | Auburn, NY | 8.6% |
| 303 | Evansville, IN | 8.6% |
| 304 | Florence, SC | 8.6% |
| 305 | Great Falls, MT | 8.6% |
| 306 | Elizabeth City, NC | 8.5% |
| 307 | Faribault, MN | 8.5% |
| 308 | Grand Forks, ND | 8.5% |
| 309 | Las Vegas, NV | 8.5% |
| 310 | Waco, TX | 8.5% |
| 311 | Watertown, WI | 8.5% |
| 312 | Wichita Falls, TX | 8.5% |
| 313 | Deltona, FL | 8.4% |
| 314 | Greeley, CO | 8.4% |
| 315 | Owensboro, KY | 8.4% |
| 316 | Redding, CA | 8.4% |
| 317 | Searcy, AR | 8.4% |
| 318 | Shawnee, OK | 8.4% |
| 319 | Altoona, PA | 8.3% |
| 320 | Chambersburg, PA | 8.3% |
| 321 | Farmington, MO | 8.3% |
| 322 | London, KY | 8.3% |
| 323 | Salem, OR | 8.3% |
| 324 | Spartanburg, SC | 8.3% |
| 325 | Jackson, TN | 8.2% |
| 326 | Terre Haute, IN | 8.2% |
| 327 | Tullahoma, TN | 8.2% |
| 328 | Twin Falls, ID | 8.2% |
| 329 | Albertville, AL | 8.1% |
| 330 | Sheboygan, WI | 8.1% |
| 331 | Tupelo, MS | 8.1% |
| 332 | Anniston, AL | 8.0% |
| 333 | El Paso, TX | 8.0% |
| 334 | Flint, MI | 8.0% |
| 335 | New Philadelphia, OH | 8.0% |
| 336 | Sherman, TX | 8.0% |
| 337 | Wisconsin Rapids, WI | 8.0% |
| 338 | Youngstown, OH | 8.0% |
| 339 | Abilene, TX | 7.9% |
| 340 | Green Bay, WI | 7.9% |
| 341 | Kingsport, TN | 7.9% |
| 342 | Midland, TX | 7.9% |
| 343 | Shreveport, LA | 7.9% |
| 344 | Valdosta, GA | 7.9% |
| 345 | Williamsport, PA | 7.9% |
| 346 | Albany, GA | 7.8% |
| 347 | Bismarck, ND | 7.8% |
| 348 | Hot Springs, AR | 7.8% |
| 349 | Kankakee, IL | 7.8% |
| 350 | Killeen, TX | 7.8% |
| 351 | Orangeburg, SC | 7.8% |
| 352 | Panama City, FL | 7.8% |
| 353 | Riverside, CA | 7.8% |
| 354 | Cleveland, TN | 7.7% |
| 355 | Enid, OK | 7.7% |
| 356 | Florence, AL | 7.7% |
| 357 | Gadsden, AL | 7.7% |
| 358 | Janesville, WI | 7.7% |
| 359 | Kokomo, IN | 7.7% |
| 360 | Monroe, MI | 7.7% |
| 361 | Saginaw, MI | 7.7% |
| 362 | Wilson, NC | 7.7% |
| 363 | Clarksburg, WV | 7.6% |
| 364 | Lima, OH | 7.6% |
| 365 | Meadville, PA | 7.6% |
| 366 | Mobile, AL | 7.6% |
| 367 | Wheeling, WV | 7.6% |
| 368 | Alamogordo, NM | 7.5% |
| 369 | Amarillo, TX | 7.5% |
| 370 | Cumberland, MD | 7.5% |
| 371 | Decatur, AL | 7.5% |
| 372 | Klamath Falls, OR | 7.5% |
| 373 | Brainerd, MN | 7.4% |
| 374 | Canton, OH | 7.4% |
| 375 | Fresno, CA | 7.4% |
| 376 | Jacksonville, NC | 7.4% |
| 377 | Lafayette, LA | 7.4% |
| 378 | Pueblo, CO | 7.4% |
| 379 | Albany, OR | 7.3% |
| 380 | Battle Creek, MI | 7.3% |
| 381 | Corpus Christi, TX | 7.3% |
| 382 | Decatur, IL | 7.3% |
| 383 | Nacogdoches, TX | 7.3% |
| 384 | Parkersburg, WV | 7.3% |
| 385 | Richmond, IN | 7.3% |
| 386 | Beckley, WV | 7.2% |
| 387 | Hagerstown, MD | 7.2% |
| 388 | Jackson, MI | 7.2% |
| 389 | Sioux City, IA | 7.2% |
| 390 | Sumter, SC | 7.2% |
| 391 | Bay City, MI | 7.1% |
| 392 | Clearlake, CA | 7.1% |
| 393 | Dunn, NC | 7.1% |
| 394 | Greenwood, SC | 7.1% |
| 395 | Johnstown, PA | 7.1% |
| 396 | Dothan, AL | 7.0% |
| 397 | Monroe, LA | 7.0% |
| 398 | Rome, GA | 7.0% |
| 399 | Burlington, NC | 6.9% |
| 400 | Farmington, NM | 6.9% |
| 401 | Lake Charles, LA | 6.9% |
| 402 | Marion, IN | 6.9% |
| 403 | Oshkosh, WI | 6.9% |
| 404 | Owosso, MI | 6.9% |
| 405 | San Angelo, TX | 6.9% |
| 406 | Adrian, MI | 6.8% |
| 407 | Elkhart, IN | 6.8% |
| 408 | Lakeland, FL | 6.8% |
| 409 | Lebanon, PA | 6.8% |
| 410 | Mansfield, OH | 6.8% |
| 411 | Vineland, NJ | 6.8% |
| 412 | Weirton, WV | 6.8% |
| 413 | Ashtabula, OH | 6.7% |
| 414 | Centralia, WA | 6.7% |
| 415 | Chillicothe, OH | 6.7% |
| 416 | Fort Payne, AL | 6.7% |
| 417 | Muskogee, OK | 6.7% |
| 418 | Salem, OH | 6.7% |
| 419 | Shelby, NC | 6.7% |
| 420 | Fort Smith, AR | 6.6% |
| 421 | Huntsville, TX | 6.6% |
| 422 | Ocala, FL | 6.6% |
| 423 | Yakima, WA | 6.6% |
| 424 | Minot, ND | 6.5% |
| 425 | Muskegon, MI | 6.5% |
| 426 | Alexandria, LA | 6.4% |
| 427 | Bluefield, WV | 6.4% |
| 428 | Branson, MO | 6.4% |
| 429 | Hinesville, GA | 6.4% |
| 430 | Michigan City, IN | 6.4% |
| 431 | Carson City, NV | 6.3% |
| 432 | Grand Island, NE | 6.3% |
| 433 | Greeneville, TN | 6.3% |
| 434 | Homosassa Springs, FL | 6.3% |
| 435 | Joplin, MO | 6.3% |
| 436 | DuBois, PA | 6.2% |
| 437 | Morristown, TN | 6.2% |
| 438 | Sebring, FL | 6.2% |
| 439 | Springfield, OH | 6.2% |
| 440 | St. Joseph, MO | 6.2% |
| 441 | Fond du Lac, WI | 6.1% |
| 442 | Yuba City, CA | 6.1% |
| 443 | Danville, IL | 6.0% |
| 444 | Houma, LA | 6.0% |
| 445 | Portsmouth, OH | 6.0% |
| 446 | Show Low, AZ | 6.0% |
| 447 | Victoria, TX | 6.0% |
| 448 | Zanesville, OH | 6.0% |
| 449 | Forest City, NC | 5.9% |
| 450 | LaGrange, GA | 5.9% |
| 451 | Manitowoc, WI | 5.9% |
| 452 | Meridian, MS | 5.9% |
| 453 | Roswell, NM | 5.9% |
| 454 | Texarkana, TX | 5.9% |
| 455 | Bakersfield, CA | 5.8% |
| 456 | Gallup, NM | 5.8% |
| 457 | Hermiston, OR | 5.8% |
| 458 | Hickory, NC | 5.8% |
| 459 | Lewiston, ID | 5.8% |
| 460 | Longview, TX | 5.8% |
| 461 | Marshall, TX | 5.8% |
| 462 | Visalia, CA | 5.8% |
| 463 | Grants Pass, OR | 5.7% |
| 464 | Hammond, LA | 5.7% |
| 465 | Lewiston, ME | 5.7% |
| 466 | Roseburg, OR | 5.7% |
| 467 | McAllen, TX | 5.5% |
| 468 | Pine Bluff, AR | 5.5% |
| 469 | Stockton, CA | 5.5% |
| 470 | Sunbury, PA | 5.5% |
| 471 | Longview, WA | 5.4% |
| 472 | Merced, CA | 5.4% |
| 473 | Mount Airy, NC | 5.4% |
| 474 | Ottawa, IL | 5.4% |
| 475 | Rocky Mount, NC | 5.4% |
| 476 | Somerset, PA | 5.4% |
| 477 | Coos Bay, OR | 5.3% |
| 478 | Odessa, TX | 5.3% |
| 479 | Roanoke Rapids, NC | 5.3% |
| 480 | Talladega, AL | 5.3% |
| 481 | Yuma, AZ | 5.3% |
| 482 | Brownsville, TX | 5.2% |
| 483 | Hobbs, NM | 5.2% |
| 484 | Laredo, TX | 5.2% |
| 485 | Marinette, WI | 5.2% |
| 486 | Modesto, CA | 5.2% |
| 487 | Russellville, AR | 5.2% |
| 488 | Sevierville, TN | 5.2% |
| 489 | Opelousas, LA | 5.1% |
| 490 | Beaumont, TX | 5.0% |
| 491 | Pottsville, PA | 5.0% |
| 492 | Danville, VA | 4.9% |
| 493 | Goldsboro, NC | 4.9% |
| 494 | New Castle, PA | 4.9% |
| 495 | North Wilkesboro, NC | 4.9% |
| 496 | Dalton, GA | 4.8% |
| 497 | Hanford, CA | 4.7% |
| 498 | Lake City, FL | 4.7% |
| 499 | Moses Lake, WA | 4.7% |
| 500 | Aberdeen, WA | 4.6% |
| 501 | Athens, TX | 4.6% |
| 502 | El Centro, CA | 4.6% |
| 503 | Lake Havasu City, AZ | 4.6% |
| 504 | Madera, CA | 4.6% |
| 505 | Lumberton, NC | 4.5% |
| 506 | Beaver Dam, WI | 4.4% |
| 507 | Lufkin, TX | 4.4% |
| 508 | Marion, OH | 4.4% |
| 509 | Martinsville, VA | 4.3% |
| 510 | Palatka, FL | 4.0% |
| 511 | Cullman, AL | 3.7% |
Methodology
AdvisorSmith’s study on the Most and Least Educated Cities in America was based upon data from the U.S. Census Bureau’s American Community Survey. This data set provided data on educational attainment levels for 511 U.S. metropolitan and micropolitan areas, which we refer to as cities.
In particular, the data provides an estimate for 2018 of each city’s population aged 25 or older. It also provides an estimate of the percentage of the population in each city with the following levels of educational attainment: less than 9th grade; 9th to 12th grade, no diploma; high school graduates, including high school equivalency diplomas; some college, no degree; associate’s degree holders; bachelor’s degree holders; and graduate or professional degree holders.
Our study applied a scoring model to each city, assigning points for high school graduates, associate’s degree holders, bachelor’s degree holders, and graduate or professional degree holders. Higher point scores were allocated to each successively higher level of educational attainment. We multiplied the scores for each level of educational attainment by the proportion of the population who had attained that level of education to produce a composite score for each city.
We ranked all 511 cities by our educational attainment score to produce this study. Additionally, we also provided a ranking of cities by population. Cities were sorted into three classifications: small cities with populations of 150,000 or less, midsize cities with populations between 150,000-500,000, and large cities with populations above 500,000. The populations used were the metropolitan statistical area population of adults aged 25 or older, so city size did not consider the population of residents under 25 years of age.
As supplemental data, we also provided the rank of cities by the proportion of high school graduates and above, college graduates and above, and graduate/professional school graduates and above.
Sources
[1] U.S. Census Bureau American Community Survey