


Many Americans believe that higher education is the key to a positive economic future. However, the United States has some of the most expensive costs for college and universities in the world. To bridge this gap, many Americans take advantage of student loans that are offered or guaranteed by the federal government. While these loans are an important way for students to finance their education, they can be an ongoing burden for graduates after they have completed their studies.
In this study, AdvisorSmith examines the states with the highest levels of student loan debt. In particular, we took a deeper look into which states had the highest average student loan balances. Additionally, we also examined the states where the highest percentage of the population currently carries a federal student loan.

At the end of June 2021, the average student loan debt held in the federal student loan portfolio was $37,105. There were a total of 42.9 million borrowers, which is approximately 13% of the total U.S. population.
States With the Highest Student Loan Balances
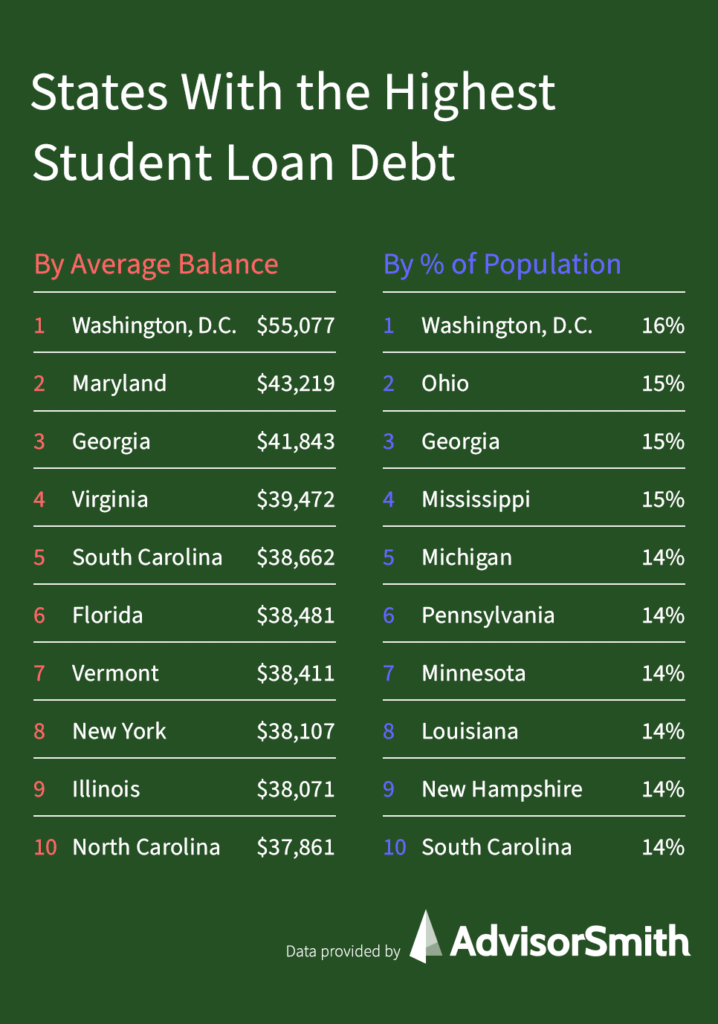
Below, we rank the states with the highest average student loan balances. The nation’s capital, Washington, D.C., had the highest average balance of $55,077, while North Dakota had the lowest average balance at $29,446.
| Rank | State | Average Loan Balance |
|---|---|---|
| 1 | District of Columbia | $55,077 |
| 2 | Maryland | $43,219 |
| 3 | Georgia | $41,843 |
| 4 | Virginia | $39,472 |
| 5 | South Carolina | $38,662 |
| 6 | Florida | $38,481 |
| 7 | Vermont | $38,411 |
| 8 | New York | $38,107 |
| 9 | Illinois | $38,071 |
| 10 | North Carolina | $37,861 |
| 11 | Alabama | $37,348 |
| 12 | Delaware | $37,338 |
| 13 | Oregon | $37,251 |
| 14 | Colorado | $37,120 |
| 15 | Mississippi | $37,080 |
| 16 | California | $36,937 |
| 17 | Hawaii | $36,575 |
| 18 | Tennessee | $36,549 |
| 19 | Michigan | $36,295 |
| 20 | Pennsylvania | $35,804 |
| 21 | New Jersey | $35,730 |
| 22 | Missouri | $35,706 |
| 23 | Washington | $35,521 |
| 24 | Arizona | $35,454 |
| 25 | Connecticut | $35,448 |
| 26 | Ohio | $34,923 |
| 27 | Louisiana | $34,683 |
| 28 | Massachusetts | $34,549 |
| 29 | Alaska | $34,431 |
| 30 | New Hampshire | $34,353 |
| 31 | New Mexico | $34,237 |
| 32 | Montana | $33,953 |
| 33 | Nevada | $33,863 |
| 34 | Minnesota | $33,822 |
| 35 | Arkansas | $33,525 |
| 36 | Maine | $33,352 |
| 37 | Kansas | $33,130 |
| 38 | Texas | $33,123 |
| 39 | Indiana | $33,106 |
| 40 | Idaho | $33,100 |
| 41 | Kentucky | $33,023 |
| 42 | Utah | $32,781 |
| 43 | Wisconsin | $32,272 |
| 44 | West Virginia | $32,258 |
| 45 | Rhode Island | $32,212 |
| 46 | Nebraska | $32,138 |
| 47 | South Dakota | $31,858 |
| 48 | Oklahoma | $31,832 |
| 49 | Iowa | $30,848 |
| 50 | Wyoming | $30,246 |
| 51 | North Dakota | $29,446 |
States With the Most Student Loans Outstanding
In this analysis, we found the states where the largest percentage of the population has an outstanding federal student loan. Again, Washington, D.C. led the way, with 16% of the population there having an outstanding federal student loan. Hawaii had the fewest number of residents with federal student loans outstanding, with only 9% of the population having a student loan.
| Rank | State | Percent of Population with Student Loans |
|---|---|---|
| 1 | District of Columbia | 16% |
| 2 | Ohio | 15% |
| 3 | Georgia | 15% |
| 4 | Mississippi | 15% |
| 5 | Michigan | 14% |
| 6 | Pennsylvania | 14% |
| 7 | Minnesota | 14% |
| 8 | Louisiana | 14% |
| 9 | New Hampshire | 14% |
| 10 | South Carolina | 14% |
| 11 | Maryland | 14% |
| 12 | Connecticut | 14% |
| 13 | Maine | 14% |
| 14 | Iowa | 14% |
| 15 | Missouri | 13% |
| 16 | Indiana | 13% |
| 17 | Rhode Island | 13% |
| 18 | Kentucky | 13% |
| 19 | New Jersey | 13% |
| 20 | Colorado | 13% |
| 21 | Kansas | 13% |
| 22 | Massachusetts | 13% |
| 23 | Illinois | 13% |
| 24 | Oregon | 13% |
| 25 | South Dakota | 13% |
| 26 | Arkansas | 13% |
| 27 | Alabama | 13% |
| 28 | Nebraska | 13% |
| 29 | West Virginia | 13% |
| 30 | Delaware | 12% |
| 31 | New York | 12% |
| 32 | Virginia | 12% |
| 33 | Wisconsin | 12% |
| 34 | Tennessee | 12% |
| 35 | Vermont | 12% |
| 36 | Texas | 12% |
| 37 | Oklahoma | 12% |
| 38 | North Carolina | 12% |
| 39 | Florida | 12% |
| 40 | Idaho | 12% |
| 41 | Arizona | 12% |
| 42 | Montana | 11% |
| 43 | North Dakota | 11% |
| 44 | Nevada | 11% |
| 45 | New Mexico | 11% |
| 46 | Washington | 10% |
| 47 | California | 10% |
| 48 | Utah | 9% |
| 49 | Alaska | 9% |
| 50 | Wyoming | 9% |
| 51 | Hawaii | 9% |
Average Student Loan Balances Over Time
The table below shows the average student loan balance over time. Student loan balances have increased dramatically over time, with the average student loan balance more than doubling over the period from 2007 through 2021. In 2007, the average student loan balance was $18,233, while the average student loan balance at the end of June 2021 was $37,105. Furthermore, the number of Americans carrying an outstanding student loan increased from 9% in 2007 to 13% of the population in 2021.
| Year | Average Student Loan Balance | Percent of Population with Student Loans |
|---|---|---|
| 2021 | $37,105 | 13% |
| 2020 | $36,510 | 13% |
| 2019 | $35,205 | 13% |
| 2018 | $33,548 | 13% |
| 2017 | $32,087 | 13% |
| 2016 | $30,548 | 13% |
| 2015 | $29,144 | 13% |
| 2014 | $27,759 | 13% |
| 2013 | $26,268 | 13% |
| 2012 | $24,757 | 12% |
| 2011 | $23,238 | 12% |
| 2010 | $21,860 | 11% |
| 2009 | $20,467 | 10% |
| 2008 | $19,298 | 10% |
| 2007 | $18,233 | 9% |
Methodology
We used data provided by the U.S. Department of Education on the Federal student loan portfolios held by the U.S. government. This dataset includes the total balance of the student loan portfolio by state, as well as the number of borrowers in each state. We also used data on population from each state provided by the U.S. Census Bureau.
To determine the states with the highest average student loan balances, we divided the student loan portfolio in each state by the number of borrowers in each state. We then ranked the states from the highest to lowest average balances.
To determine the states where the highest percentage of residents have student loans, we divided the number of outstanding student loan borrowers by the population of each state. We then ranked the states based on the percentage of residents carrying student loans.
We also calculated the average student loan balance nationwide over the period of 2007 through the present, along with the percentage of the population with an outstanding student loan.
Sources
- U.S. Department of Education, Federal Student Aid, Federal Student Loan Portfolio, Portfolio by Location
- U.S. Census Bureau, Annual Estimates of the Resident Population for the United States, Regions, States, and Puerto Rico