


With the coronavirus epidemic continuing to have a major impact on the United States heading into winter and the traditional flu season, the U.S. Centers for Disease Control has recommended that “everyone 6 months and older should get a flu vaccine every season with rare exceptions.” Medical experts have expressed concern that a combination of flu and coronavirus illness could lead to a “twindemic” of both diseases that may put stress on local health care systems. Leaders in public health are encouraging Americans to get flu immunizations this year in order to reduce the impact of the flu, keep fellow citizens healthy, and save health resources for a possible increase in coronavirus cases heading into the winter.

In this analysis, AdvisorSmith examined data published by the U.S. CDC on the rates of flu vaccination in all 50 U.S. states over the past three years to determine the states with the highest and lowest rates of flu vaccination. While the flu vaccine is generally available throughout the country, states vary in their ability to distribute the vaccine, as well as in the ability to convince residents to get vaccinated.
Our analysis found that the average flu vaccination rate over the past three years nationwide was 47.6%, and flu vaccination rates have been rising, from an average of 41.7% during the 2017-2018 flu season, up to an average of 51.8% nationwide during the 2019-2020 flu season.
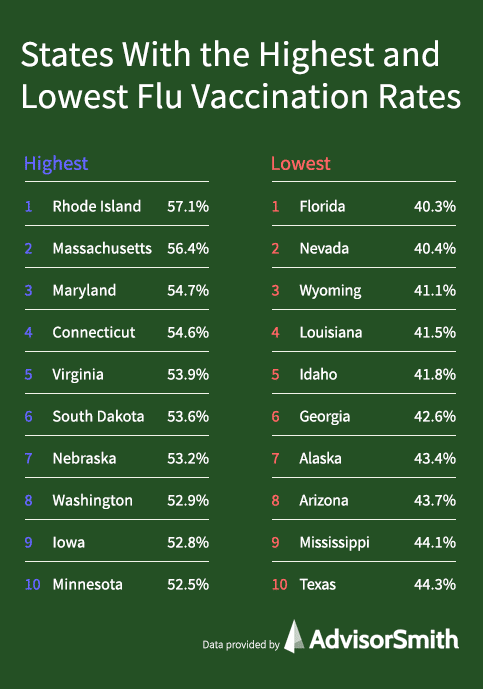
States With the Highest Flu Vaccination Rates
1. Rhode Island
3-year Average Flu Vaccination Rate: 57.1%
2019-2020 Flu Season Vaccination Rate: 60.9%
2. Massachusetts
3-year Average Flu Vaccination Rate: 56.4%
2019-2020 Flu Season Vaccination Rate: 60.6%
3. Maryland
3-year Average Flu Vaccination Rate: 54.7%
2019-2020 Flu Season Vaccination Rate: 57.8%
4. Connecticut
3-year Average Flu Vaccination Rate: 54.6%
2019-2020 Flu Season Vaccination Rate: 60.7%
5. Virginia
3-year Average Flu Vaccination Rate: 53.9%
2019-2020 Flu Season Vaccination Rate: 58.8%
| Rank | State | 2017-2018 | 2018-2019 | 2019-2020 | Avg 2017-2020 |
|---|---|---|---|---|---|
| 1 | Rhode Island | 50.1% | 60.4% | 60.9% | 57.1% |
| 2 | Massachusetts | 49.7% | 58.9% | 60.6% | 56.4% |
| 3 | Maryland | 49.3% | 57.1% | 57.8% | 54.7% |
| 4 | Connecticut | 46.3% | 56.8% | 60.7% | 54.6% |
| 5 | Virginia | 48.1% | 54.7% | 58.8% | 53.9% |
| 6 | South Dakota | 47.7% | 54.4% | 58.7% | 53.6% |
| 7 | Nebraska | 47.0% | 54.2% | 58.3% | 53.2% |
| 8 | Washington | 48.5% | 53.8% | 56.3% | 52.9% |
| 9 | Iowa | 47.1% | 54.8% | 56.6% | 52.8% |
| 10 | Minnesota | 48.4% | 52.7% | 56.3% | 52.5% |
| 11 | North Carolina | 46.0% | 54.9% | 55.8% | 52.2% |
| 12 | Pennsylvania | 46.0% | 54.2% | 56.1% | 52.1% |
| 13 | Delaware | 47.6% | 50.7% | 55.0% | 51.1% |
| 14 | New Hampshire | 43.7% | 52.0% | 57.6% | 51.1% |
| 15 | New Jersey | 48.1% | N/A | 54.0% | 51.1% |
| 16 | North Dakota | 44.9% | 51.1% | 56.5% | 50.8% |
| 17 | Vermont | 43.6% | 51.9% | 57.0% | 50.8% |
| 18 | Colorado | 45.2% | 51.6% | 55.6% | 50.8% |
| 19 | Oklahoma | 44.9% | 51.3% | 54.0% | 50.1% |
| 20 | Wisconsin | 40.4% | 50.9% | 58.3% | 49.9% |
| 21 | West Virginia | 47.6% | 48.2% | 52.2% | 49.3% |
| 22 | New Mexico | 43.7% | 49.9% | 53.2% | 48.9% |
| 23 | Kansas | 41.1% | 50.7% | 54.5% | 48.8% |
| 24 | Maine | 41.2% | 48.8% | 55.6% | 48.5% |
| 25 | Arkansas | 41.7% | 48.8% | 54.9% | 48.5% |
| 26 | New York | 40.4% | 51.9% | 52.9% | 48.4% |
| 27 | Kentucky | 44.1% | 49.6% | 50.9% | 48.2% |
| 28 | Hawaii | 43.2% | 50.2% | 51.0% | 48.1% |
| 29 | Ohio | 42.8% | 50.4% | 51.0% | 48.1% |
| 30 | Missouri | 42.4% | 50.0% | 50.2% | 47.5% |
| 31 | South Carolina | 44.1% | 46.8% | 50.7% | 47.2% |
| 32 | Montana | 42.1% | 48.7% | 49.6% | 46.8% |
| 33 | Oregon | 40.5% | 48.3% | 51.4% | 46.7% |
| 34 | Alabama | 42.4% | 48.3% | 48.4% | 46.4% |
| 35 | California | 40.0% | 47.4% | 51.3% | 46.2% |
| 36 | Illinois | 39.9% | 45.4% | 52.2% | 45.8% |
| 37 | Utah | 38.5% | 45.9% | 51.9% | 45.4% |
| 38 | Indiana | 37.0% | 47.9% | 50.8% | 45.2% |
| 39 | Michigan | 39.5% | 46.1% | 49.7% | 45.1% |
| 40 | Tennessee | 36.4% | 48.2% | 49.1% | 44.6% |
| 41 | Texas | 37.6% | 47.9% | 47.3% | 44.3% |
| 42 | Mississippi | 44.3% | 42.0% | 45.9% | 44.1% |
| 43 | Arizona | 38.9% | 45.6% | 46.5% | 43.7% |
| 44 | Alaska | 40.2% | 44.1% | 45.8% | 43.4% |
| 45 | Georgia | 38.7% | 43.1% | 45.9% | 42.6% |
| 46 | Idaho | 37.0% | 43.6% | 44.9% | 41.8% |
| 47 | Louisiana | 35.3% | 41.6% | 47.5% | 41.5% |
| 48 | Wyoming | 35.3% | 40.7% | 47.3% | 41.1% |
| 49 | Nevada | 39.1% | 37.8% | 44.4% | 40.4% |
| 50 | Florida | 35.6% | 40.9% | 44.5% | 40.3% |
States With the Lowest Flu Vaccination Rates
50. Florida
3-year Average Flu Vaccination Rate: 40.3%
2019-2020 Flu Season Vaccination Rate: 44.5%
49. Nevada
3-year Average Flu Vaccination Rate: 40.4%
2019-2020 Flu Season Vaccination Rate: 44.4%
48. Wyoming
3-year Average Flu Vaccination Rate: 41.4%
2019-2020 Flu Season Vaccination Rate: 47.3%
47. Louisiana
3-year Average Flu Vaccination Rate: 41.5%
2019-2020 Flu Season Vaccination Rate: 47.5%
46. Idaho
3-year Average Flu Vaccination Rate: 41.8%
2019-2020 Flu Season Vaccination Rate: 44.9%
Methodology
In this analysis, AdvisorSmith examined the rates of flu vaccination for the general population aged at least six months old over the past three flu seasons in 50 U.S. states. Using data published by the U.S. CDC, which is based on data from the Behavioral Risk Factor Surveillance System (BRFSS) survey, we determined the rates of flu vaccination for the 2017-2018, 2018-2019, and 2019-2020 flu seasons in each state. The flu seasons considered begin in September and conclude in June.
To find the states with the highest and lowest vaccination rates, we took an average of the vaccination rates in each state over the past three seasons. We then ranked the 50 states based upon their three-year average flu vaccination rates to determine the states with the highest and lowest flu vaccination rates.
Sources
- U.S. Centers for Disease Control and Prevention, Vaccination Coverage Report, FluVaxView, 2017-2018, 2018-2019, 2019-2020 Influenza Season
- U.S. Centers for Disease Control and Prevention, Who Needs a Flu Vaccine and When