


When many people think about the American dream, owning one’s home is often one of the first things that comes to mind. As a core part of the American narrative, homeownership is often seen as a prize or achievement for many Americans. However, being such a large country, the rate of homeownership varies greatly across the nation. Factors such as the mix of housing units, the availability of credit, and the demographics of an area influence the number of people who own their homes.

In this analysis, AdvisorSmith examined data published by the U.S. Census Bureau to find the states and cities in the United States with the highest and lowest rates of homeownership. We ranked all 50 states and the District of Columbia to find the states where more and fewer people own their homes. Additionally, we also examined the 75 largest metropolitan areas in the country to find the cities where the rates of homeownership are highest and lowest.
We found that nationwide, an average of 66.6% of homes were owner-occupied during the year 2020. Additionally, according to Zillow, the typical home in the United States was valued at $266,222 at the end of 2020.
States With the Highest Homeownership Rates
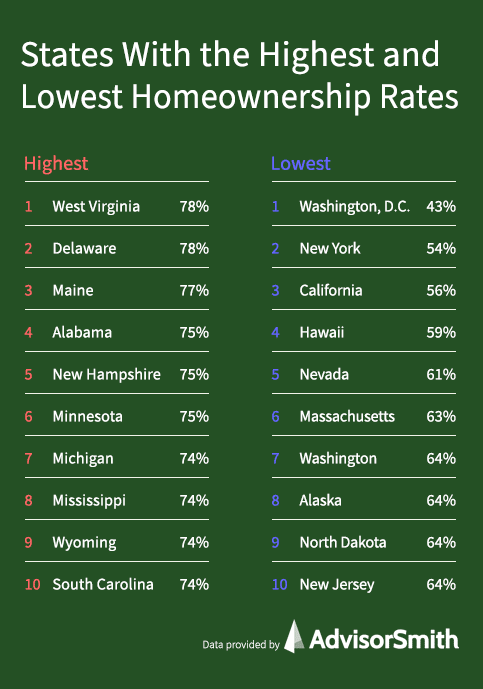
Leading the way with some of the highest homeownership rates in the nation were the small states of West Virginia, Delaware, Maine, and New Hampshire, which took four of the top five spots. These four states were all in the bottom quartile in terms of population. The top homeownership states included states with both below-average and above-average home prices.
| Rank | State | Homeownership Rate (%) | Typical Home Value | |||||||||
|---|---|---|---|---|---|---|---|---|---|---|---|---|
| 1 | West Virginia | 78.2 | $112,902 | |||||||||
| 2 | Delaware | 77.8 | $281,823 | |||||||||
| 3 | Maine | 77.1 | $272,177 | |||||||||
| 4 | Alabama | 74.8 | $157,406 | |||||||||
| 5 | New Hampshire | 74.6 | $326,588 | |||||||||
| 6 | Minnesota | 74.5 | $280,355 | |||||||||
| 7 | Michigan | 74.4 | $190,008 | |||||||||
| 8 | Mississippi | 74.2 | $133,299 | |||||||||
| 9 | Wyoming | 73.9 | $261,473 | |||||||||
| 10 | South Carolina | 73.6 | $204,830 | |||||||||
| 11 | Vermont | 73.1 | $275,027 | |||||||||
| 12 | Indiana | 72.7 | $170,955 | |||||||||
| 13 | Kentucky | 72.5 | $159,346 | |||||||||
| 14 | Iowa | 72.2 | $158,156 | |||||||||
| 15 | Maryland | 72.0 | $337,871 | |||||||||
| 16 | Utah | 71.7 | $395,950 | |||||||||
| 17 | Idaho | 71.5 | $340,203 | |||||||||
| 18 | South Dakota | 71.4 | $224,139 | |||||||||
| 19 | Missouri | 71.1 | $178,566 | |||||||||
| 20 | Oklahoma | 71.0 | $141,005 | |||||||||
| 21 | Virginia | 70.4 | $304,830 | |||||||||
| 22 | New Mexico | 70.3 | $227,133 | |||||||||
| 23 | Tennessee | 70.0 | $205,297 | |||||||||
| 24 | Pennsylvania | 69.9 | $213,386 | |||||||||
| 25 | Nebraska | 69.9 | $190,969 | |||||||||
| 26 | Kansas | 69.5 | $165,958 | |||||||||
| 27 | Ohio | 69.4 | $166,338 | |||||||||
| 28 | Louisiana | 69.1 | $178,258 | |||||||||
| 29 | Arkansas | 68.8 | $140,849 | |||||||||
| 30 | Arizona | 68.7 | $309,237 | |||||||||
| 31 | Florida | 68.7 | $267,843 | |||||||||
| 32 | North Carolina | 68.7 | $223,066 | |||||||||
| 33 | Montana | 68.4 | $320,998 | |||||||||
| 34 | Wisconsin | 67.9 | $211,086 | |||||||||
| 35 | Illinois | 67.3 | $218,271 | |||||||||
| 36 | Georgia | 67.3 | $221,419 | |||||||||
| 37 | Connecticut | 66.9 | $284,637 | |||||||||
| 38 | Texas | 66.5 | $222,507 | |||||||||
| 39 | Oregon | 65.2 | $398,418 | |||||||||
| 40 | Colorado | 64.9 | $438,270 | |||||||||
| 41 | Rhode Island | 64.5 | $335,597 | |||||||||
| 42 | New Jersey | 64.3 | $372,197 | |||||||||
| 43 | North Dakota | 64.2 | $238,419 | |||||||||
| 44 | Alaska | 64.1 | $291,078 | |||||||||
| 45 | Washington | 64.1 | $465,386 | |||||||||
| 46 | Massachusetts | 62.7 | $469,621 | |||||||||
| 47 | Nevada | 61.2 | $329,601 | |||||||||
| 48 | Hawaii | 58.8 | $678,175 | |||||||||
| 49 | California | 55.9 | $618,016 | |||||||||
| 50 | New York | 53.6 | $347,339 | |||||||||
| 51 | District of Columbia | 42.5 | $671,963 | |||||||||
States With the Lowest Homeownership Rates
The most unaffordable states in the nation for homeowners led the way for states with the lowest homeownership rates, including Washington, D.C., California, and Hawaii in three of the top five spots. New York, in second place, had a low homeownership rate in New York City, which accounts for about 43% of the state’s population.
| Rank | State | Homeownership Rate (%) | Typical Home Value | |||||||||
|---|---|---|---|---|---|---|---|---|---|---|---|---|
| 1 | District of Columbia | 42.5 | $671,963 | |||||||||
| 2 | New York | 53.6 | $347,339 | |||||||||
| 3 | California | 55.9 | $618,016 | |||||||||
| 4 | Hawaii | 58.8 | $678,175 | |||||||||
| 5 | Nevada | 61.2 | $329,601 | |||||||||
| 6 | Massachusetts | 62.7 | $469,621 | |||||||||
| 7 | Washington | 64.1 | $465,386 | |||||||||
| 8 | Alaska | 64.1 | $291,078 | |||||||||
| 9 | North Dakota | 64.2 | $238,419 | |||||||||
| 10 | New Jersey | 64.3 | $372,197 | |||||||||
| 11 | Rhode Island | 64.5 | $335,597 | |||||||||
| 12 | Colorado | 64.9 | $438,270 | |||||||||
| 13 | Oregon | 65.2 | $398,418 | |||||||||
| 14 | Texas | 66.5 | $222,507 | |||||||||
| 15 | Connecticut | 66.9 | $284,637 | |||||||||
| 16 | Georgia | 67.3 | $221,419 | |||||||||
| 17 | Illinois | 67.3 | $218,271 | |||||||||
| 18 | Wisconsin | 67.9 | $211,086 | |||||||||
| 19 | Montana | 68.4 | $320,998 | |||||||||
| 20 | North Carolina | 68.7 | $223,066 | |||||||||
| 21 | Florida | 68.7 | $267,843 | |||||||||
| 22 | Arizona | 68.7 | $309,237 | |||||||||
| 23 | Arkansas | 68.8 | $140,849 | |||||||||
| 24 | Louisiana | 69.1 | $178,258 | |||||||||
| 25 | Ohio | 69.4 | $166,338 | |||||||||
| 26 | Kansas | 69.5 | $165,958 | |||||||||
| 27 | Nebraska | 69.9 | $190,969 | |||||||||
| 28 | Pennsylvania | 69.9 | $213,386 | |||||||||
| 29 | Tennessee | 70.0 | $205,297 | |||||||||
| 30 | New Mexico | 70.3 | $227,133 | |||||||||
| 31 | Virginia | 70.4 | $304,830 | |||||||||
| 32 | Oklahoma | 71.0 | $141,005 | |||||||||
| 33 | Missouri | 71.1 | $178,566 | |||||||||
| 34 | South Dakota | 71.4 | $224,139 | |||||||||
| 35 | Idaho | 71.5 | $340,203 | |||||||||
| 36 | Utah | 71.7 | $395,950 | |||||||||
| 37 | Maryland | 72.0 | $337,871 | |||||||||
| 38 | Iowa | 72.2 | $158,156 | |||||||||
| 39 | Kentucky | 72.5 | $159,346 | |||||||||
| 40 | Indiana | 72.7 | $170,955 | |||||||||
| 41 | Vermont | 73.1 | $275,027 | |||||||||
| 42 | South Carolina | 73.6 | $204,830 | |||||||||
| 43 | Wyoming | 73.9 | $261,473 | |||||||||
| 44 | Mississippi | 74.2 | $133,299 | |||||||||
| 45 | Michigan | 74.4 | $190,008 | |||||||||
| 46 | Minnesota | 74.5 | $280,355 | |||||||||
| 47 | New Hampshire | 74.6 | $326,588 | |||||||||
| 48 | Alabama | 74.8 | $157,406 | |||||||||
| 49 | Maine | 77.1 | $272,177 | |||||||||
| 50 | Delaware | 77.8 | $281,823 | |||||||||
| 51 | West Virginia | 78.2 | $112,902 | |||||||||
Cities With the Highest Homeownership Rates
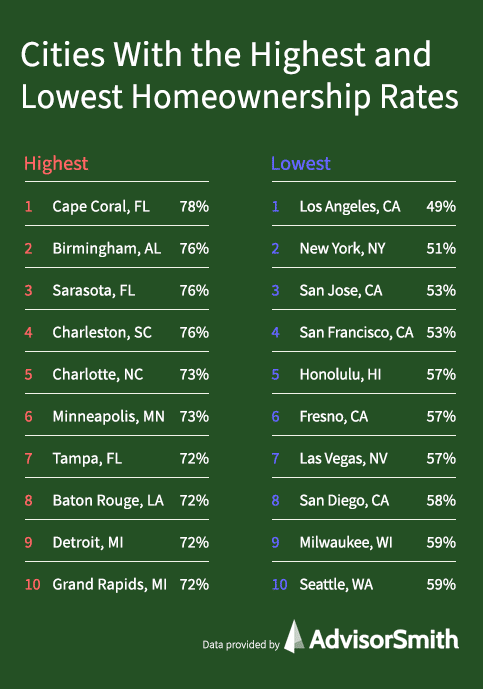
Cities in the South and Upper Midwest had some of the highest rates of homeownership among large U.S. cities. Cities in Florida, Alabama, the Carolinas, Louisiana, Minnesota, and Michigan accounted for the top 10.
| Rank | City | State | Homeownership Rate (%) | Typical Home Value |
|---|---|---|---|---|
| 1 | Cape Coral | FL | 77.5 | $256,354 |
| 2 | Birmingham | AL | 76.0 | $186,341 |
| 3 | Sarasota | FL | 75.9 | $301,576 |
| 4 | Charleston | SC | 75.7 | $292,842 |
| 5 | Charlotte | NC | 73.3 | $261,896 |
| 6 | Minneapolis | MN | 73.0 | $317,339 |
| 7 | Tampa | FL | 72.2 | $253,568 |
| 8 | Baton Rouge | LA | 72.1 | $194,761 |
| 9 | Detroit | MI | 71.8 | $196,916 |
| 10 | Grand Rapids | MI | 71.7 | $245,025 |
| 11 | Dayton | OH | 71.4 | $149,912 |
| 12 | Syracuse | NY | 71.3 | $158,843 |
| 13 | Cincinnati | OH | 71.2 | $205,882 |
| 14 | St. Louis | MO | 71.0 | $195,362 |
| 15 | Baltimore | MD | 70.7 | $316,339 |
| 16 | Hartford | CT | 70.1 | $257,551 |
| 17 | Indianapolis | IN | 70.0 | $201,930 |
| 18 | Buffalo | NY | 70.0 | $191,297 |
| 19 | Tulsa | OK | 70.0 | $160,657 |
| 20 | Pittsburgh | PA | 69.9 | $175,916 |
| 21 | Nashville | TN | 69.8 | $301,633 |
| 22 | Columbia | SC | 69.7 | $172,424 |
| 23 | Akron | OH | 69.6 | $166,445 |
| 24 | Albuquerque | NM | 69.5 | $235,955 |
| 25 | Louisville | KY | 69.2 | $196,057 |
| 26 | Philadelphia | PA | 69.1 | $274,409 |
| 27 | Allentown | PA | 68.9 | $236,289 |
| 28 | Omaha | NE | 68.6 | $215,478 |
| 29 | Knoxville | TN | 68.3 | $213,533 |
| 30 | Oklahoma City | OK | 68.3 | $169,064 |
| 31 | Raleigh | NC | 68.1 | $303,175 |
| 32 | Salt Lake City | UT | 68.0 | $431,135 |
| 33 | Phoenix | AZ | 67.9 | $329,041 |
| 34 | Washington | DC | 67.9 | $470,896 |
| 35 | Little Rock | AR | 67.7 | $163,471 |
| 36 | Rochester | NY | 67.4 | $170,778 |
| 37 | Tucson | AZ | 67.1 | $248,519 |
| 38 | Kansas City | MO | 66.7 | $224,783 |
| 39 | Richmond | VA | 66.6 | $265,380 |
| 40 | Atlanta | GA | 66.4 | $261,480 |
| 41 | New Orleans | LA | 66.4 | $222,204 |
| 42 | Cleveland | OH | 66.3 | $174,424 |
| 43 | Chicago | IL | 66.0 | $257,610 |
| 44 | Greensboro | NC | 65.9 | $173,310 |
| 45 | Worcester | MA | 65.9 | $331,031 |
| 46 | Virginia Beach | VA | 65.8 | $261,742 |
| 47 | Riverside | CA | 65.8 | $426,755 |
| 48 | Columbus | OH | 65.7 | $231,676 |
| 49 | Austin | TX | 65.4 | $379,241 |
| 50 | Stamford | CT | 65.4 | $453,881 |
| 51 | Houston | TX | 65.3 | $228,821 |
| 52 | Providence | RI | 64.9 | $352,115 |
| 53 | Jacksonville | FL | 64.7 | $249,357 |
| 54 | Dallas | TX | 64.7 | $271,372 |
| 55 | Orlando | FL | 64.2 | $274,195 |
| 56 | San Antonio | TX | 64.2 | $220,706 |
| 57 | Albany | NY | 64.0 | $220,273 |
| 58 | New Haven | CT | 63.5 | $259,365 |
| 59 | Toledo | OH | 63.4 | $135,314 |
| 60 | Sacramento | CA | 63.3 | $473,210 |
| 61 | Denver | CO | 62.8 | $483,593 |
| 62 | Memphis | TN | 62.7 | $172,049 |
| 63 | Portland | OR | 62.5 | $454,436 |
| 64 | Boston | MA | 61.2 | $535,002 |
| 65 | Miami | FL | 60.6 | $320,528 |
| 66 | Seattle | WA | 59.4 | $589,138 |
| 67 | Milwaukee | WI | 58.5 | $216,294 |
| 68 | San Diego | CA | 57.8 | $678,195 |
| 69 | Las Vegas | NV | 57.3 | $313,669 |
| 70 | Fresno | CA | 57.1 | $294,007 |
| 71 | Honolulu | HI | 57.0 | $740,338 |
| 72 | San Francisco | CA | 53.0 | $1,174,484 |
| 73 | San Jose | CA | 52.7 | $1,303,993 |
| 74 | New York | NY | 50.9 | $511,880 |
| 75 | Los Angeles | CA | 48.5 | $741,757 |
Cities With the Lowest Homeownership Rates
The most unaffordable cities in the nation led the list of cities with the lowest rates of homeownership. These cities included major cities in California, New York City, Honolulu, and Seattle. A notable exception in the top 10 was Milwaukee, a city with below-average housing costs but also low rates of homeownership.
| Rank | City | State | Homeownership Rate (%) | Typical Home Value |
|---|---|---|---|---|
| 1 | Los Angeles | CA | 48.5 | $741,757 |
| 2 | New York | NY | 50.9 | $511,880 |
| 3 | San Jose | CA | 52.7 | $1,303,993 |
| 4 | San Francisco | CA | 53 | $1,174,484 |
| 5 | Honolulu | HI | 57 | $740,338 |
| 6 | Fresno | CA | 57.1 | $294,007 |
| 7 | Las Vegas | NV | 57.3 | $313,669 |
| 8 | San Diego | CA | 57.8 | $678,195 |
| 9 | Milwaukee | WI | 58.5 | $216,294 |
| 10 | Seattle | WA | 59.4 | $589,138 |
| 11 | Miami | FL | 60.6 | $320,528 |
| 12 | Boston | MA | 61.2 | $535,002 |
| 13 | Portland | OR | 62.5 | $454,436 |
| 14 | Memphis | TN | 62.7 | $172,049 |
| 15 | Denver | CO | 62.8 | $483,593 |
| 16 | Sacramento | CA | 63.3 | $473,210 |
| 17 | Toledo | OH | 63.4 | $135,314 |
| 18 | New Haven | CT | 63.5 | $259,365 |
| 19 | Albany | NY | 64 | $220,273 |
| 20 | San Antonio | TX | 64.2 | $220,706 |
| 21 | Orlando | FL | 64.2 | $274,195 |
| 22 | Dallas | TX | 64.7 | $271,372 |
| 23 | Jacksonville | FL | 64.7 | $249,357 |
| 24 | Providence | RI | 64.9 | $352,115 |
| 25 | Houston | TX | 65.3 | $228,821 |
| 26 | Stamford | CT | 65.4 | $453,881 |
| 27 | Austin | TX | 65.4 | $379,241 |
| 28 | Columbus | OH | 65.7 | $231,676 |
| 29 | Riverside | CA | 65.8 | $426,755 |
| 30 | Virginia Beach | VA | 65.8 | $261,742 |
| 31 | Worcester | MA | 65.9 | $331,031 |
| 32 | Greensboro | NC | 65.9 | $173,310 |
| 33 | Chicago | IL | 66 | $257,610 |
| 34 | Cleveland | OH | 66.3 | $174,424 |
| 35 | New Orleans | LA | 66.4 | $222,204 |
| 36 | Atlanta | GA | 66.4 | $261,480 |
| 37 | Richmond | VA | 66.6 | $265,380 |
| 38 | Kansas City | MO | 66.7 | $224,783 |
| 39 | Tucson | AZ | 67.1 | $248,519 |
| 40 | Rochester | NY | 67.4 | $170,778 |
| 41 | Little Rock | AR | 67.7 | $163,471 |
| 42 | Washington | DC | 67.9 | $470,896 |
| 43 | Phoenix | AZ | 67.9 | $329,041 |
| 44 | Salt Lake City | UT | 68 | $431,135 |
| 45 | Raleigh | NC | 68.1 | $303,175 |
| 46 | Oklahoma City | OK | 68.3 | $169,064 |
| 47 | Knoxville | TN | 68.3 | $213,533 |
| 48 | Omaha | NE | 68.6 | $215,478 |
| 49 | Allentown | PA | 68.9 | $236,289 |
| 50 | Philadelphia | PA | 69.1 | $274,409 |
| 51 | Louisville | KY | 69.2 | $196,057 |
| 52 | Albuquerque | NM | 69.5 | $235,955 |
| 53 | Akron | OH | 69.6 | $166,445 |
| 54 | Columbia | SC | 69.7 | $172,424 |
| 55 | Nashville | TN | 69.8 | $301,633 |
| 56 | Pittsburgh | PA | 69.9 | $175,916 |
| 57 | Tulsa | OK | 70 | $160,657 |
| 58 | Buffalo | NY | 70 | $191,297 |
| 59 | Indianapolis | IN | 70 | $201,930 |
| 60 | Hartford | CT | 70.1 | $257,551 |
| 61 | Baltimore | MD | 70.7 | $316,339 |
| 62 | St. Louis | MO | 71 | $195,362 |
| 63 | Cincinnati | OH | 71.2 | $205,882 |
| 64 | Syracuse | NY | 71.3 | $158,843 |
| 65 | Dayton | OH | 71.4 | $149,912 |
| 66 | Grand Rapids | MI | 71.7 | $245,025 |
| 67 | Detroit | MI | 71.8 | $196,916 |
| 68 | Baton Rouge | LA | 72.1 | $194,761 |
| 69 | Tampa | FL | 72.2 | $253,568 |
| 70 | Minneapolis | MN | 73 | $317,339 |
| 71 | Charlotte | NC | 73.3 | $261,896 |
| 72 | Charleston | SC | 75.7 | $292,842 |
| 73 | Sarasota | FL | 75.9 | $301,576 |
| 74 | Birmingham | AL | 76 | $186,341 |
| 75 | Cape Coral | FL | 77.5 | $256,354 |
Methodology
AdvisorSmith used data published by the U.S. Census Bureau on the percentage of homeownership in each of the 50 states and the District of Columbia, as well as data on the homeownership rate of the 75 largest metropolitan areas, which we call cities in our study.
We used the homeownership rate data, which reports the percentage of homeowner-occupied housing units over the total number of housing units in each city or state. To calculate the homeownership rate, we took the average homeownership rate reported for each state or city for all four quarters of 2020.
We ranked the states based upon their homeownership rates to find the states with the highest and lowest rates of homeownership. We also ranked the cities to find the cities with the highest and lowest rates of homeownership.
Additionally, we used data from the Zillow Home Value Index, which provides information about the value of the typical home in each city based upon homes in the 35th through 65th percentile of home values for each city. For each state and city in our study, we included the typical home value at the end of 2020.
Sources
- U.S. Census Bureau, Current Population Survey, Housing Vacancies and Homeownership
- Zillow Home Value Index