


In this report, AdvisorSmith examined crime reports published by the Federal Bureau of Investigation to understand which cities in Texas have the lowest levels of reported crime on a per capita basis. We applied a proprietary methodology to score the crime levels in cities across the state that takes into account the level of reported crimes, as well as the relative severity of crimes in each city. This crime score places higher weight on more serious crimes like murder and rape, while assigning a lower weighting to property crimes. We found that the average crime score for Texas cities was 48, and scores ranged from 6 up to 371.
We studied a total of 655 cities in the states of Texas, which were segmented into small, midsize, and large categories based upon population. Small cities were those with under 10,000 residents. Midsize cities had between 10,000 and 100,000 residents, and large cities had over 100,000 residents. There were a total of 39 large cities, 198 midsize cities, and 418 small cities included in this analysis.

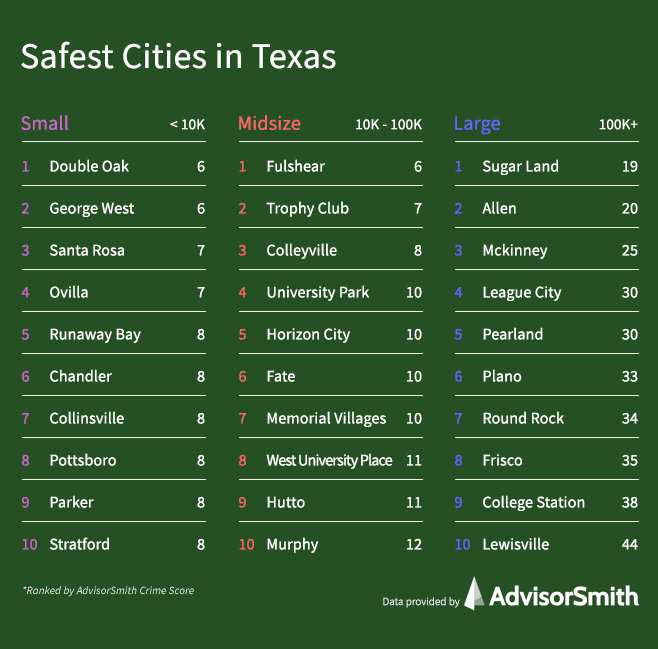
Safest Large Cities in Texas
Among large cities in Texas, the average crime score was 69. The safest large city had a crime score of 19, while the city with the highest reported crime had a score of 205. Cities with at least 100,000 residents were considered large cities for the purposes of this analysis.
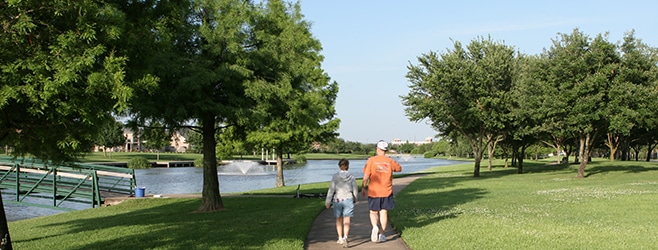
The safest large city in Texas was Sugar Land. This city is located in the southwest corner of the Houston metropolitan area and is a suburban part of the area. Historically, the city was home to a large sugar plantation, and it later became host to numerous large master-planned suburban housing communities. Imperial Sugar is still based in Sugar Land, and the city is also home to several energy and petroleum products companies.
Amarillo was the large Texas city with the highest reported levels of crime in the state. Located in the northwestern portion of Texas in the panhandle, Amarillo historically was known for cattle trading, helium production, meat processing, and nuclear weapon assembly. Energy is also a major industry in the city.
| Rank | City | Violent Crimes per 1,000 Residents | Property Crimes per 1,000 Residents | Crime Score |
|---|---|---|---|---|
| 1 | Sugar Land | 2.6 | 12.9 | 18.9 |
| 2 | Allen | 4.0 | 10.9 | 19.8 |
| 3 | Mckinney | 6.8 | 9.9 | 25.1 |
| 4 | League City | 8.0 | 13.9 | 29.7 |
| 5 | Pearland | 7.4 | 17.3 | 30.3 |
| 6 | Plano | 6.5 | 17.2 | 32.5 |
| 7 | Round Rock | 9.5 | 17.1 | 33.6 |
| 8 | Frisco | 7.8 | 19.4 | 35.2 |
| 9 | College Station | 8.8 | 17.6 | 37.5 |
| 10 | Lewisville | 10.3 | 19.9 | 43.6 |
| 11 | Mcallen | 13.0 | 24.8 | 43.6 |
| 12 | El Paso | 12.6 | 15.1 | 47.3 |
| 13 | Laredo | 14.0 | 17.7 | 49.1 |
| 14 | Irving | 11.8 | 24.4 | 49.8 |
| 15 | Denton | 13.2 | 20.5 | 50.5 |
| 16 | Midland | 14.0 | 23.8 | 53.6 |
| 17 | Garland | 15.9 | 25.9 | 59.4 |
| 18 | Grand Prairie | 12.0 | 30.6 | 60.0 |
| 19 | Edinburg | 15.5 | 29.3 | 61.1 |
| 20 | Killeen | 17.9 | 22.6 | 62.9 |
| 21 | Brownsville | 16.7 | 24.7 | 64.2 |
| 22 | Fort Worth | 13.4 | 27.2 | 65.4 |
| 23 | Tyler | 14.2 | 30.0 | 65.7 |
| 24 | Pasadena | 15.8 | 25.1 | 70.6 |
| 25 | San Angelo | 24.1 | 31.4 | 75.5 |
| 26 | Abilene | 26.7 | 26.4 | 75.6 |
| 27 | Mesquite | 15.8 | 36.4 | 77.5 |
| 28 | Wichita Falls | 26.4 | 30.4 | 78.4 |
| 29 | Arlington | 22.4 | 28.1 | 78.5 |
| 30 | Austin | 21.6 | 39.3 | 84.5 |
| 31 | Waco | 21.7 | 32.9 | 85.9 |
| 32 | Corpus Christi | 26.5 | 34.5 | 104.3 |
| 33 | San Antonio | 21.8 | 43.2 | 104.9 |
| 34 | Dallas | 24.4 | 35.4 | 108.9 |
| 35 | Odessa | 29.7 | 29.9 | 117.5 |
| 36 | Beaumont | 38.3 | 36.2 | 130.7 |
| 37 | Lubbock | 30.2 | 46.1 | 131.0 |
| 38 | Houston | 30.0 | 44.1 | 131.5 |
| 39 | Amarillo | 53.0 | 75.3 | 204.6 |
Safest Midsize Cities in Texas
The safest midsize city in Texas was Fulshear. This city is located on the far western end of the Houston metropolitan area. Fulshear is a city with a very high median household income. The city is primarily a farming and ranching community but has a growing commercial district.
The average crime score for midsize cities in Texas was 51. The safest midsize city had a crime score of 6, while the city with the highest score had a crime score of 201. Midsize cities included those cities with between 10,000 and 100,000 residents.
| Rank | City | Violent Crimes per 1,000 Residents | Property Crimes per 1,000 Residents | Crime Score |
|---|---|---|---|---|
| 1 | Fulshear | 0.1 | 6.2 | 6.4 |
| 2 | Trophy Club | 1.6 | 5.1 | 7.1 |
| 3 | Colleyville | 1.4 | 6.1 | 8.5 |
| 4 | University Park | 1.0 | 7.4 | 9.8 |
| 5 | Horizon City | 3.2 | 5.0 | 10.0 |
| 6 | Fate | 3.0 | 4.7 | 10.2 |
| 7 | Memorial Villages | 1.1 | 6.0 | 10.3 |
| 8 | West University Place | 0.9 | 7.8 | 10.9 |
| 9 | Hutto | 3.4 | 4.3 | 11.0 |
| 10 | Murphy | 4.4 | 5.0 | 11.9 |
| 11 | Highland Village | 3.8 | 6.5 | 13.8 |
| 12 | Keller | 3.8 | 7.2 | 14.0 |
| 13 | Melissa | 3.6 | 6.8 | 14.2 |
| 14 | Lockhart | 2.3 | 10.9 | 14.2 |
| 15 | Little Elm | 4.5 | 3.9 | 15.3 |
| 16 | Flower Mound | 2.7 | 9.3 | 15.3 |
| 17 | Wylie | 3.3 | 7.5 | 15.4 |
| 18 | Lakeway | 3.5 | 9.0 | 15.5 |
| 19 | Corinth | 3.8 | 7.6 | 15.5 |
| 20 | Southlake | 2.1 | 12.1 | 15.8 |
| 21 | Prosper | 4.5 | 9.2 | 16.7 |
| 22 | Celina | 4.9 | 6.7 | 16.7 |
| 23 | Canyon | 4.5 | 9.4 | 18.9 |
| 24 | Manvel | 7.0 | 8.2 | 19.1 |
| 25 | Coppell | 3.1 | 12.7 | 19.8 |
| 26 | Mansfield | 3.4 | 10.8 | 20.2 |
| 27 | Hewitt | 6.4 | 9.3 | 21.0 |
| 28 | Fredericksburg | 4.2 | 11.3 | 21.1 |
| 29 | Pflugerville | 4.3 | 12.5 | 21.6 |
| 30 | Anna | 6.0 | 8.9 | 21.8 |
| 31 | Friendswood | 6.7 | 9.1 | 21.9 |
| 32 | Socorro | 6.7 | 8.6 | 22.0 |
| 33 | Georgetown | 6.3 | 9.3 | 22.1 |
| 34 | Pearsall | 6.8 | 12.5 | 22.2 |
| 35 | Cedar Park | 7.3 | 9.4 | 22.2 |
| 36 | Cibolo | 6.5 | 8.7 | 22.5 |
| 37 | Princeton | 7.5 | 10.9 | 23.4 |
| 38 | Santa Fe | 7.2 | 9.3 | 23.5 |
| 39 | Sachse | 9.4 | 10.0 | 23.5 |
| 40 | Leander | 7.1 | 8.8 | 23.8 |
| 41 | Midlothian | 7.6 | 11.1 | 23.9 |
| 42 | Buda | 4.7 | 14.9 | 25.8 |
| 43 | Missouri City | 6.0 | 11.7 | 26.2 |
| 44 | Forney | 6.7 | 11.9 | 26.2 |
| 45 | Ennis | 5.4 | 16.6 | 26.8 |
| 46 | Bellaire | 3.0 | 17.7 | 27.5 |
| 47 | Rio Grande City | 4.5 | 18.4 | 27.7 |
| 48 | Sulphur Springs | 7.1 | 10.4 | 29.2 |
| 49 | Kyle | 8.4 | 13.2 | 29.5 |
| 50 | Seagoville | 4.5 | 20.8 | 29.8 |
| 51 | Benbrook | 5.6 | 15.5 | 29.9 |
| 52 | Rowlett | 8.4 | 14.3 | 30.2 |
| 53 | Rockwall | 7.8 | 16.1 | 30.4 |
| 54 | Lumberton | 9.7 | 11.5 | 30.6 |
| 55 | Robinson | 6.5 | 13.2 | 31.8 |
| 56 | Red Oak | 3.4 | 22.9 | 32.5 |
| 57 | White Settlement | 6.1 | 19.8 | 33.3 |
| 58 | Boerne | 7.6 | 18.7 | 33.8 |
| 59 | Watauga | 9.6 | 15.5 | 34.0 |
| 60 | Mission | 7.2 | 18.9 | 34.0 |
| 61 | Harker Heights | 6.1 | 16.3 | 34.1 |
| 62 | Belton | 2.1 | 19.0 | 34.2 |
| 63 | Weatherford | 9.3 | 14.8 | 34.6 |
| 64 | Grapevine | 7.0 | 18.7 | 34.6 |
| 65 | Jacinto City | 7.2 | 21.4 | 34.8 |
| 66 | Portland | 11.0 | 18.1 | 34.9 |
| 67 | Roma | 13.5 | 9.4 | 35.0 |
| 68 | Schertz | 8.6 | 14.3 | 35.1 |
| 69 | Deer Park | 9.1 | 16.1 | 35.3 |
| 70 | Bonham | 5.9 | 16.1 | 35.5 |
| 71 | Seabrook | 12.5 | 13.6 | 35.7 |
| 72 | Kerrville | 11.5 | 12.6 | 36.1 |
| 73 | Hidalgo | 7.8 | 8.8 | 36.3 |
| 74 | Jacksonville | 9.2 | 17.9 | 36.7 |
| 75 | Royse City | 9.0 | 14.9 | 36.8 |
| 76 | Dumas | 8.5 | 17.6 | 36.9 |
| 77 | Galena Park | 11.4 | 12.9 | 37.3 |
| 78 | Farmers Branch | 6.7 | 22.4 | 37.6 |
| 79 | Del Rio | 14.2 | 17.0 | 37.8 |
| 80 | Azle | 10.9 | 20.7 | 37.8 |
| 81 | Waxahachie | 7.9 | 21.4 | 38.1 |
| 82 | Euless | 8.4 | 20.4 | 38.9 |
| 83 | Stephenville | 9.1 | 18.1 | 39.0 |
| 84 | Vidor | 8.0 | 21.1 | 39.1 |
| 85 | North Richland Hills | 10.2 | 17.8 | 40.2 |
| 86 | Eagle Pass | 11.0 | 23.0 | 40.3 |
| 87 | Saginaw | 10.2 | 16.8 | 40.9 |
| 88 | Burkburnett | 9.1 | 19.0 | 41.2 |
| 89 | La Porte | 14.0 | 14.6 | 42.0 |
| 90 | Ingleside | 9.9 | 16.8 | 42.1 |
| 91 | The Colony | 9.3 | 14.5 | 43.2 |
| 92 | Angleton | 13.3 | 14.1 | 43.2 |
| 93 | Richardson | 6.8 | 25.7 | 44.0 |
| 94 | Gatesville | 15.4 | 16.4 | 45.4 |
| 95 | Beeville | 7.1 | 27.0 | 45.5 |
| 96 | Cedar Hill | 9.1 | 25.9 | 46.6 |
| 97 | Port Neches | 15.3 | 15.5 | 47.1 |
| 98 | Burleson | 12.5 | 18.9 | 47.9 |
| 99 | New Braunfels | 16.6 | 15.3 | 48.1 |
| 100 | Conroe | 11.6 | 24.0 | 48.3 |
| 101 | Crowley | 9.6 | 26.1 | 48.9 |
| 102 | Pharr | 15.3 | 17.6 | 49.9 |
| 103 | Carrollton | 9.3 | 26.3 | 50.2 |
| 104 | Bedford | 12.6 | 20.3 | 50.3 |
| 105 | Greenville | 12.7 | 22.2 | 50.4 |
| 106 | Plainview | 13.5 | 25.8 | 50.9 |
| 107 | Taylor | 13.6 | 24.8 | 50.9 |
| 108 | Port Lavaca | 12.7 | 13.8 | 51.0 |
| 109 | Freeport | 10.5 | 21.0 | 51.3 |
| 110 | Dickinson | 13.9 | 17.7 | 52.0 |
| 111 | Converse | 8.7 | 16.1 | 52.2 |
| 112 | Lake Jackson | 14.9 | 25.4 | 52.4 |
| 113 | Athens | 8.8 | 22.1 | 52.4 |
| 114 | Andrews | 13.3 | 15.5 | 52.5 |
| 115 | Alvin | 13.0 | 24.5 | 53.3 |
| 116 | Sweetwater | 12.8 | 26.2 | 54.1 |
| 117 | Cleburne | 15.4 | 19.1 | 54.1 |
| 118 | Orange | 11.0 | 18.1 | 54.1 |
| 119 | Richmond | 14.5 | 18.5 | 54.3 |
| 120 | Denison | 11.8 | 18.2 | 54.5 |
| 121 | Huntsville | 15.0 | 15.7 | 55.3 |
| 122 | Manor | 12.6 | 20.1 | 55.7 |
| 123 | Haltom City | 11.1 | 26.3 | 55.8 |
| 124 | Mineral Wells | 16.3 | 31.1 | 55.9 |
| 125 | Desoto | 16.1 | 22.0 | 55.9 |
| 126 | Temple | 17.0 | 22.2 | 56.5 |
| 127 | Lancaster | 12.0 | 25.5 | 56.7 |
| 128 | Nederland | 17.3 | 18.9 | 57.0 |
| 129 | Hereford | 8.3 | 21.0 | 57.2 |
| 130 | Seguin | 20.0 | 23.6 | 59.1 |
| 131 | Hurst | 11.8 | 35.8 | 59.9 |
| 132 | Forest Hill | 13.0 | 31.7 | 60.0 |
| 133 | Terrell | 13.6 | 34.3 | 61.2 |
| 134 | Pleasanton | 15.6 | 26.5 | 61.5 |
| 135 | San Marcos | 15.6 | 23.1 | 62.0 |
| 136 | Borger | 18.6 | 24.3 | 62.6 |
| 137 | Live Oak | 12.5 | 39.6 | 62.7 |
| 138 | Rosenberg | 23.0 | 17.6 | 63.0 |
| 139 | San Juan | 14.7 | 22.9 | 63.0 |
| 140 | Duncanville | 11.5 | 27.8 | 63.1 |
| 141 | El Campo | 15.0 | 29.9 | 63.5 |
| 142 | Glenn Heights | 17.3 | 23.9 | 63.6 |
| 143 | South Houston | 13.2 | 25.7 | 63.7 |
| 144 | Leon Valley | 11.2 | 46.3 | 63.8 |
| 145 | Vernon | 19.3 | 18.5 | 64.6 |
| 146 | Universal City | 18.3 | 27.4 | 65.0 |
| 147 | Nacogdoches | 22.0 | 25.7 | 65.9 |
| 148 | Groves | 17.4 | 19.5 | 66.2 |
| 149 | Clute | 20.6 | 22.5 | 67.1 |
| 150 | Robstown | 18.7 | 27.8 | 67.5 |
| 151 | Rockport | 12.4 | 40.6 | 68.1 |
| 152 | Bryan | 20.5 | 22.3 | 68.4 |
| 153 | Copperas Cove | 26.1 | 21.6 | 69.2 |
| 154 | Sherman | 19.7 | 26.1 | 69.8 |
| 155 | Granbury | 13.8 | 41.3 | 69.8 |
| 156 | Texas City | 20.7 | 28.2 | 71.6 |
| 157 | Kilgore | 21.7 | 27.6 | 72.1 |
| 158 | Brenham | 21.4 | 20.8 | 72.3 |
| 159 | Longview | 16.2 | 30.2 | 73.1 |
| 160 | Gainesville | 21.5 | 22.2 | 73.2 |
| 161 | Port Arthur | 19.6 | 21.8 | 75.6 |
| 162 | Pecos | 11.3 | 17.8 | 75.9 |
| 163 | Palestine | 19.8 | 24.9 | 76.2 |
| 164 | Kingsville | 17.4 | 29.6 | 76.9 |
| 165 | Victoria | 19.3 | 29.2 | 78.2 |
| 166 | Marshall | 16.6 | 35.9 | 79.8 |
| 167 | Weslaco | 22.0 | 36.6 | 80.5 |
| 168 | Uvalde | 24.2 | 37.6 | 80.9 |
| 169 | Baytown | 17.7 | 38.6 | 81.2 |
| 170 | Brownwood | 26.4 | 34.8 | 81.6 |
| 171 | Mercedes | 22.2 | 39.5 | 83.2 |
| 172 | Alton | 13.5 | 15.8 | 83.4 |
| 173 | Galveston | 23.3 | 32.3 | 86.1 |
| 174 | Stafford | 19.6 | 32.8 | 88.1 |
| 175 | Alamo | 14.1 | 49.2 | 88.6 |
| 176 | Mount Pleasant | 25.8 | 28.5 | 88.7 |
| 177 | Katy | 16.2 | 50.1 | 90.3 |
| 178 | Balch Springs | 20.7 | 35.5 | 91.0 |
| 179 | Texarkana | 20.6 | 45.7 | 91.2 |
| 180 | Addison | 21.6 | 43.0 | 91.7 |
| 181 | San Benito | 15.9 | 38.8 | 91.9 |
| 182 | Big Spring | 26.8 | 37.1 | 92.8 |
| 183 | Harlingen | 20.6 | 48.1 | 92.9 |
| 184 | Lufkin | 20.8 | 43.8 | 93.7 |
| 185 | La Marque | 24.8 | 45.4 | 93.8 |
| 186 | Alice | 26.1 | 44.0 | 99.0 |
| 187 | Bay City | 37.5 | 38.9 | 99.9 |
| 188 | Henderson | 30.8 | 38.7 | 101.1 |
| 189 | Raymondville | 21.5 | 22.3 | 104.2 |
| 190 | Pampa | 27.0 | 38.1 | 106.1 |
| 191 | Corsicana | 31.2 | 31.2 | 108.1 |
| 192 | Paris | 26.6 | 28.8 | 110.9 |
| 193 | Snyder | 20.3 | 20.2 | 114.8 |
| 194 | Donna | 21.9 | 47.1 | 115.1 |
| 195 | Levelland | 27.3 | 29.9 | 116.1 |
| 196 | Webster | 23.1 | 67.8 | 124.4 |
| 197 | Bellmead | 33.9 | 59.2 | 143.7 |
| 198 | Humble | 29.8 | 104.0 | 201.0 |
Safest Small Cities in Texas
Double Oak was the safest small city in the state of Texas. This city, with a population of just over 3,000 residents, is a suburb in the northern part of the Dallas-Fort Worth metropolitan area. The city has a rural character and is restricted to single-family homes with minimum 1-acre lot sizes. The city of Flower Mound surrounds the southern and eastern parts of Double Oak.
In the table below, you can find a list of small cities in Texas, ranked by how safe they are. The table includes information about the rate of violent and property crimes, along with the city’s crime score. For small cities in Texas, the average crime score was 44, while the range was between 6 and 371.
| Rank | City | Violent Crimes per 1,000 Residents | Property Crimes per 1,000 Residents | Crime Score |
|---|---|---|---|---|
| 1 | Double Oak | 4.9 | 1.0 | 5.9 |
| 2 | George West | 4.6 | 1.5 | 6.2 |
| 3 | Santa Rosa | 2.6 | 3.9 | 6.5 |
| 4 | Ovilla | 1.9 | 3.7 | 7.2 |
| 5 | Runaway Bay | 1.9 | 5.7 | 7.6 |
| 6 | Chandler | 1.9 | 5.7 | 7.6 |
| 7 | Collinsville | 3.1 | 4.6 | 7.7 |
| 8 | Pottsboro | 3.9 | 3.9 | 7.7 |
| 9 | Parker | 1.8 | 6.1 | 7.9 |
| 10 | Stratford | 4.1 | 4.1 | 8.2 |
| 11 | Johnson City | 2.3 | 6.8 | 9.1 |
| 12 | Jourdanton | 4.7 | 2.9 | 9.1 |
| 13 | Danbury | 3.4 | 5.9 | 9.3 |
| 14 | Shavano Park | 0.9 | 5.9 | 9.8 |
| 15 | Bells | 8.0 | 2.7 | 10.6 |
| 16 | Rancho Viejo | 3.6 | 4.2 | 10.9 |
| 17 | Llano | 7.8 | 3.4 | 11.2 |
| 18 | Pilot Point | 3.0 | 5.7 | 11.7 |
| 19 | Helotes | 2.1 | 8.2 | 11.7 |
| 20 | Crosbyton | 0.0 | 11.8 | 11.8 |
| 21 | West | 2.9 | 7.0 | 12.0 |
| 22 | Prairie View | 3.5 | 4.7 | 12.1 |
| 23 | Needville | 8.7 | 1.0 | 12.1 |
| 24 | Muleshoe | 2.9 | 5.3 | 12.2 |
| 25 | San Elizario | 2.4 | 4.1 | 12.3 |
| 26 | Brookside Village | 0.0 | 12.5 | 12.5 |
| 27 | Fairview | 1.6 | 4.5 | 12.5 |
| 28 | Fair Oaks Ranch | 3.0 | 3.8 | 12.6 |
| 29 | Garden Ridge | 2.3 | 10.5 | 12.8 |
| 30 | Nocona | 1.8 | 7.3 | 12.8 |
| 31 | Caldwell | 6.8 | 2.9 | 13.1 |
| 32 | Morgans Point Resort | 2.1 | 2.4 | 13.2 |
| 33 | Spearman | 5.1 | 2.9 | 13.6 |
| 34 | Arp | 5.9 | 7.9 | 13.8 |
| 35 | Indian Lake | 7.0 | 7.0 | 14.0 |
| 36 | Savoy | 0.0 | 14.0 | 14.0 |
| 37 | Rollingwood | 2.0 | 12.3 | 14.3 |
| 38 | Argyle | 3.8 | 4.5 | 14.3 |
| 39 | Iowa Park | 3.9 | 7.5 | 14.4 |
| 40 | Clifton | 5.4 | 7.6 | 14.5 |
| 41 | Boyd | 4.5 | 4.5 | 14.8 |
| 42 | Anson | 4.5 | 10.5 | 15.1 |
| 43 | Hooks | 4.0 | 7.2 | 15.1 |
| 44 | Tioga | 7.7 | 7.7 | 15.5 |
| 45 | Santa Anna | 5.8 | 9.7 | 15.5 |
| 46 | Emory | 2.2 | 13.3 | 15.5 |
| 47 | Granger | 2.6 | 6.5 | 15.7 |
| 48 | Memphis | 6.5 | 6.5 | 16.0 |
| 49 | Sabinal | 3.6 | 12.5 | 16.1 |
| 50 | Itasca | 5.4 | 6.9 | 16.1 |
| 51 | Joshua | 4.8 | 7.3 | 16.1 |
| 52 | Tahoka | 4.6 | 9.1 | 16.6 |
| 53 | Tool | 7.5 | 7.0 | 16.8 |
| 54 | Wolfforth | 4.4 | 9.7 | 16.9 |
| 55 | Ballinger | 4.8 | 9.1 | 16.9 |
| 56 | Childress | 6.7 | 6.1 | 17.2 |
| 57 | Crystal City | 5.5 | 5.6 | 17.3 |
| 58 | Willow Park | 5.7 | 7.4 | 17.4 |
| 59 | Friona | 7.3 | 4.8 | 17.4 |
| 60 | Woodville | 2.9 | 4.8 | 17.4 |
| 61 | Bruceville-Eddy | 10.6 | 7.1 | 17.6 |
| 62 | Lakeview | 5.7 | 7.5 | 17.8 |
| 63 | Olmos Park | 3.6 | 12.5 | 18.2 |
| 64 | Primera | 3.7 | 11.6 | 18.2 |
| 65 | Lone Star | 8.1 | 10.2 | 18.3 |
| 66 | Aubrey | 3.5 | 3.8 | 18.4 |
| 67 | Howe | 4.9 | 7.0 | 18.5 |
| 68 | Overton | 6.7 | 9.3 | 18.7 |
| 69 | Refugio | 3.0 | 9.1 | 18.7 |
| 70 | Hamlin | 7.3 | 5.4 | 18.8 |
| 71 | Big Sandy | 7.2 | 4.3 | 18.8 |
| 72 | Ponder | 4.7 | 7.6 | 18.9 |
| 73 | Lavon | 6.7 | 6.4 | 18.9 |
| 74 | Jarrell | 7.2 | 6.7 | 18.9 |
| 75 | Munday | 3.2 | 15.8 | 18.9 |
| 76 | Shiner | 8.6 | 1.8 | 19.0 |
| 77 | La Vernia | 4.5 | 10.0 | 19.0 |
| 78 | Palm Valley | 0.0 | 19.2 | 19.2 |
| 79 | Terrell Hills | 1.8 | 15.1 | 19.5 |
| 80 | Heath | 5.9 | 5.0 | 19.6 |
| 81 | Elgin | 4.3 | 10.3 | 19.7 |
| 82 | Northeast | 1.3 | 15.7 | 19.9 |
| 83 | Dalworthington Gardens | 5.4 | 10.0 | 20.0 |
| 84 | Granite Shoals | 5.6 | 6.8 | 20.1 |
| 85 | Denver City | 5.5 | 12.8 | 20.1 |
| 86 | Sonora | 5.7 | 6.1 | 20.2 |
| 87 | Whitewright | 4.7 | 15.6 | 20.3 |
| 88 | Alpine | 3.3 | 6.0 | 20.6 |
| 89 | Whitesboro | 6.3 | 7.0 | 20.7 |
| 90 | Bangs | 3.9 | 5.2 | 20.8 |
| 91 | Jones Creek | 10.0 | 6.2 | 20.9 |
| 92 | Bullard | 3.9 | 6.6 | 20.9 |
| 93 | Palmer | 3.7 | 17.3 | 21.0 |
| 94 | Crane | 5.0 | 3.8 | 21.1 |
| 95 | Devine | 4.5 | 11.6 | 21.1 |
| 96 | Waelder | 16.0 | 5.3 | 21.4 |
| 97 | Oak Ridge North | 5.0 | 11.7 | 21.4 |
| 98 | Whitehouse | 6.4 | 8.0 | 21.6 |
| 99 | Graham | 6.3 | 8.0 | 21.9 |
| 100 | Ralls | 6.0 | 7.2 | 22.3 |
| 101 | Diboll | 5.8 | 10.4 | 22.3 |
| 102 | Junction | 5.6 | 4.4 | 22.5 |
| 103 | Brady | 5.3 | 8.3 | 22.9 |
| 104 | Hollywood Park | 3.5 | 10.9 | 22.9 |
| 105 | Nolanville | 7.5 | 11.2 | 23.0 |
| 106 | Southside Place | 3.5 | 9.1 | 23.1 |
| 107 | Bulverde | 5.1 | 15.3 | 23.2 |
| 108 | Spring Valley | 1.2 | 21.0 | 23.5 |
| 109 | Liberty Hill | 10.4 | 7.4 | 23.9 |
| 110 | White Oak | 6.1 | 15.0 | 24.3 |
| 111 | Ingram | 6.9 | 14.8 | 24.4 |
| 112 | Roman Forest | 6.6 | 6.6 | 24.4 |
| 113 | Roanoke | 5.5 | 11.8 | 24.5 |
| 114 | Thorndale | 10.7 | 6.1 | 24.5 |
| 115 | Hickory Creek | 4.7 | 11.6 | 24.5 |
| 116 | Edna | 6.6 | 10.8 | 24.6 |
| 117 | Nixon | 4.9 | 5.3 | 24.7 |
| 118 | Florence | 21.7 | 3.1 | 24.8 |
| 119 | Jacksboro | 8.5 | 7.8 | 25.0 |
| 120 | Abernathy | 6.7 | 12.3 | 25.1 |
| 121 | Shallowater | 2.1 | 15.7 | 25.1 |
| 122 | River Oaks | 6.9 | 14.5 | 25.4 |
| 123 | Waller | 2.0 | 16.7 | 25.4 |
| 124 | Blanco | 7.2 | 8.5 | 25.5 |
| 125 | Keene | 10.3 | 7.0 | 25.5 |
| 126 | Arcola | 1.7 | 22.0 | 25.7 |
| 127 | Huntington | 4.7 | 13.5 | 25.9 |
| 128 | Hallsville | 3.6 | 9.0 | 25.9 |
| 129 | Grand Saline | 7.9 | 10.7 | 26.2 |
| 130 | Hudson | 6.7 | 13.4 | 26.3 |
| 131 | Woodway | 4.8 | 10.1 | 26.3 |
| 132 | Rio Hondo | 6.4 | 6.1 | 26.4 |
| 133 | Moulton | 19.8 | 6.6 | 26.4 |
| 134 | Pelican Bay | 4.8 | 21.6 | 26.4 |
| 135 | Blue Mound | 4.8 | 11.7 | 26.6 |
| 136 | Alamo Heights | 4.4 | 17.8 | 26.7 |
| 137 | Venus | 11.0 | 5.1 | 27.0 |
| 138 | Gregory | 3.7 | 9.4 | 27.1 |
| 139 | Flatonia | 6.3 | 16.3 | 27.2 |
| 140 | Bartonville | 2.7 | 11.0 | 27.4 |
| 141 | Laguna Vista | 8.5 | 8.5 | 27.5 |
| 142 | Gunter | 6.4 | 10.6 | 27.6 |
| 143 | Perryton | 8.2 | 12.1 | 27.6 |
| 144 | Naples | 7.7 | 12.3 | 27.6 |
| 145 | Baird | 6.4 | 13.5 | 27.9 |
| 146 | Bishop | 8.5 | 16.3 | 28.0 |
| 147 | Van Alstyne | 6.8 | 10.6 | 28.4 |
| 148 | Haskell | 4.3 | 10.5 | 28.4 |
| 149 | Fulton | 2.3 | 26.2 | 28.5 |
| 150 | Sansom Park Village | 3.2 | 18.8 | 28.7 |
| 151 | Farwell | 5.2 | 10.4 | 28.7 |
| 152 | Alba | 6.4 | 22.3 | 28.7 |
| 153 | Highland Park | 1.8 | 20.8 | 28.8 |
| 154 | Eagle Lake | 7.0 | 13.7 | 28.8 |
| 155 | Cameron | 7.6 | 11.6 | 28.9 |
| 156 | Dublin | 8.2 | 7.6 | 29.1 |
| 157 | Pinehurst | 4.8 | 15.6 | 29.3 |
| 158 | Silsbee | 7.8 | 10.4 | 29.3 |
| 159 | Smithville | 13.6 | 13.6 | 29.4 |
| 160 | Groesbeck | 10.9 | 12.8 | 29.5 |
| 161 | Ganado | 5.8 | 10.5 | 29.7 |
| 162 | Stamford | 6.9 | 15.2 | 29.7 |
| 163 | Bremond | 8.7 | 15.0 | 29.9 |
| 164 | Bayou Vista | 6.4 | 10.9 | 30.0 |
| 165 | Horseshoe Bay | 7.8 | 8.8 | 30.1 |
| 166 | Salado | 6.7 | 18.0 | 30.3 |
| 167 | Grapeland | 5.3 | 10.6 | 30.6 |
| 168 | Seymour | 10.8 | 9.6 | 31.5 |
| 169 | Iowa Colony | 8.9 | 13.8 | 31.6 |
| 170 | Bridge City | 9.0 | 11.3 | 31.7 |
| 171 | Petersburg | 9.4 | 4.7 | 31.8 |
| 172 | Riesel | 5.8 | 11.6 | 31.9 |
| 173 | Bee Cave | 6.4 | 21.5 | 31.9 |
| 174 | Bovina | 6.6 | 5.3 | 31.9 |
| 175 | Josephine | 7.8 | 3.5 | 31.9 |
| 176 | Patton Village | 8.1 | 10.0 | 32.0 |
| 177 | Fairfield | 6.5 | 14.0 | 32.0 |
| 178 | Troy | 5.3 | 16.0 | 32.0 |
| 179 | Dawson | 7.5 | 24.5 | 32.0 |
| 180 | Chillicothe | 14.4 | 18.0 | 32.3 |
| 181 | Combes | 10.3 | 13.2 | 32.4 |
| 182 | Richwood | 8.7 | 17.2 | 32.7 |
| 183 | Dilley | 10.9 | 10.7 | 32.8 |
| 184 | San Diego | 22.3 | 0.0 | 32.9 |
| 185 | Honey Grove | 9.5 | 14.6 | 33.0 |
| 186 | Hughes Springs | 3.9 | 21.6 | 33.2 |
| 187 | Seminole | 14.5 | 10.7 | 33.3 |
| 188 | Linden | 4.4 | 19.9 | 33.6 |
| 189 | Wills Point | 8.7 | 14.1 | 33.7 |
| 190 | Sealy | 7.0 | 18.4 | 33.7 |
| 191 | Spur | 9.9 | 13.9 | 33.8 |
| 192 | Gun Barrel City | 7.2 | 17.5 | 34.0 |
| 193 | Sunrise Beach Village | 8.5 | 14.9 | 34.0 |
| 194 | Rusk | 13.1 | 16.7 | 34.2 |
| 195 | Mineola | 11.0 | 18.1 | 34.3 |
| 196 | Clyde | 16.0 | 17.1 | 34.4 |
| 197 | Freer | 24.2 | 10.6 | 34.7 |
| 198 | Gorman | 7.3 | 7.3 | 34.8 |
| 199 | Lakeside | 4.5 | 19.3 | 34.9 |
| 200 | Farmersville | 8.1 | 13.4 | 35.0 |
| 201 | Westover Hills | 2.2 | 32.8 | 35.0 |
| 202 | Panhandle | 4.1 | 12.9 | 35.1 |
| 203 | West Lake Hills | 6.3 | 24.8 | 35.5 |
| 204 | Los Indios | 1.6 | 19.4 | 35.5 |
| 205 | Sanger | 8.8 | 11.9 | 35.8 |
| 206 | Garrison | 8.9 | 4.5 | 35.8 |
| 207 | La Grulla | 12.6 | 2.1 | 35.8 |
| 208 | La Feria | 4.0 | 18.4 | 35.8 |
| 209 | Lakeport | 7.2 | 4.8 | 36.2 |
| 210 | Reno, Lamar County | 9.6 | 14.7 | 36.3 |
| 211 | Clarksville | 8.8 | 10.3 | 36.4 |
| 212 | Springtown | 11.3 | 20.3 | 36.4 |
| 213 | Weimar | 12.4 | 9.2 | 36.7 |
| 214 | Northlake | 9.6 | 17.4 | 36.8 |
| 215 | Bellville | 10.7 | 9.3 | 36.8 |
| 216 | Winters | 7.6 | 7.1 | 37.0 |
| 217 | Omaha | 4.1 | 12.4 | 37.2 |
| 218 | Penitas | 10.0 | 19.3 | 37.2 |
| 219 | Driscoll | 0.0 | 37.2 | 37.2 |
| 220 | Marfa | 8.7 | 5.5 | 37.3 |
| 221 | Edcouch | 14.2 | 9.8 | 37.3 |
| 222 | Brownsboro | 6.2 | 3.1 | 37.4 |
| 223 | Natalia | 10.2 | 10.9 | 37.5 |
| 224 | Kountze | 7.3 | 14.6 | 37.5 |
| 225 | Canton | 4.9 | 32.7 | 37.6 |
| 226 | Olton | 7.7 | 16.7 | 37.8 |
| 227 | Lindale | 9.1 | 24.4 | 37.9 |
| 228 | Anthony | 7.0 | 17.1 | 38.0 |
| 229 | Lago Vista | 12.5 | 7.7 | 38.2 |
| 230 | Bridgeport | 8.7 | 12.6 | 38.4 |
| 231 | Van | 7.0 | 15.1 | 38.7 |
| 232 | Newton | 4.7 | 16.2 | 38.8 |
| 233 | Fort Stockton | 12.7 | 8.6 | 38.8 |
| 234 | Rogers | 4.9 | 34.3 | 39.2 |
| 235 | Cisco | 8.5 | 12.3 | 39.4 |
| 236 | Magnolia | 9.7 | 10.8 | 39.5 |
| 237 | Taft | 8.3 | 11.7 | 39.6 |
| 238 | Lake Dallas | 9.8 | 14.5 | 40.0 |
| 239 | Kennedale | 11.9 | 15.1 | 40.2 |
| 240 | Brownfield | 11.1 | 13.1 | 40.2 |
| 241 | Floresville | 10.2 | 18.4 | 40.5 |
| 242 | Woodsboro | 8.5 | 6.8 | 40.6 |
| 243 | Jefferson | 8.5 | 9.3 | 40.9 |
| 244 | Wilmer | 10.2 | 22.6 | 40.9 |
| 245 | Madisonville | 13.4 | 5.9 | 41.0 |
| 246 | Mcgregor | 10.7 | 6.5 | 41.1 |
| 247 | Kaufman | 8.2 | 19.7 | 41.2 |
| 248 | Meadows Place | 3.7 | 32.1 | 41.2 |
| 249 | Karnes City | 14.5 | 13.7 | 41.3 |
| 250 | Kirby | 10.2 | 17.9 | 41.4 |
| 251 | Electra | 12.6 | 17.8 | 41.5 |
| 252 | Winnsboro | 10.4 | 18.9 | 42.1 |
| 253 | Thrall | 6.2 | 12.4 | 42.1 |
| 254 | Archer City | 11.8 | 1.4 | 42.3 |
| 255 | Poteet | 11.1 | 21.6 | 42.3 |
| 256 | Splendora | 9.1 | 13.2 | 42.3 |
| 257 | Burnet | 13.3 | 10.8 | 42.8 |
| 258 | San Saba | 10.8 | 18.1 | 42.8 |
| 259 | Mont Belvieu | 8.7 | 25.3 | 42.9 |
| 260 | De Leon | 17.1 | 19.4 | 43.0 |
| 261 | Sweeny | 13.4 | 18.2 | 43.3 |
| 262 | Reno, Parker County | 5.2 | 9.2 | 43.3 |
| 263 | Castroville | 9.0 | 20.8 | 43.7 |
| 264 | Hudson Oaks | 5.6 | 26.2 | 43.7 |
| 265 | Palacios | 5.0 | 20.8 | 44.1 |
| 266 | Port Isabel | 6.1 | 29.3 | 44.1 |
| 267 | Clint | 7.0 | 9.3 | 44.4 |
| 268 | Caddo Mills | 8.3 | 5.2 | 44.5 |
| 269 | Lyford | 16.2 | 11.5 | 44.5 |
| 270 | Jersey Village | 10.6 | 23.1 | 45.0 |
| 271 | Hawkins | 15.5 | 3.9 | 45.1 |
| 272 | Hill Country Village | 5.4 | 23.8 | 45.4 |
| 273 | Dimmitt | 8.2 | 6.0 | 45.8 |
| 274 | Liberty | 7.4 | 22.8 | 46.0 |
| 275 | De Kalb | 5.2 | 19.3 | 46.1 |
| 276 | Coleman | 7.4 | 7.6 | 46.3 |
| 277 | Wink | 8.6 | 22.4 | 46.5 |
| 278 | West Columbia | 12.1 | 16.5 | 46.9 |
| 279 | Quitman | 15.3 | 20.0 | 47.0 |
| 280 | Hamilton | 12.3 | 12.7 | 47.5 |
| 281 | Breckenridge | 16.5 | 18.5 | 47.9 |
| 282 | Ferris | 14.6 | 23.0 | 48.0 |
| 283 | Frankston | 12.9 | 23.3 | 48.2 |
| 284 | Olney | 9.1 | 15.5 | 48.5 |
| 285 | Seagraves | 9.3 | 10.7 | 48.9 |
| 286 | Lytle | 9.0 | 38.0 | 49.0 |
| 287 | Eastland | 11.2 | 21.5 | 49.1 |
| 288 | Dayton | 14.4 | 26.9 | 50.1 |
| 289 | Ranger | 8.5 | 5.0 | 50.2 |
| 290 | Somerville | 12.4 | 23.3 | 50.3 |
| 291 | Idalou | 6.8 | 4.7 | 50.3 |
| 292 | La Joya | 11.4 | 9.6 | 50.7 |
| 293 | Tatum | 2.9 | 38.3 | 50.8 |
| 294 | Beverly Hills | 8.0 | 30.2 | 50.8 |
| 295 | Knox City | 7.6 | 28.1 | 50.8 |
| 296 | Brookshire | 13.9 | 14.7 | 51.1 |
| 297 | Bogata | 7.2 | 24.7 | 51.5 |
| 298 | Teague | 10.5 | 15.3 | 51.6 |
| 299 | Onalaska | 13.3 | 21.4 | 51.9 |
| 300 | Kerens | 10.7 | 9.3 | 52.0 |
| 301 | Wake Village | 8.9 | 14.4 | 52.1 |
| 302 | Pittsburg | 14.0 | 13.6 | 52.1 |
| 303 | Decatur | 11.2 | 34.7 | 52.1 |
| 304 | Kermit | 13.1 | 21.4 | 52.5 |
| 305 | Kemp | 3.9 | 13.8 | 53.2 |
| 306 | Selma | 12.2 | 28.2 | 53.4 |
| 307 | Columbus | 10.8 | 18.4 | 53.7 |
| 308 | Rockdale | 15.7 | 23.8 | 54.2 |
| 309 | Everman | 7.5 | 16.2 | 54.2 |
| 310 | Nassau Bay | 13.5 | 24.3 | 54.5 |
| 311 | Tenaha | 16.9 | 11.7 | 54.6 |
| 312 | Kirbyville | 11.5 | 14.7 | 54.9 |
| 313 | Hondo | 14.2 | 18.3 | 54.9 |
| 314 | Comanche | 12.0 | 24.3 | 54.9 |
| 315 | Monahans | 11.3 | 17.4 | 55.0 |
| 316 | Elsa | 5.4 | 34.9 | 55.2 |
| 317 | Jonestown | 10.9 | 17.5 | 55.2 |
| 318 | Luling | 12.2 | 17.8 | 55.4 |
| 319 | Troup | 13.0 | 20.6 | 55.6 |
| 320 | Windcrest | 5.1 | 44.9 | 55.8 |
| 321 | Hallettsville | 14.8 | 14.8 | 55.8 |
| 322 | Tye | 21.2 | 12.1 | 56.1 |
| 323 | Whitney | 12.8 | 25.1 | 56.2 |
| 324 | Falfurrias | 17.8 | 23.0 | 56.4 |
| 325 | Alvarado | 17.7 | 15.9 | 57.1 |
| 326 | Cactus | 13.5 | 12.5 | 57.3 |
| 327 | Los Fresnos | 8.1 | 15.5 | 57.3 |
| 328 | Hillsboro | 16.4 | 30.9 | 57.3 |
| 329 | Miles | 6.0 | 41.8 | 57.7 |
| 330 | Lampasas | 22.1 | 25.5 | 58.4 |
| 331 | Commerce | 12.8 | 16.6 | 59.1 |
| 332 | Ore City | 15.1 | 22.2 | 59.4 |
| 333 | Calvert | 12.8 | 11.7 | 59.5 |
| 334 | Pineland | 29.9 | 29.9 | 59.8 |
| 335 | Crockett | 12.5 | 19.9 | 59.8 |
| 336 | La Grange | 13.4 | 18.4 | 60.0 |
| 337 | Milford | 8.0 | 12.0 | 60.1 |
| 338 | Floydada | 14.8 | 11.4 | 60.5 |
| 339 | Mathis | 14.5 | 23.5 | 62.5 |
| 340 | Giddings | 11.9 | 20.1 | 62.8 |
| 341 | Three Rivers | 13.6 | 13.6 | 62.9 |
| 342 | Marlin | 10.2 | 15.0 | 63.5 |
| 343 | Crandall | 17.1 | 20.2 | 64.2 |
| 344 | Littlefield | 14.2 | 21.3 | 64.3 |
| 345 | Wallis | 16.5 | 6.6 | 64.4 |
| 346 | Brazoria | 12.7 | 29.6 | 64.6 |
| 347 | Sour Lake | 19.7 | 14.5 | 64.7 |
| 348 | Hutchins | 8.8 | 36.7 | 66.1 |
| 349 | Log Cabin | 13.7 | 15.6 | 66.3 |
| 350 | Lacy-Lakeview | 19.5 | 28.9 | 66.4 |
| 351 | Willis | 19.4 | 23.7 | 67.3 |
| 352 | Cuero | 13.9 | 22.3 | 67.8 |
| 353 | Montgomery | 20.2 | 26.4 | 68.4 |
| 354 | Premont | 13.8 | 24.0 | 69.3 |
| 355 | Merkel | 18.3 | 6.5 | 69.4 |
| 356 | Lorena | 11.7 | 19.7 | 70.0 |
| 357 | Bowie | 14.5 | 28.2 | 70.4 |
| 358 | Daingerfield | 19.1 | 22.0 | 70.8 |
| 359 | West Orange | 7.3 | 40.3 | 70.9 |
| 360 | Bertram | 10.2 | 7.1 | 71.2 |
| 361 | Wharton | 22.1 | 24.6 | 71.8 |
| 362 | Wortham | 11.0 | 22.0 | 72.0 |
| 363 | Surfside Beach | 16.8 | 40.4 | 72.4 |
| 364 | Slaton | 16.3 | 34.5 | 72.7 |
| 365 | Jamaica Beach | 11.0 | 7.3 | 73.3 |
| 366 | Yoakum | 13.3 | 28.5 | 73.4 |
| 367 | Navasota | 19.1 | 27.2 | 74.2 |
| 368 | Port Aransas | 18.1 | 48.1 | 74.4 |
| 369 | Colorado City | 24.0 | 33.9 | 74.9 |
| 370 | Early | 14.5 | 16.4 | 75.7 |
| 371 | Godley | 16.3 | 6.8 | 76.2 |
| 372 | Maud | 13.5 | 18.0 | 76.3 |
| 373 | Hempstead | 11.7 | 20.8 | 77.8 |
| 374 | Marble Falls | 23.3 | 35.6 | 78.0 |
| 375 | Corrigan | 17.4 | 18.7 | 78.5 |
| 376 | Richland Hills | 15.0 | 35.5 | 78.7 |
| 377 | Mexia | 22.8 | 26.1 | 79.1 |
| 378 | Lake Worth | 4.8 | 67.5 | 79.1 |
| 379 | Gilmer | 17.6 | 28.5 | 80.2 |
| 380 | Hearne | 24.6 | 37.9 | 80.3 |
| 381 | Schulenburg | 14.9 | 16.0 | 80.4 |
| 382 | Palmhurst | 13.8 | 62.2 | 83.5 |
| 383 | Cockrell Hill | 16.4 | 22.1 | 83.5 |
| 384 | Dalhart | 17.6 | 32.8 | 84.8 |
| 385 | Pantego | 9.4 | 52.4 | 84.9 |
| 386 | Gladewater | 18.3 | 46.5 | 85.0 |
| 387 | Sullivan City | 14.7 | 14.2 | 85.7 |
| 388 | Nash | 15.3 | 15.3 | 87.0 |
| 389 | Center | 18.2 | 34.3 | 87.1 |
| 390 | Carthage | 27.1 | 28.8 | 87.2 |
| 391 | Jasper | 23.3 | 47.5 | 89.6 |
| 392 | Seven Points | 27.5 | 32.3 | 90.2 |
| 393 | Bastrop | 24.6 | 40.0 | 92.9 |
| 394 | Palmview | 23.8 | 45.6 | 93.3 |
| 395 | Gonzales | 12.5 | 21.9 | 94.8 |
| 396 | Castle Hills | 10.2 | 64.2 | 95.9 |
| 397 | Tulia | 32.9 | 29.7 | 96.5 |
| 398 | Hedwig Village | 10.1 | 76.4 | 97.6 |
| 399 | Atlanta | 17.8 | 28.7 | 97.7 |
| 400 | Queen City | 16.6 | 19.6 | 97.8 |
| 401 | Sudan | 26.5 | 6.6 | 99.6 |
| 402 | Kemah | 22.3 | 50.9 | 100.8 |
| 403 | Oyster Creek | 18.8 | 24.8 | 107.7 |
| 404 | Westworth | 11.4 | 76.1 | 108.8 |
| 405 | Cleveland | 20.5 | 58.7 | 109.4 |
| 406 | Livingston | 33.3 | 58.1 | 112.5 |
| 407 | Sinton | 30.7 | 35.4 | 116.3 |
| 408 | Hawley | 19.5 | 9.7 | 116.9 |
| 409 | Lamesa | 32.8 | 44.2 | 122.2 |
| 410 | Aransas Pass | 29.2 | 48.6 | 123.2 |
| 411 | Kenedy | 20.8 | 40.4 | 125.5 |
| 412 | Shenandoah | 21.8 | 86.1 | 133.9 |
| 413 | New Boston | 18.7 | 45.2 | 141.1 |
| 414 | Balcones Heights | 25.3 | 90.3 | 173.2 |
| 415 | Mustang Ridge | 35.1 | 68.2 | 226.1 |
| 416 | Sunset Valley | 20.5 | 197.7 | 254.8 |
| 417 | South Padre Island | 66.0 | 130.1 | 303.0 |
| 418 | Cuney | 28.6 | 85.7 | 371.4 |
Methodology
AdvisorSmith studied the safest cities in Texas using data published by the FBI in the Uniform Crime Reporting Statistics dataset. This dataset is composed of responses reported by cities and law enforcement agencies in Texas and around the country on Return A. Both property crimes and violent crimes are reported in this dataset, and the crimes reported include murder, rape, robbery, assault, larceny, motor vehicle theft, and burglary.
In conducting this study, we segmented Texas cities into three groups based upon their population size: small, midsize, and large. Small cities were those with 10,000 or fewer residents. Midsize cities had between 10,000 and 100,000 Texas residents, and large cities were those with over 100,000 residents. By sorting cities with similar population sizes, it was easier to provide meaningful comparisons on reported crime rates.
Cities that reported fewer than two months of crime data were excluded from our analysis. Additionally, cities that reported fewer than 12 full months of data were scaled so that their crime statistics would be comparable to cities that reported for the full year. All data in this report represented crimes reported to law enforcement during the calendar year 2019.
AdvisorSmith calculated a crime score for each city in this report. To calculate this score, we applied a multiplier to each type of crime to account for its severity, with more severe crimes such as murder receiving a higher multiplier. We then added the level of weighted crime in each city and divided it by the population of each city to create a crime score for each city. This score encapsulates the level of reported crime in each city relative to the population. We then ranked each city within its population cohort to find the safest cities in Texas.
Sources
- Federal Bureau of Investigation, Uniform Crime Reporting, Return A, 2019