


This study was conducted by dividing cities in North Carolina into three buckets based on population size. Cities with over 50,000 residents were considered large cities, while cities with between 10,000 and 50,000 residents were considered midsize cities. Cities with under 10,000 residents were considered small cities. In total, there were 248 North Carolina cities included in our analysis, with 174 small cities, 57 midsize cities, and 17 large cities.
Continue reading to discover the safest large, midsize, and small cities in North Carolina:
- Safest Large Cities in North Carolina
- Safest Midsize Cities in North Carolina
- Safest Small Cities in North Carolina

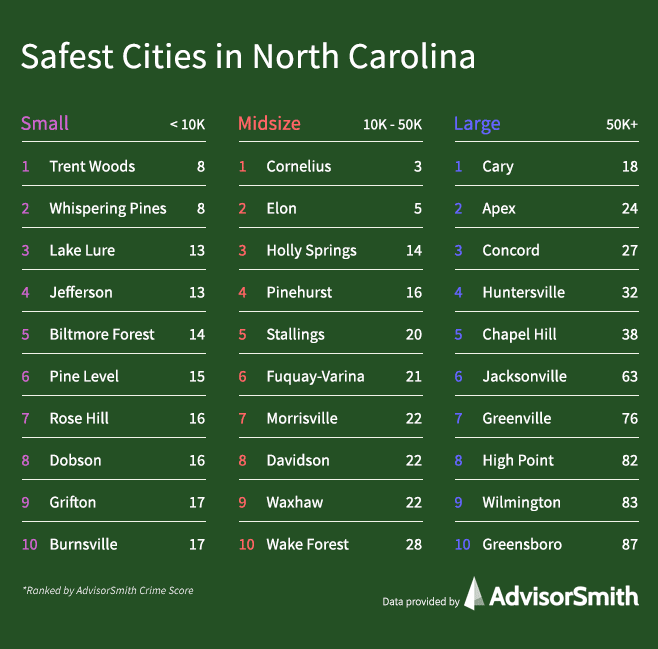
Safest Large Cities in North Carolina
There were 17 large cities in North Carolina in our study with populations over 50,000. The average crime score in large North Carolina cities was 74, and the crime scores ranged from 18 up to 128.
Cary was the safest city in the state and is located in The Triangle region of the state to the west of Raleigh. Cary has a population of approximately 170,000 residents and is a rapidly growing city in the state. Cary is home to numerous companies, including SAS Institute and other technology companies.
Winston-Salem, located near the center of the state, had the highest crime score among large cities in the state. The city is a result of the merger of the towns of Winston and Salem in 1913. The city is host to the headquarters of HanesBrands, Krispy Kreme Doughnuts, and Reynolds American. Wake Forest University is also located in the city.
| Rank | City | Violent Crimes per 1,000 Residents | Property Crimes per 1,000 Residents | Crime Score |
|---|---|---|---|---|
| 1 | Cary | 4.4 | 9.9 | 18.4 |
| 2 | Apex | 6.2 | 12.6 | 23.9 |
| 3 | Concord | 3.7 | 17.9 | 27.3 |
| 4 | Huntersville | 7.8 | 15.3 | 31.6 |
| 5 | Chapel Hill | 7.0 | 14.8 | 37.9 |
| 6 | Jacksonville | 20.2 | 24.6 | 63.2 |
| 7 | Greenville | 20.6 | 29.0 | 76.0 |
| 8 | High Point | 13.2 | 34.4 | 81.5 |
| 9 | Wilmington | 19.3 | 30.1 | 83.2 |
| 10 | Greensboro | 20.5 | 33.5 | 87.4 |
| 11 | Durham | 15.0 | 35.6 | 88.2 |
| 12 | Fayetteville | 21.3 | 31.8 | 91.9 |
| 13 | Charlotte-Mecklenburg | 21.2 | 37.5 | 94.8 |
| 14 | Burlington | 26.4 | 35.6 | 106.6 |
| 15 | Gastonia | 22.4 | 49.7 | 110.1 |
| 16 | Asheville | 26.3 | 51.5 | 112.5 |
| 17 | Winston-Salem | 39.0 | 43.2 | 127.7 |
Safest Midsize Cities in North Carolina
The safest midsize city in North Carolina was Cornelius. This city is located north of the Charlotte metropolitan area on the east shore of Lake Norman. Cornelius boasts 10 public parks, retail and office buildings, and a championship golf course.
Among midsize cities with populations between 10,000 and 50,000 residents in North Carolina, the average crime score was 67, with the range being between 3 and 197. We included a total of 57 midsize cities in our report.
| Rank | City | Violent Crimes per 1,000 Residents | Property Crimes per 1,000 Residents | Crime Score |
|---|---|---|---|---|
| 1 | Cornelius | 0.1 | 0.2 | 3.1 |
| 2 | Elon | 0.2 | 0.7 | 5.2 |
| 3 | Holly Springs | 3.2 | 7.2 | 14.4 |
| 4 | Pinehurst | 3.8 | 6.8 | 15.8 |
| 5 | Stallings | 3.3 | 11.2 | 20.0 |
| 6 | Fuquay-Varina | 2.7 | 6.9 | 21.2 |
| 7 | Morrisville | 4.1 | 12.2 | 21.7 |
| 8 | Davidson | 6.7 | 10.1 | 22.3 |
| 9 | Waxhaw | 5.8 | 11.1 | 22.5 |
| 10 | Wake Forest | 7.2 | 15.2 | 28.3 |
| 11 | Boone | 6.6 | 14.8 | 28.7 |
| 12 | Leland | 8.0 | 15.2 | 31.1 |
| 13 | Clayton | 5.9 | 18.7 | 31.5 |
| 14 | Mount Holly | 7.9 | 18.9 | 35.4 |
| 15 | Mint Hill | 8.1 | 17.2 | 37.3 |
| 16 | Carrboro | 12.8 | 18.6 | 39.7 |
| 17 | Archdale | 6.7 | 21.0 | 40.9 |
| 18 | Knightdale | 11.6 | 17.4 | 44.3 |
| 19 | Sanford | 5.7 | 26.5 | 44.4 |
| 20 | Southern Pines | 10.4 | 21.9 | 46.8 |
| 21 | Kannapolis | 8.0 | 24.6 | 49.7 |
| 22 | Tarboro | 3.4 | 29.5 | 50.4 |
| 23 | Matthews | 11.0 | 28.9 | 50.6 |
| 24 | Havelock | 19.3 | 26.7 | 52.9 |
| 25 | Garner | 8.9 | 31.4 | 53.6 |
| 26 | Mebane | 7.5 | 21.0 | 54.0 |
| 27 | Mooresville | 17.1 | 26.6 | 54.9 |
| 28 | Shelby | 3.5 | 10.8 | 62.3 |
| 29 | Goldsboro | 9.1 | 20.4 | 63.1 |
| 30 | Thomasville | 10.1 | 38.3 | 66.6 |
| 31 | Lincolnton | 20.6 | 24.8 | 66.7 |
| 32 | Smithfield | 13.3 | 36.3 | 69.9 |
| 33 | New Bern | 18.2 | 31.8 | 70.3 |
| 34 | Lexington | 14.7 | 26.1 | 73.0 |
| 35 | Kernersville | 18.4 | 39.6 | 73.3 |
| 36 | Belmont | 14.4 | 44.6 | 76.3 |
| 37 | Wilson | 15.4 | 34.8 | 76.5 |
| 38 | Lenoir | 17.0 | 47.2 | 78.9 |
| 39 | Hendersonville | 10.4 | 44.1 | 79.1 |
| 40 | Newton | 20.1 | 34.5 | 80.5 |
| 41 | Eden | 21.9 | 35.4 | 82.5 |
| 42 | Hickory | 13.9 | 46.4 | 83.8 |
| 43 | Asheboro | 22.5 | 45.1 | 93.0 |
| 44 | Morganton | 17.5 | 32.3 | 93.5 |
| 45 | Lumberton | 17.1 | 49.1 | 98.5 |
| 46 | Hope Mills | 22.0 | 42.0 | 98.8 |
| 47 | Salisbury | 14.6 | 46.6 | 99.6 |
| 48 | Roanoke Rapids | 14.5 | 55.7 | 101.1 |
| 49 | Monroe | 14.7 | 31.5 | 102.1 |
| 50 | Elizabeth City | 21.0 | 53.4 | 104.7 |
| 51 | Albemarle | 20.0 | 53.3 | 115.6 |
| 52 | Rocky Mount | 20.1 | 41.2 | 119.2 |
| 53 | Reidsville | 33.2 | 50.3 | 125.7 |
| 54 | Statesville | 29.8 | 55.1 | 129.8 |
| 55 | Laurinburg | 18.2 | 51.8 | 150.7 |
| 56 | Kinston | 44.5 | 64.2 | 167.9 |
| 57 | Henderson | 44.5 | 54.4 | 196.5 |
Safest Small Cities in North Carolina
In the following table, we list the safest small cities in North Carolina, along with each city’s crime score and the number of property and violent crimes in each city per 1,000 residents. Small cities are those with under 10,000 residents, and we studied 174 small cities in the state.
The average crime score in these cities was 72, with a range from 8 up to 371. The safest small city in North Carolina was Trent Woods, a town of about 4,000 residents located on the north bank of Trent River and a part of the New Bern metropolitan area. The town is a bedroom community that is largely suburban in character.
| Rank | City | Violent Crimes per 1,000 Residents | Property Crimes per 1,000 Residents | Crime Score |
|---|---|---|---|---|
| 1 | Trent Woods | 2.0 | 4.4 | 7.7 |
| 2 | Whispering Pines | 2.7 | 5.1 | 8.5 |
| 3 | Lake Lure | 0.0 | 4.4 | 13.1 |
| 4 | Jefferson | 0.0 | 3.3 | 13.2 |
| 5 | Biltmore Forest | 2.1 | 11.9 | 14.0 |
| 6 | Pine Level | 0.5 | 2.0 | 15.3 |
| 7 | Rose Hill | 0.0 | 7.9 | 15.9 |
| 8 | Dobson | 0.0 | 11.0 | 16.4 |
| 9 | Grifton | 0.8 | 6.8 | 16.5 |
| 10 | Burnsville | 0.0 | 5.5 | 16.6 |
| 11 | Rolesville | 4.5 | 8.3 | 16.7 |
| 12 | Laurel Park | 5.1 | 4.3 | 17.3 |
| 13 | Richlands | 5.2 | 12.2 | 17.5 |
| 14 | Pinetops | 0.0 | 3.2 | 19.1 |
| 15 | Southern Shores | 0.7 | 4.1 | 19.3 |
| 16 | Tryon | 0.0 | 8.1 | 19.4 |
| 17 | Banner Elk | 0.0 | 3.5 | 20.9 |
| 18 | Cape Carteret | 4.3 | 15.5 | 21.6 |
| 19 | Newport | 4.9 | 10.7 | 21.7 |
| 20 | Spruce Pine | 0.5 | 8.5 | 22.5 |
| 21 | Fletcher | 3.5 | 15.3 | 22.8 |
| 22 | Sunset Beach | 1.5 | 12.2 | 25.7 |
| 23 | Black Mountain | 5.2 | 13.2 | 26.0 |
| 24 | Mars Hill | 2.8 | 6.5 | 26.7 |
| 25 | Fair Bluff | 0.0 | 6.7 | 27.0 |
| 26 | Drexel | 4.8 | 17.8 | 27.4 |
| 27 | Spring Hope | 0.8 | 3.8 | 27.6 |
| 28 | Pinebluff | 5.9 | 12.5 | 27.7 |
| 29 | Kenansville | 4.8 | 16.7 | 28.7 |
| 30 | Rockwell | 5.1 | 12.6 | 29.5 |
| 31 | China Grove | 5.0 | 19.0 | 29.9 |
| 32 | Winterville | 8.6 | 9.3 | 30.4 |
| 33 | Wendell | 4.9 | 13.4 | 30.6 |
| 34 | Holly Ridge | 4.6 | 13.9 | 30.8 |
| 35 | Blowing Rock | 5.0 | 17.3 | 31.7 |
| 36 | Belhaven | 5.1 | 2.6 | 32.6 |
| 37 | Bessemer City | 1.5 | 10.9 | 33.1 |
| 38 | Creedmoor | 6.3 | 20.3 | 33.2 |
| 39 | Boiling Spring Lakes | 7.2 | 8.5 | 34.3 |
| 40 | Valdese | 8.8 | 12.2 | 35.2 |
| 41 | Cramerton | 7.0 | 15.4 | 35.4 |
| 42 | Pine Knoll Shores | 7.5 | 15.8 | 36.1 |
| 43 | Murfreesboro | 6.7 | 20.4 | 36.9 |
| 44 | Woodfin | 8.3 | 17.7 | 37.9 |
| 45 | Randleman | 2.7 | 34.1 | 38.0 |
| 46 | Wingate | 9.7 | 16.9 | 38.2 |
| 47 | Stoneville | 3.2 | 3.2 | 38.6 |
| 48 | Windsor | 10.4 | 10.4 | 39.0 |
| 49 | Hudson | 3.5 | 15.7 | 40.0 |
| 50 | Bunn | 5.4 | 8.1 | 40.7 |
| 51 | Rutherfordton | 0.7 | 39.4 | 41.4 |
| 52 | Weaverville | 3.5 | 35.7 | 41.8 |
| 53 | Topsail Beach | 7.0 | 0.0 | 42.1 |
| 54 | Troutman | 14.7 | 21.4 | 43.4 |
| 55 | Youngsville | 8.3 | 21.0 | 44.2 |
| 56 | Manteo | 2.1 | 21.4 | 46.1 |
| 57 | Brevard | 8.0 | 19.1 | 46.1 |
| 58 | Star | 11.7 | 21.1 | 47.2 |
| 59 | Enfield | 6.0 | 16.4 | 47.5 |
| 60 | Angier | 4.2 | 13.6 | 48.7 |
| 61 | Columbus | 11.1 | 38.3 | 49.4 |
| 62 | St. Pauls | 4.7 | 29.0 | 50.8 |
| 63 | Stanley | 7.2 | 33.0 | 51.0 |
| 64 | Robbins | 6.6 | 21.5 | 52.0 |
| 65 | Cleveland | 8.0 | 28.5 | 52.3 |
| 66 | Kitty Hawk | 8.8 | 35.4 | 52.4 |
| 67 | Cherryville | 5.5 | 15.8 | 53.9 |
| 68 | Carolina Beach | 13.1 | 22.7 | 54.2 |
| 69 | Maysville | 7.4 | 13.7 | 56.1 |
| 70 | Bailey | 10.7 | 23.1 | 56.9 |
| 71 | Aberdeen | 15.1 | 29.7 | 57.2 |
| 72 | Gibsonville | 18.6 | 19.2 | 57.7 |
| 73 | Conover | 13.0 | 35.6 | 58.2 |
| 74 | Erwin | 6.0 | 17.2 | 58.7 |
| 75 | Beaufort | 12.0 | 32.3 | 59.4 |
| 76 | Hertford | 9.9 | 16.0 | 59.4 |
| 77 | Troy | 12.2 | 24.7 | 59.5 |
| 78 | Mount Olive | 6.7 | 29.8 | 60.4 |
| 79 | Mocksville | 14.9 | 31.1 | 60.9 |
| 80 | Sugar Mountain | 0.0 | 10.2 | 60.9 |
| 81 | Pilot Mountain | 6.3 | 29.4 | 61.7 |
| 82 | Butner | 17.6 | 22.7 | 62.9 |
| 83 | Oak Island | 17.4 | 21.2 | 63.3 |
| 84 | Madison | 24.5 | 26.9 | 65.1 |
| 85 | Pittsboro | 16.1 | 26.6 | 65.3 |
| 86 | North Wilkesboro | 14.3 | 29.2 | 65.5 |
| 87 | Burgaw | 15.7 | 37.4 | 66.1 |
| 88 | Newland | 1.5 | 13.2 | 66.8 |
| 89 | Lillington | 13.7 | 35.7 | 67.1 |
| 90 | Spencer | 12.3 | 30.4 | 67.3 |
| 91 | Scotland Neck | 8.5 | 22.3 | 67.3 |
| 92 | Chocowinity | 11.4 | 20.2 | 67.3 |
| 93 | Canton | 5.4 | 11.4 | 67.9 |
| 94 | Shallotte | 7.4 | 54.7 | 68.1 |
| 95 | Ayden | 20.9 | 28.9 | 68.8 |
| 96 | Four Oaks | 13.8 | 26.6 | 68.9 |
| 97 | Kings Mountain | 9.8 | 41.3 | 70.2 |
| 98 | Mayodan | 13.3 | 47.1 | 70.5 |
| 99 | Dallas | 4.4 | 16.9 | 72.3 |
| 100 | Fairmont | 9.2 | 26.1 | 72.7 |
| 101 | Raeford | 13.9 | 30.1 | 72.7 |
| 102 | Yadkinville | 19.5 | 31.3 | 72.9 |
| 103 | Swansboro | 14.0 | 38.6 | 73.8 |
| 104 | West Jefferson | 1.6 | 23.3 | 74.6 |
| 105 | Elkin | 10.8 | 56.2 | 75.7 |
| 106 | Granite Falls | 6.7 | 63.0 | 76.1 |
| 107 | Warsaw | 15.5 | 35.1 | 76.2 |
| 108 | Carthage | 24.9 | 32.2 | 77.2 |
| 109 | Franklin | 7.7 | 44.2 | 79.2 |
| 110 | King | 18.4 | 48.4 | 79.5 |
| 111 | Snow Hill | 11.9 | 35.0 | 79.8 |
| 112 | Rowland | 13.9 | 46.5 | 80.2 |
| 113 | Ramseur | 12.4 | 46.2 | 81.7 |
| 114 | Haw River | 4.8 | 15.2 | 81.7 |
| 115 | Morehead City | 19.6 | 42.2 | 83.0 |
| 116 | Farmville | 22.1 | 27.4 | 84.3 |
| 117 | White Lake | 10.5 | 40.7 | 86.6 |
| 118 | East Spencer | 8.4 | 11.0 | 87.7 |
| 119 | Hillsborough | 23.4 | 42.3 | 87.9 |
| 120 | Mount Gilead | 14.7 | 52.6 | 88.0 |
| 121 | Selma | 13.9 | 35.3 | 88.1 |
| 122 | Coats | 7.2 | 7.6 | 88.9 |
| 123 | Maxton | 5.0 | 41.5 | 90.3 |
| 124 | Kill Devil Hills | 25.9 | 48.8 | 90.8 |
| 125 | Dunn | 2.3 | 10.5 | 91.9 |
| 126 | Taylorsville | 6.8 | 15.5 | 92.0 |
| 127 | Clinton | 6.9 | 20.5 | 92.1 |
| 128 | Nags Head | 22.2 | 47.2 | 93.7 |
| 129 | Emerald Isle | 15.5 | 51.3 | 94.4 |
| 130 | Louisburg | 18.0 | 38.6 | 94.7 |
| 131 | Marshville | 29.0 | 42.9 | 95.3 |
| 132 | Marion | 20.2 | 58.6 | 96.0 |
| 133 | Tabor City | 9.0 | 21.5 | 96.0 |
| 134 | Highlands | 23.5 | 57.6 | 97.0 |
| 135 | Waynesville | 15.0 | 51.7 | 98.3 |
| 136 | Claremont | 5.0 | 10.0 | 98.3 |
| 137 | Wrightsville Beach | 23.5 | 39.1 | 100.1 |
| 138 | Zebulon | 23.0 | 45.4 | 101.7 |
| 139 | Weldon | 8.6 | 27.8 | 102.2 |
| 140 | Wilkesboro | 17.8 | 73.2 | 102.5 |
| 141 | North Topsail Beach | 12.4 | 48.4 | 102.9 |
| 142 | Warrenton | 3.6 | 25.1 | 103.8 |
| 143 | Chadbourn | 21.4 | 36.4 | 106.4 |
| 144 | Roxboro | 20.5 | 38.4 | 109.4 |
| 145 | Edenton | 19.5 | 31.0 | 110.0 |
| 146 | Ocean Isle Beach | 4.8 | 72.1 | 110.1 |
| 147 | Surf City | 26.2 | 72.0 | 112.0 |
| 148 | Sylva | 19.7 | 71.0 | 112.6 |
| 149 | Long View | 9.6 | 32.6 | 112.8 |
| 150 | Duck | 18.1 | 82.7 | 113.7 |
| 151 | Beech Mountain | 16.5 | 42.9 | 113.9 |
| 152 | Washington | 27.8 | 40.3 | 115.4 |
| 153 | Oxford | 31.2 | 46.7 | 116.6 |
| 154 | Forest City | 14.8 | 77.4 | 117.2 |
| 155 | Biscoe | 1.2 | 116.4 | 117.6 |
| 156 | Rockingham | 18.4 | 68.8 | 118.2 |
| 157 | Siler City | 26.6 | 44.9 | 119.1 |
| 158 | Ahoskie | 14.8 | 50.5 | 119.7 |
| 159 | Maggie Valley | 16.6 | 50.5 | 120.2 |
| 160 | Bald Head Island | 0.0 | 50.3 | 120.7 |
| 161 | Benson | 46.9 | 40.6 | 121.7 |
| 162 | Andrews | 11.0 | 35.6 | 123.7 |
| 163 | Jonesville | 29.2 | 55.3 | 124.9 |
| 164 | Beulaville | 4.6 | 9.9 | 132.1 |
| 165 | Robersonville | 19.1 | 39.0 | 134.9 |
| 166 | Atlantic Beach | 31.5 | 61.6 | 138.6 |
| 167 | Plymouth | 43.5 | 42.3 | 143.3 |
| 168 | Murphy | 20.1 | 106.7 | 159.8 |
| 169 | Williamston | 39.9 | 63.3 | 162.7 |
| 170 | Whiteville | 28.9 | 87.2 | 172.0 |
| 171 | Pineville | 28.1 | 125.2 | 199.7 |
| 172 | Wadesboro | 54.2 | 45.1 | 202.8 |
| 173 | Indian Beach | 17.1 | 222.2 | 287.2 |
| 174 | Seven Devils | 5.6 | 5.6 | 370.8 |
Methodology
AdvisorSmith used data from the Federal Bureau of Investigation’s Uniform Crime Reporting Data Set, as reported on Return A. This data set collects data from cities and law enforcement agencies around the country on violent and property crimes, including rape, murder, assault, robbery, larceny, motor vehicle theft, and burglary. We studied the crime data from 248 cities in the state of North Carolina to determine the safest cities in the state.
Our analysis divided cities within the state into 3 groups based upon each city’s population. Cities with less than 10,000 residents were considered small cities, while cities with between 10,000 and 50,000 residents were considered midsize cities. Large cities were those with populations of 50,000 or higher.
This study excluded cities that reported less than two months of crime data to the FBI to avoid outlier results from skewing the data. Additionally, for cities in which less than 12 months of crime data was reported, the crime levels were scaled up proportionally to reflect a full year’s worth of crime.
We calculated a crime score for each city by applying a multiplier to more serious crimes such as rape, robbery, murder, and assault. We then added the multiple-weighted crimes together and adjusted the score to reflect the population in each city in order to determine a crime score for each city. We then ranked each city within its population cohort to determine the safest small, midsize, and large cities in the state of North Carolina.
Sources
1. Federal Bureau of Investigation, Uniform Crime Reporting, Return A, 2018