


Using reported crime data provided by the Federal Bureau of Investigation, AdvisorSmith conducted a study of the safest cities in the state of New York. This study examined the reported crime levels in cities across the state and assigned each city a crime score based upon the per capita levels of reported crimes in each city. The composition of crimes also influenced the crime score, with more severe crimes such as murder and rape receiving a higher weight compared with property crimes. The average crime score for cities in New York was 28, and scores ranged from as low as 2 to as high as 405.
Our study examined a total of 373 small, midsize, and large cities in the state of New York. Cities in the state were labeled based upon their population. Cities with under 10,000 residents were labeled small cities. Midsize cities were those with between 10,000 and 50,000 residents, and large cities were those with over 50,000 residents. In total, there were 234 small cities, 119 midsize cities, and 20 large cities included in our study.

The Cost of Crime
For consumers and businesses alike, crime and a lack of safety in a neighborhood can exact a significant toll on daily lives. For the consumer, this can equate to decreases in home values, increases in insurance costs, and more. For businesses, crimes such as shoplifting, robbery, vandalism, theft, and fraud, end up costing U.S. businesses billions of dollars each year. As crime rates increase, so do costs for insurance coverage, including commercial property, commercial crime, and cyber insurance. Studies have shown that the average annual cost of crime prevention for small businesses is over $12,000, while the annual average crime loss is over $14,000.
Safest Large Cities in New York
Among large cities in New York, the average crime score was 55. For cities with over 50,000 residents, crime scores ranged from as low as 12 to as high at 112.
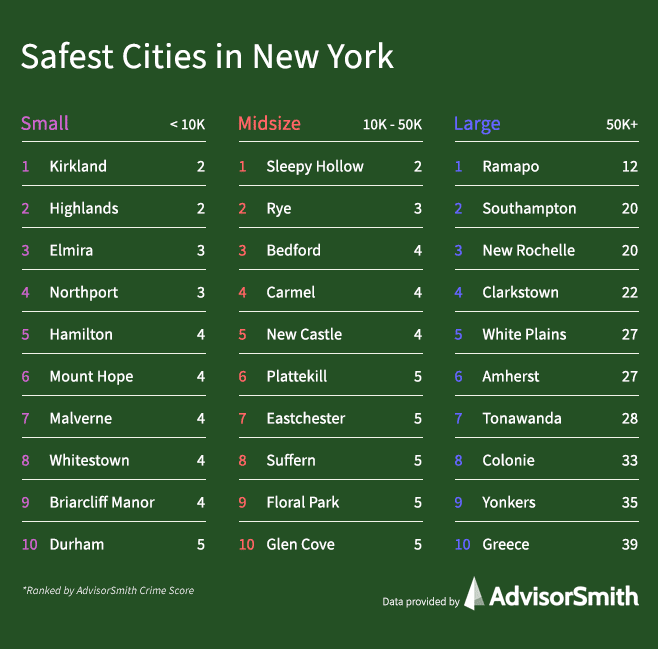
The safest large city in New York was Ramapo, located in Rockland County near the New York-New Jersey border, about 28 miles northwest of New York City. Ramapo is a diverse, dense suburban area, and it was originally developed as a stop on the stagecoach route from New York City to Albany.
Buffalo was the large city in New York State with the highest levels of reported crime. Buffalo is located on the eastern shore of Lake Erie, on the international border of the United States and Canada. Buffalo is the second-largest city in the state and was one of the first cities to widely adopt electric lighting. Historically, the city’s economy was dependent upon manufacturing and trade, and the city has experienced declines in population since the 1950s.
| Rank | City | Violent Crimes per 1,000 Residents | Property Crimes per 1,000 Residents | Crime Score |
|---|---|---|---|---|
| 1 | Ramapo | 3.3 | 4.6 | 12.2 |
| 2 | Southampton | 5.7 | 9.3 | 20.1 |
| 3 | New Rochelle | 4.1 | 9.7 | 20.4 |
| 4 | Clarkstown | 5.8 | 12.2 | 22.1 |
| 5 | White Plains | 4.8 | 14.3 | 26.5 |
| 6 | Amherst | 5.6 | 15.2 | 27.1 |
| 7 | Tonawanda | 7.5 | 12.8 | 28.3 |
| 8 | Colonie | 5.1 | 23.5 | 33.0 |
| 9 | Yonkers | 6.8 | 9.1 | 34.6 |
| 10 | Greece | 10.2 | 19.3 | 39.3 |
| 11 | Hempstead | 10.2 | 10.5 | 48.8 |
| 12 | New York | 5.7 | 14.6 | 50.3 |
| 13 | Cheektowaga | 10.4 | 28.0 | 51.5 |
| 14 | Mount Vernon | 16.5 | 12.5 | 58.4 |
| 15 | Albany | 24.4 | 30.0 | 94.9 |
| 16 | Utica | 30.4 | 33.2 | 97.3 |
| 17 | Schenectady | 33.1 | 27.0 | 104.0 |
| 18 | Syracuse | 29.7 | 31.3 | 104.1 |
| 19 | Rochester | 31.5 | 34.7 | 106.3 |
| 20 | Buffalo | 28.3 | 32.5 | 112.9 |
Safest Midsize Cities in New York
Sleepy Hollow is the safest midsize city in New York, with a crime score of 2. The city is located on the east bank of the Hudson River, about 30 miles north of New York City. The city is known due to The Legend of Sleepy Hollow, a short story written by Washington Irving.
The average crime score for midsize cities in New York State was 33. Crime scores for midsize cities ranged from 2 up to 117. Cities with populations between 10,000 and 50,000 residents were considered midsize cities in this study.
| Rank | City | Violent Crimes per 1,000 Residents | Property Crimes per 1,000 Residents | Crime Score |
|---|---|---|---|---|
| 1 | Sleepy Hollow | 2.0 | 0.0 | 2.0 |
| 2 | Rye | 0.7 | 1.4 | 2.6 |
| 3 | Bedford | 0.3 | 3.2 | 3.8 |
| 4 | Carmel | 0.7 | 2.2 | 4.1 |
| 5 | New Castle | 0.9 | 3.2 | 4.4 |
| 6 | Plattekill | 1.2 | 2.4 | 4.6 |
| 7 | Eastchester | 0.5 | 3.3 | 4.6 |
| 8 | Suffern | 1.4 | 2.5 | 4.6 |
| 9 | Floral Park | 0.7 | 1.6 | 4.8 |
| 10 | Glen Cove | 0.9 | 3.1 | 4.9 |
| 11 | Shawangunk | 1.0 | 3.0 | 5.0 |
| 12 | Kent | 0.6 | 2.2 | 6.2 |
| 13 | Harrison | 1.3 | 5.3 | 6.6 |
| 14 | Hyde Park | 1.8 | 4.0 | 6.8 |
| 15 | Long Beach | 2.2 | 2.0 | 7.0 |
| 16 | Port Washington | 1.3 | 4.7 | 7.6 |
| 17 | Mamaroneck | 0.7 | 6.5 | 8.1 |
| 18 | Dobbs Ferry | 2.5 | 4.0 | 8.3 |
| 19 | Mount Pleasant | 1.9 | 5.0 | 8.4 |
| 20 | East Fishkill | 2.2 | 4.4 | 8.6 |
| 21 | Scarsdale | 0.8 | 6.5 | 9.0 |
| 22 | East Aurora-Aurora | 3.5 | 4.9 | 9.1 |
| 23 | Stony Point | 1.9 | 3.3 | 9.5 |
| 24 | Yorktown | 2.6 | 5.9 | 9.7 |
| 25 | Tarrytown | 1.5 | 5.1 | 9.9 |
| 26 | Blooming Grove | 2.5 | 4.6 | 9.9 |
| 27 | Rockville Centre | 1.5 | 7.1 | 10.6 |
| 28 | Cicero | 3.9 | 6.1 | 11.0 |
| 29 | North Castle | 3.3 | 6.1 | 11.0 |
| 30 | Lynbrook | 2.1 | 5.3 | 11.5 |
| 31 | Lewiston | 4.4 | 5.5 | 11.7 |
| 32 | Fishkill | 1.0 | 8.9 | 11.8 |
| 33 | Port Chester | 1.5 | 6.8 | 12.3 |
| 34 | Webster | 2.5 | 6.9 | 12.9 |
| 35 | Ossining | 2.4 | 6.3 | 13.0 |
| 36 | Schodack | 2.6 | 6.9 | 14.4 |
| 37 | Garden City | 0.6 | 11.9 | 14.5 |
| 38 | Warwick | 6.9 | 4.7 | 16.0 |
| 39 | Ogden | 6.3 | 7.0 | 16.0 |
| 40 | Mamaroneck | 4.1 | 8.2 | 16.6 |
| 41 | Orangetown | 4.7 | 7.1 | 16.9 |
| 42 | Lancaster | 3.7 | 10.6 | 17.6 |
| 43 | Lloyd | 4.6 | 9.5 | 18.2 |
| 44 | Greenburgh | 3.0 | 9.7 | 18.2 |
| 45 | East Hampton | 5.0 | 8.2 | 18.3 |
| 46 | Peekskill | 3.4 | 8.6 | 18.4 |
| 47 | Fallsburg | 6.1 | 8.2 | 18.6 |
| 48 | North Greenbush | 5.0 | 12.8 | 20.0 |
| 49 | Niskayuna | 3.6 | 13.7 | 20.0 |
| 50 | Vestal | 4.7 | 13.1 | 20.5 |
| 51 | Kenmore | 3.8 | 12.7 | 20.5 |
| 52 | Southold | 5.9 | 10.5 | 21.0 |
| 53 | Orchard Park | 4.4 | 11.7 | 21.3 |
| 54 | Manlius | 6.5 | 10.5 | 21.8 |
| 55 | Camillus | 5.9 | 11.5 | 22.0 |
| 56 | Glenville | 4.1 | 14.3 | 22.1 |
| 57 | Freeport | 3.8 | 9.9 | 22.2 |
| 58 | Geddes | 4.5 | 16.1 | 22.6 |
| 59 | Riverhead | 1.1 | 16.9 | 23.4 |
| 60 | Bethlehem | 6.2 | 12.4 | 23.9 |
| 61 | New Windsor | 8.6 | 9.7 | 24.0 |
| 62 | Evans | 6.6 | 10.6 | 24.9 |
| 63 | Fredonia | 4.7 | 19.0 | 25.4 |
| 64 | Fulton | 4.8 | 19.3 | 25.5 |
| 65 | Depew | 6.8 | 12.9 | 26.0 |
| 66 | Hamburg | 5.4 | 16.0 | 26.2 |
| 67 | Brighton | 5.6 | 17.0 | 26.6 |
| 68 | Beacon | 7.7 | 10.3 | 27.7 |
| 69 | Saugerties | 10.5 | 8.6 | 27.9 |
| 70 | Glens Falls | 7.5 | 7.6 | 28.2 |
| 71 | Ulster | 4.6 | 16.5 | 29.0 |
| 72 | North Tonawanda | 10.0 | 11.6 | 30.4 |
| 73 | Irondequoit | 6.6 | 16.7 | 31.0 |
| 74 | West Seneca | 9.3 | 13.2 | 31.4 |
| 75 | Geneva | 2.6 | 18.4 | 31.4 |
| 76 | Guilderland | 3.8 | 24.6 | 32.4 |
| 77 | Wallkill | 7.8 | 19.1 | 33.5 |
| 78 | East Greenbush | 5.8 | 24.5 | 33.6 |
| 79 | Cohoes | 11.9 | 9.2 | 33.8 |
| 80 | Plattsburgh | 10.2 | 12.5 | 34.7 |
| 81 | Oneonta | 9.4 | 10.4 | 34.9 |
| 82 | Amsterdam | 11.5 | 12.4 | 36.1 |
| 83 | Tonawanda | 8.5 | 12.7 | 37.1 |
| 84 | New Hartford | 2.3 | 30.4 | 37.3 |
| 85 | Dunkirk | 11.1 | 17.9 | 38.3 |
| 86 | Rome | 12.6 | 16.4 | 38.5 |
| 87 | Dewitt | 6.6 | 24.3 | 38.6 |
| 88 | Newburgh | 7.2 | 29.3 | 40.2 |
| 89 | Saratoga Springs | 11.2 | 15.9 | 41.2 |
| 90 | Middletown | 11.8 | 11.1 | 41.3 |
| 91 | Rotterdam | 11.4 | 25.3 | 42.5 |
| 92 | Poughkeepsie | 8.6 | 25.5 | 44.6 |
| 93 | Spring Valley | 12.1 | 13.1 | 45.0 |
| 94 | Woodbury | 2.0 | 41.8 | 45.2 |
| 95 | Ithaca | 11.6 | 27.0 | 45.9 |
| 96 | Massena | 18.4 | 24.2 | 48.0 |
| 97 | Gates | 14.3 | 27.4 | 52.9 |
| 98 | Elmira | 8.1 | 30.8 | 54.5 |
| 99 | Kingston | 17.6 | 21.8 | 56.9 |
| 100 | Olean | 18.2 | 23.0 | 60.5 |
| 101 | Corning | 10.8 | 16.2 | 61.2 |
| 102 | Ogdensburg | 19.6 | 28.2 | 66.2 |
| 103 | Lackawanna | 19.4 | 21.3 | 66.2 |
| 104 | Auburn | 23.0 | 29.6 | 67.6 |
| 105 | Batavia | 21.8 | 24.2 | 69.6 |
| 106 | Oswego | 23.5 | 33.8 | 76.0 |
| 107 | Canandaigua | 28.4 | 17.4 | 76.4 |
| 108 | Poughkeepsie | 18.6 | 16.9 | 77.9 |
| 109 | Endicott | 15.4 | 28.1 | 78.2 |
| 110 | Cortland | 41.1 | 17.4 | 79.1 |
| 111 | Oneida | 25.1 | 34.2 | 83.8 |
| 112 | Troy | 27.9 | 27.7 | 87.9 |
| 113 | Gloversville | 39.3 | 27.2 | 95.4 |
| 114 | Johnson | 23.4 | 53.9 | 104.4 |
| 115 | Jamestown | 36.7 | 29.7 | 104.8 |
| 116 | Binghamton | 25.7 | 42.9 | 112.4 |
| 117 | Watertown | 39.0 | 35.3 | 114.1 |
| 118 | Niagara Falls | 30.7 | 38.6 | 117.1 |
| 119 | Newburgh | 34.7 | 22.8 | 117.1 |
Safest Small Cities in New York
The safest small city in New York was Kirkland. Located in Oneida County, Kirkland is host to Hamilton College, a private liberal arts college. The city is located just to the west of the larger city of Utica.
In the table below, rankings and crime scores are listed for 234 small cities with under 10,000 residents in the state of New York. Additionally, the level of violent and property crimes per 1,000 residents is also listed for each city. For small cities in New York, crime scores ranged from 2 to 404, and their average was 24.
| Rank | City | Violent Crimes per 1,000 Residents | Property Crimes per 1,000 Residents | Crime Score |
|---|---|---|---|---|
| 1 | Kirkland | 0.9 | 1.2 | 2.0 |
| 2 | Highlands | 1.1 | 1.2 | 2.3 |
| 3 | Elmira | 2.1 | 0.7 | 2.9 |
| 4 | Northport | 1.4 | 1.9 | 3.3 |
| 5 | Hamilton | 1.8 | 1.8 | 3.5 |
| 6 | Mount Hope | 1.1 | 1.4 | 3.6 |
| 7 | Malverne | 0.4 | 1.8 | 3.9 |
| 8 | Whitestown | 0.5 | 3.7 | 4.2 |
| 9 | Briarcliff Manor | 0.1 | 4.4 | 4.5 |
| 10 | Durham | 0.0 | 4.5 | 4.5 |
| 11 | Cornwall | 1.3 | 1.3 | 5.1 |
| 12 | Cayuga Heights | 0.7 | 4.6 | 5.2 |
| 13 | Stillwater | 1.2 | 2.6 | 5.3 |
| 14 | Shandaken | 1.6 | 3.7 | 5.3 |
| 15 | Waterford | 1.2 | 3.1 | 5.5 |
| 16 | Tuxedo | 4.1 | 1.4 | 5.5 |
| 17 | Montgomery | 1.3 | 4.2 | 5.5 |
| 18 | Coxsackie | 5.2 | 0.6 | 5.8 |
| 19 | Irvington | 0.3 | 5.5 | 5.9 |
| 20 | Somerset | 5.9 | 0.0 | 5.9 |
| 21 | Phelps | 0.0 | 6.3 | 6.3 |
| 22 | Florida | 1.1 | 5.3 | 6.3 |
| 23 | Youngstown | 0.0 | 6.4 | 6.4 |
| 24 | Tuckahoe | 0.8 | 5.7 | 6.5 |
| 25 | Piermont | 4.1 | 2.7 | 6.8 |
| 26 | Norfolk | 2.7 | 1.8 | 6.9 |
| 27 | Marcellus | 0.0 | 7.0 | 7.0 |
| 28 | Sodus | 1.4 | 5.6 | 7.0 |
| 29 | Great Neck Estates | 0.0 | 7.1 | 7.1 |
| 30 | Altamont | 2.4 | 4.8 | 7.1 |
| 31 | Cairo | 1.7 | 4.7 | 7.2 |
| 32 | Bronxville | 0.2 | 7.0 | 7.2 |
| 33 | Oyster Bay Cove | 0.6 | 3.9 | 7.3 |
| 34 | Sherrill | 3.3 | 4.0 | 7.4 |
| 35 | Rye Brook | 0.2 | 7.2 | 7.5 |
| 36 | Caledonia | 7.6 | 0.0 | 7.6 |
| 37 | Elmsford | 1.8 | 2.5 | 7.7 |
| 38 | Goshen | 3.9 | 3.1 | 8.1 |
| 39 | Ardsley | 0.5 | 5.6 | 8.5 |
| 40 | Carroll | 2.3 | 6.2 | 8.5 |
| 41 | Kings Point | 0.9 | 5.4 | 8.6 |
| 42 | Canton | 2.8 | 2.8 | 8.6 |
| 43 | Nissequogue | 0.0 | 8.7 | 8.7 |
| 44 | Chittenango | 2.7 | 4.7 | 8.7 |
| 45 | Brewster | 2.6 | 6.4 | 9.0 |
| 46 | Croton-On-Hudson | 1.5 | 5.3 | 9.0 |
| 47 | Liverpool | 3.6 | 5.4 | 9.1 |
| 48 | Akron | 2.1 | 3.5 | 9.1 |
| 49 | Chester | 2.5 | 6.7 | 9.2 |
| 50 | Moriah | 1.3 | 1.3 | 9.2 |
| 51 | Chester | 2.3 | 0.9 | 9.2 |
| 52 | Highland Falls | 2.1 | 2.1 | 9.4 |
| 53 | Rosendale | 4.1 | 4.5 | 9.4 |
| 54 | Hunter | 1.4 | 5.9 | 9.6 |
| 55 | Friendship | 1.1 | 8.6 | 9.6 |
| 56 | Brant | 4.9 | 4.9 | 9.7 |
| 57 | Huntington Bay | 0.0 | 9.8 | 9.8 |
| 58 | Maybrook | 4.5 | 3.2 | 9.9 |
| 59 | Cornwall-On-Hudson | 3.1 | 5.1 | 10.0 |
| 60 | Westfield | 5.6 | 4.4 | 10.1 |
| 61 | Lloyd Harbor | 1.2 | 2.9 | 10.2 |
| 62 | Homer | 1.3 | 2.6 | 10.3 |
| 63 | Millerton | 2.4 | 8.1 | 10.5 |
| 64 | Lake Success | 3.8 | 6.8 | 10.6 |
| 65 | Eden | 4.1 | 4.7 | 10.6 |
| 66 | Fairport | 3.7 | 4.9 | 10.6 |
| 67 | Alfred | 3.0 | 6.3 | 10.7 |
| 68 | Hastings-On-Hudson | 2.3 | 7.3 | 10.9 |
| 69 | Washingtonville | 5.6 | 4.2 | 10.9 |
| 70 | Weedsport | 0.0 | 10.9 | 10.9 |
| 71 | Chatham | 0.0 | 11.1 | 11.1 |
| 72 | Marlborough | 3.6 | 5.7 | 11.2 |
| 73 | Pound Ridge | 2.1 | 7.2 | 11.2 |
| 74 | Pulaski | 1.3 | 9.9 | 11.2 |
| 75 | Baldwinsville | 5.5 | 5.8 | 11.3 |
| 76 | Crawford | 3.9 | 7.0 | 11.4 |
| 77 | Potsdam | 2.9 | 7.5 | 11.6 |
| 78 | West Carthage | 4.8 | 6.8 | 11.6 |
| 79 | Franklinville | 7.4 | 4.9 | 12.3 |
| 80 | Painted Post | 0.9 | 7.0 | 12.3 |
| 81 | Woodstock | 4.3 | 5.5 | 12.5 |
| 82 | Pelham | 3.2 | 6.5 | 12.6 |
| 83 | Kensington | 0.0 | 12.6 | 12.6 |
| 84 | Waverly | 5.6 | 2.4 | 12.6 |
| 85 | Old Westbury | 1.7 | 9.9 | 12.6 |
| 86 | Pleasantville | 1.7 | 5.2 | 12.7 |
| 87 | Oxford | 4.4 | 8.7 | 13.1 |
| 88 | Camden | 1.0 | 12.1 | 13.1 |
| 89 | Attica | 0.0 | 13.1 | 13.1 |
| 90 | Sherburne | 0.0 | 13.3 | 13.3 |
| 91 | Bolton | 0.0 | 13.3 | 13.3 |
| 92 | Hamburg | 4.5 | 7.8 | 13.4 |
| 93 | Sands Point | 0.3 | 10.0 | 13.4 |
| 94 | New York Mills | 0.3 | 13.2 | 13.6 |
| 95 | Bainbridge | 0.0 | 13.9 | 13.9 |
| 96 | Clayton | 4.1 | 9.8 | 13.9 |
| 97 | Greenwood Lake | 7.4 | 2.7 | 14.1 |
| 98 | Cazenovia | 2.8 | 6.3 | 14.1 |
| 99 | Rhinebeck | 0.5 | 11.0 | 14.1 |
| 100 | Greenport | 1.2 | 13.1 | 14.2 |
| 101 | Geneseo | 0.9 | 10.2 | 14.3 |
| 102 | Black River | 1.6 | 12.8 | 14.4 |
| 103 | Amityville | 5.2 | 7.2 | 14.4 |
| 104 | Webb | 5.6 | 3.4 | 14.5 |
| 105 | Montgomery | 7.2 | 5.9 | 14.7 |
| 106 | Lowville | 6.3 | 4.2 | 15.1 |
| 107 | Frankfort | 4.7 | 5.5 | 15.5 |
| 108 | Cuba | 3.1 | 10.5 | 15.6 |
| 109 | Hornell | 1.6 | 14.1 | 15.7 |
| 110 | Philmont | 6.3 | 9.5 | 15.9 |
| 111 | Buchanan | 2.7 | 4.0 | 16.0 |
| 112 | Cold Spring | 2.0 | 4.1 | 16.4 |
| 113 | Ballston Spa | 8.0 | 5.9 | 16.5 |
| 114 | Arcade | 5.5 | 4.1 | 16.6 |
| 115 | Whitesboro | 3.3 | 5.0 | 16.6 |
| 116 | Macedon | 4.8 | 8.1 | 16.7 |
| 117 | Cambridge | 6.1 | 10.6 | 16.7 |
| 118 | Southampton | 0.9 | 14.4 | 16.8 |
| 119 | Ellicottville | 0.0 | 17.1 | 17.1 |
| 120 | Waterloo | 7.0 | 10.4 | 17.4 |
| 121 | Skaneateles | 1.2 | 16.2 | 17.5 |
| 122 | New Berlin | 5.6 | 11.9 | 17.5 |
| 123 | Walden | 10.8 | 5.4 | 17.7 |
| 124 | Belmont | 4.4 | 13.3 | 17.7 |
| 125 | Nassau | 8.2 | 9.5 | 17.7 |
| 126 | Larchmont | 1.8 | 13.8 | 17.9 |
| 127 | Oriskany | 0.0 | 18.1 | 18.1 |
| 128 | Palmyra | 4.0 | 2.8 | 18.1 |
| 129 | Dolgeville | 7.2 | 6.2 | 18.5 |
| 130 | Addison | 4.9 | 3.5 | 18.7 |
| 131 | Allegany | 2.3 | 10.5 | 18.7 |
| 132 | Groton | 3.1 | 15.8 | 18.9 |
| 133 | Boonville | 1.7 | 9.5 | 18.9 |
| 134 | Granville | 6.8 | 5.4 | 18.9 |
| 135 | Fishkill | 4.6 | 11.6 | 19.1 |
| 136 | Canajoharie | 8.0 | 7.0 | 19.2 |
| 137 | Holley | 6.4 | 6.4 | 19.3 |
| 138 | Greenwich | 7.0 | 12.5 | 19.5 |
| 139 | Moravia | 1.7 | 18.3 | 20.0 |
| 140 | Mohawk | 3.2 | 9.5 | 20.1 |
| 141 | Goshen | 12.9 | 5.4 | 20.2 |
| 142 | Fort Edward | 9.0 | 2.1 | 20.6 |
| 143 | Hoosick Falls | 7.1 | 6.3 | 20.8 |
| 144 | South Nyack | 6.2 | 6.5 | 20.9 |
| 145 | Tupper Lake | 3.0 | 8.9 | 21.3 |
| 146 | Windham | 3.6 | 6.0 | 21.5 |
| 147 | Greene | 0.9 | 20.7 | 21.7 |
| 148 | South Glens Falls | 6.8 | 9.5 | 21.8 |
| 149 | Yorkville | 4.7 | 9.3 | 21.8 |
| 150 | Norwood | 4.4 | 6.6 | 22.1 |
| 151 | East Rochester | 6.9 | 10.6 | 22.1 |
| 152 | Brockport | 8.0 | 7.2 | 22.7 |
| 153 | Middleport | 11.5 | 7.6 | 22.9 |
| 154 | Vernon | 7.8 | 15.6 | 23.4 |
| 155 | Red Hook | 1.5 | 19.4 | 23.5 |
| 156 | Westhampton Beach | 9.4 | 14.4 | 23.7 |
| 157 | Frankfort | 4.9 | 4.9 | 23.8 |
| 158 | Old Brookville | 1.4 | 20.4 | 24.1 |
| 159 | Horseheads | 4.5 | 15.8 | 24.1 |
| 160 | Mechanicville | 8.3 | 7.6 | 24.1 |
| 161 | Saranac Lake | 7.5 | 9.4 | 24.5 |
| 162 | Watkins Glen | 4.2 | 16.8 | 24.5 |
| 163 | Harriman | 5.4 | 12.5 | 24.6 |
| 164 | Phoenix | 8.3 | 7.3 | 25.3 |
| 165 | Dansville | 13.0 | 11.8 | 26.0 |
| 166 | Carthage | 9.9 | 13.5 | 26.1 |
| 167 | Delhi | 4.8 | 7.1 | 26.2 |
| 168 | Deerpark | 11.7 | 6.4 | 26.2 |
| 169 | Ticonderoga | 9.8 | 6.3 | 26.5 |
| 170 | Rensselaer | 9.0 | 9.4 | 27.8 |
| 171 | Trumansburg | 3.1 | 19.2 | 27.9 |
| 172 | Elmira Heights | 4.2 | 19.1 | 28.5 |
| 173 | Monroe | 10.9 | 13.8 | 28.9 |
| 174 | Hammondsport | 0.0 | 29.0 | 29.0 |
| 175 | Dryden | 2.6 | 12.3 | 29.3 |
| 176 | Warsaw | 6.5 | 13.2 | 29.8 |
| 177 | Coeymans | 7.4 | 9.7 | 29.9 |
| 178 | Perry | 10.2 | 10.5 | 29.9 |
| 179 | Lake Placid | 12.2 | 8.0 | 30.0 |
| 180 | Le Roy | 6.6 | 14.1 | 30.2 |
| 181 | Hudson Falls | 12.1 | 6.4 | 30.8 |
| 182 | Penn Yan | 12.4 | 10.4 | 31.2 |
| 183 | Canastota | 13.5 | 7.3 | 31.2 |
| 184 | Colchester | 9.7 | 7.1 | 31.6 |
| 185 | St. Johnsville | 15.5 | 13.1 | 31.6 |
| 186 | Wellsville | 9.2 | 7.3 | 32.3 |
| 187 | Clyde | 9.3 | 14.2 | 32.8 |
| 188 | North Syracuse | 11.9 | 10.5 | 33.0 |
| 189 | Green Island | 12.4 | 13.0 | 33.2 |
| 190 | Independence | 8.8 | 7.0 | 33.4 |
| 191 | Solvay | 12.2 | 10.4 | 34.4 |
| 192 | Blasdell | 10.5 | 14.6 | 34.5 |
| 193 | Scotia | 8.1 | 14.5 | 34.6 |
| 194 | Canisteo | 5.6 | 2.8 | 34.7 |
| 195 | Wolcott | 13.1 | 3.7 | 35.6 |
| 196 | Menands | 6.9 | 23.7 | 35.8 |
| 197 | Bath | 10.3 | 13.4 | 36.2 |
| 198 | Niagara | 7.2 | 26.6 | 36.3 |
| 199 | Central Square | 0.6 | 36.0 | 36.6 |
| 200 | Catskill | 11.6 | 18.7 | 38.2 |
| 201 | Ellenville | 14.3 | 12.6 | 38.2 |
| 202 | Deposit | 4.5 | 22.5 | 38.2 |
| 203 | Medina | 11.4 | 16.0 | 39.4 |
| 204 | Pelham Manor | 6.5 | 26.8 | 39.5 |
| 205 | Inlet | 19.9 | 19.9 | 39.7 |
| 206 | Quogue | 1.2 | 34.3 | 41.4 |
| 207 | East Hampton | 5.3 | 36.1 | 41.5 |
| 208 | Little Falls | 15.9 | 8.4 | 42.2 |
| 209 | Wappingers Falls | 34.7 | 8.7 | 43.3 |
| 210 | Cobleskill | 12.5 | 11.8 | 43.4 |
| 211 | Seneca Falls | 13.1 | 23.7 | 43.4 |
| 212 | Gowanda | 18.3 | 14.5 | 43.9 |
| 213 | Johnstown | 20.2 | 16.8 | 48.9 |
| 214 | Salamanca | 18.8 | 9.9 | 50.7 |
| 215 | Malone | 15.9 | 20.1 | 51.1 |
| 216 | Monticello | 16.6 | 17.7 | 55.1 |
| 217 | Lakewood-Busti | 4.4 | 46.2 | 55.2 |
| 218 | Watervliet | 12.6 | 19.9 | 56.6 |
| 219 | Hancock | 22.0 | 9.2 | 56.9 |
| 220 | Mount Morris | 13.7 | 21.9 | 57.8 |
| 221 | Albion | 22.8 | 25.3 | 64.1 |
| 222 | Ilion | 12.5 | 21.2 | 65.7 |
| 223 | Newark | 25.8 | 25.9 | 68.5 |
| 224 | Port Jervis | 27.3 | 16.1 | 68.9 |
| 225 | Woodridge | 6.9 | 29.2 | 70.4 |
| 226 | Herkimer | 9.1 | 27.6 | 70.8 |
| 227 | Ellicott | 12.4 | 48.1 | 75.0 |
| 228 | Fort Plain | 26.1 | 23.8 | 77.3 |
| 229 | Owego | 21.6 | 29.3 | 81.0 |
| 230 | Sidney | 23.5 | 33.3 | 85.9 |
| 231 | Hudson | 29.6 | 17.5 | 94.0 |
| 232 | Liberty | 23.8 | 29.1 | 95.3 |
| 233 | Norwich | 42.1 | 28.3 | 100.7 |
| 234 | Ocean Beach | 144.6 | 260.2 | 404.8 |
Methodology
AdvisorSmith determined the safest cities in New York by analyzing data from the FBI’s Uniform Crime Reporting Statistics dataset for 2019, which is the most recent data available. This dataset provides reporting on crimes reported to law enforcement agencies in cities across the state of New York. Some of the crimes in the report include rape, robbery, murder, assault, larceny, motor vehicle theft, and burglary.
In this study, we assigned a weight to each type of crime to reflect the severity of the crime. For example, murder receives a higher weight than larceny. We used the number of reported crimes on a weighted basis to calculate the weighted crime rate in each city. We then adjusted the weighted crime rate by the population of each city to find a crime score for each city in New York.
To complete the analysis, we segmented New York cities into three groups based upon their population. Cities with under 10,000 residents were compared as small cities. Cities with between 10,000 and 50,000 residents were considered midsize cities, and large cities were those with over 50,000 residents. We ranked the cities based upon their crime scores within their city size designations to find the safest small, midsize, and large cities in the state of New York.
Sources
- Federal Bureau of Investigation, Uniform Crime Reporting, Return A, 2019