


In this study, AdvisorSmith examined crime data published by the Federal Bureau of Investigation to determine the safest towns and cities in Minnesota. Our analysis was based upon reported levels of property crimes such as burglary, larceny, and vehicle theft, along with violent crimes such as murder, rape, robbery, and assault, which were reported by each city. Crime data was published by the FBI in September 2019, reflecting crime levels in the calendar year 2018. Our analysis found that the average crime score in Minnesota was 37, ranging from as low as 6 to as high as 148.
AdvisorSmith’s study segmented cities and towns in Minnesota by population. Places with under 10,000 residents were labeled towns. Midsize cities contained between 10,000 and 50,000 residents, while large cities had over 50,000 residents. In total, we studied 270 cities and towns in the state, including 181 towns, 70 midsize cities, and 19 large cities.
Read on to find the safest large cities, midsize cities, and small towns in the state of Minnesota:

Safest Large Cities in Minnesota
Minnesota has 19 cities that were classified as large cities with populations exceeding 50,000 residents. Among these large cities, the average crime score was 43, ranging from a low of 14 to a high of 102.
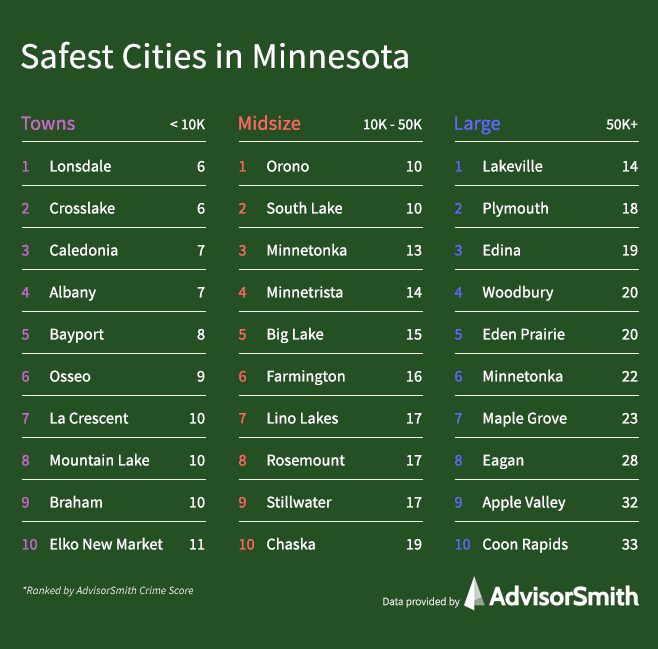
The safest large city in Minnesota was Lakeville, a suburb of Minneapolis with about 67,000 residents. Lakeville is located about 20 miles south of Minneapolis, along highway I-35. The city has numerous recreational opportunities, including 47 parks, bicycle and pedestrian trails, and four golf courses.
Minneapolis, with a score of 102, had the highest crime rate among large cities in our study. The largest city in the state by population, Minneapolis makes up the Twin Cities with its neighboring city, Saint Paul. Minneapolis is situated on both banks of the Mississippi River and is a major financial center. Major corporations headquartered in the city include Target, U.S. Bancorp, and Ameriprise Financial.
| Rank | City | Violent Crimes per 1,000 Residents | Property Crimes per 1,000 Residents | Crime Score |
|---|---|---|---|---|
| 1 | Lakeville | 0.6 | 8.2 | 13.8 |
| 2 | Plymouth | 0.6 | 11.4 | 17.6 |
| 3 | Edina | 0.4 | 15.3 | 19.5 |
| 4 | Woodbury | 0.7 | 13.3 | 19.6 |
| 5 | Eden Prairie | 0.6 | 13.4 | 19.9 |
| 6 | Minnetonka | 0.5 | 15.1 | 21.5 |
| 7 | Maple Grove | 0.6 | 15.4 | 22.8 |
| 8 | Eagan | 0.9 | 19.2 | 28.3 |
| 9 | Apple Valley | 1.2 | 18.1 | 32.2 |
| 10 | Coon Rapids | 1.3 | 21.0 | 33.3 |
| 11 | Blaine | 1.0 | 26.0 | 35.9 |
| 12 | Rochester | 1.9 | 20.8 | 38.7 |
| 13 | Burnsville | 1.9 | 26.2 | 43.7 |
| 14 | Bloomington | 1.9 | 30.0 | 47.6 |
| 15 | Brooklyn Park | 3.7 | 30.3 | 72.6 |
| 16 | Duluth | 3.6 | 42.9 | 80.4 |
| 17 | St. Paul | 6.3 | 32.5 | 82.6 |
| 18 | St. Cloud | 4.8 | 47.2 | 89.6 |
| 19 | Minneapolis | 7.9 | 39.1 | 102.1 |
Safest Midsize Cities in Minnesota
Our study found the safest midsize cities in Minnesota with between 10,000 and 50,000 residents, which are listed below. Among midsize cities, the average crime score was 38, with a range between 10 and 120. In total, we studied 70 midsize cities in Minnesota.
The safest midsize city in Minnesota was Orono, a city located in the western portion of the Minneapolis metropolitan area. Orono’s crime reports are consolidated with nearby Spring Park, Minnetonka Beach, and Mound, due to being served by a single law enforcement agency. The city is situated on the north shore of Lake Minnetonka and besides its lakeside location, also offers the Noerenberg Memorial Gardens, which is one of the top gardens in the state.
| Rank | City | Violent Crimes per 1,000 Residents | Property Crimes per 1,000 Residents | Crime Score |
|---|---|---|---|---|
| 1 | Orono | 0.3 | 5.8 | 10.4 |
| 2 | South Lake Minnetonka | 0.2 | 6.9 | 10.4 |
| 3 | Minnetrista | 0.4 | 8.1 | 12.6 |
| 4 | Big Lake | 1.0 | 4.8 | 14.2 |
| 5 | Farmington | 0.6 | 7.5 | 14.6 |
| 6 | Lino Lakes | 0.6 | 8.4 | 15.6 |
| 7 | Rosemount | 0.6 | 7.6 | 16.5 |
| 8 | Stillwater | 0.9 | 7.8 | 16.6 |
| 9 | Chaska | 0.8 | 8.4 | 16.7 |
| 10 | Champlin | 1.0 | 9.2 | 18.8 |
| 11 | New Ulm | 0.7 | 12.3 | 21.5 |
| 12 | Forest Lake | 0.9 | 11.3 | 21.5 |
| 13 | Grand Rapids | 0.8 | 12.8 | 21.6 |
| 14 | Cottage Grove | 0.7 | 14.7 | 22.0 |
| 15 | Ramsey | 1.0 | 12.9 | 22.5 |
| 16 | Centennial Lakes | 1.0 | 13.4 | 24.0 |
| 17 | Savage | 1.1 | 13.5 | 24.4 |
| 18 | New Hope | 0.7 | 18.7 | 25.6 |
| 19 | Cloquet | 1.0 | 15.2 | 25.7 |
| 20 | North Mankato | 1.4 | 10.4 | 26.0 |
| 21 | Northfield | 1.4 | 10.3 | 26.2 |
| 22 | Sauk Rapids | 0.4 | 20.4 | 26.3 |
| 23 | Rogers | 0.8 | 17.8 | 26.6 |
| 24 | Sartell | 0.7 | 19.3 | 26.6 |
| 25 | Owatonna | 1.0 | 17.0 | 26.8 |
| 26 | St. Peter | 1.2 | 13.2 | 27.3 |
| 27 | Golden Valley | 1.0 | 18.9 | 29.2 |
| 28 | Mendota Heights | 1.4 | 18.2 | 29.4 |
| 29 | Elk River | 1.2 | 17.4 | 29.8 |
| 30 | North St. Paul | 1.2 | 17.5 | 30.0 |
| 31 | Buffalo | 1.0 | 19.4 | 30.3 |
| 32 | Worthington | 2.6 | 8.3 | 33.8 |
| 33 | New Brighton | 1.1 | 24.5 | 34.6 |
| 34 | Prior Lake | 1.5 | 21.3 | 34.7 |
| 35 | Hopkins | 1.7 | 17.7 | 34.7 |
| 36 | Inver Grove Heights | 2.5 | 15.7 | 35.6 |
| 37 | Hastings | 1.8 | 18.1 | 35.8 |
| 38 | Crystal | 1.5 | 20.9 | 35.9 |
| 39 | Shakopee | 1.8 | 19.6 | 36.1 |
| 40 | Hutchinson | 2.0 | 16.4 | 37.2 |
| 41 | North Branch | 1.1 | 23.4 | 37.4 |
| 42 | Oakdale | 1.3 | 23.5 | 37.4 |
| 43 | Anoka | 1.5 | 22.4 | 37.8 |
| 44 | Moorhead | 1.4 | 23.5 | 39.2 |
| 45 | Winona | 1.6 | 22.9 | 39.3 |
| 46 | Hibbing | 2.8 | 11.4 | 39.3 |
| 47 | Marshall | 1.8 | 18.2 | 39.9 |
| 48 | St. Louis Park | 1.5 | 24.8 | 40.2 |
| 49 | White Bear Lake | 1.4 | 27.3 | 40.9 |
| 50 | Richfield | 2.2 | 21.2 | 41.2 |
| 51 | Fairmont | 1.2 | 24.3 | 41.9 |
| 52 | Robbinsdale | 3.3 | 15.9 | 42.8 |
| 53 | Albert Lea | 1.6 | 26.6 | 44.6 |
| 54 | Faribault | 3.2 | 17.8 | 45.8 |
| 55 | South St. Paul | 2.3 | 24.9 | 47.2 |
| 56 | Columbia Heights | 2.7 | 23.9 | 48.3 |
| 57 | Austin | 2.6 | 21.8 | 49.8 |
| 58 | Mounds View | 1.7 | 34.0 | 50.6 |
| 59 | Willmar | 2.8 | 25.4 | 51.7 |
| 60 | Fridley | 3.0 | 36.3 | 63.2 |
| 61 | Fergus Falls | 2.7 | 35.6 | 63.3 |
| 62 | Alexandria | 3.7 | 28.5 | 65.0 |
| 63 | Red Wing | 2.5 | 26.1 | 65.5 |
| 64 | Maplewood | 2.2 | 45.2 | 66.5 |
| 65 | Brooklyn Center | 3.8 | 34.2 | 67.7 |
| 66 | Mankato | 3.3 | 33.6 | 68.3 |
| 67 | Roseville | 2.3 | 49.8 | 68.5 |
| 68 | West St. Paul | 3.7 | 48.5 | 79.6 |
| 69 | Brainerd | 4.6 | 33.8 | 88.6 |
| 70 | Bemidji | 5.1 | 70.5 | 120.1 |
Safest Small Towns in Minnesota
The table below lists the safest small towns in Minnesota with under 10,000 residents. The towns are ranked by their AdvisorSmith crime score, with lower scores indicating lower levels of crime. Additionally, the number of violent and property crimes per 1,000 residents is also listed.
The average crime score among small towns in Minnesota was 36, with the crime levels ranging from as low as 6 to as high as 148. The safest town in Minnesota was Lonsdale, a city of about 4,000 residents located south of the Minneapolis area. The city is host to several golf courses and hiking trails.
| Rank | City | Violent Crimes per 1,000 Residents | Property Crimes per 1,000 Residents | Crime Score |
|---|---|---|---|---|
| 1 | Lonsdale | 0.0 | 2.7 | 5.6 |
| 2 | Crosslake | 0.0 | 3.1 | 6.0 |
| 3 | Caledonia | 0.0 | 1.1 | 6.6 |
| 4 | Albany | 0.0 | 1.1 | 7.4 |
| 5 | Bayport | 0.0 | 4.5 | 7.5 |
| 6 | Osseo | 0.4 | 1.4 | 8.5 |
| 7 | La Crescent | 0.4 | 4.4 | 9.8 |
| 8 | Mountain Lake | 0.0 | 1.9 | 10.0 |
| 9 | Braham | 0.0 | 1.1 | 10.1 |
| 10 | Elko New Market | 0.4 | 4.6 | 10.5 |
| 11 | Glenwood | 0.4 | 4.8 | 11.3 |
| 12 | Breezy Point | 0.4 | 2.5 | 11.5 |
| 13 | Benson | 0.3 | 0.0 | 11.7 |
| 14 | Two Harbors | 0.6 | 2.9 | 11.9 |
| 15 | Cold Spring/Richmond | 0.4 | 6.6 | 11.9 |
| 16 | Le Center | 0.0 | 7.7 | 13.2 |
| 17 | Dayton | 0.3 | 9.5 | 13.2 |
| 18 | Melrose | 0.6 | 6.9 | 13.3 |
| 19 | West Hennepin | 0.9 | 7.6 | 14.0 |
| 20 | Medina | 0.3 | 11.0 | 14.3 |
| 21 | Tri-City | 0.0 | 2.9 | 14.7 |
| 22 | Battle Lake | 0.0 | 5.4 | 15.1 |
| 23 | Avon | 0.0 | 6.4 | 15.3 |
| 24 | Hawley | 0.9 | 0.9 | 15.4 |
| 25 | St. Joseph | 0.6 | 9.6 | 15.7 |
| 26 | Corcoran | 0.7 | 8.7 | 15.9 |
| 27 | Le Sueur | 0.5 | 7.2 | 16.0 |
| 28 | Jordan | 0.6 | 7.1 | 16.0 |
| 29 | Deephaven | 0.3 | 11.4 | 16.0 |
| 30 | Henning | 0.0 | 6.2 | 16.6 |
| 31 | Keewatin | 0.0 | 9.8 | 16.8 |
| 32 | Lakefield | 0.0 | 7.4 | 17.0 |
| 33 | Pike Bay | 0.0 | 3.6 | 17.0 |
| 34 | Wyoming | 1.1 | 8.0 | 17.1 |
| 35 | Eagle Lake | 0.6 | 6.7 | 17.3 |
| 36 | Howard Lake | 0.5 | 1.0 | 17.4 |
| 37 | Nisswa | 0.5 | 0.5 | 17.6 |
| 38 | Kasson | 0.2 | 1.2 | 17.7 |
| 39 | Rice | 0.0 | 5.2 | 17.7 |
| 40 | Arlington | 0.0 | 7.9 | 17.7 |
| 41 | Lake City | 0.2 | 13.6 | 17.9 |
| 42 | Pelican Rapids | 1.2 | 2.0 | 18.0 |
| 43 | Minnesota Lake | 0.0 | 0.0 | 18.7 |
| 44 | East Grand Forks | 0.8 | 10.1 | 18.8 |
| 45 | Lester Prairie | 1.2 | 5.8 | 18.9 |
| 46 | Blooming Prairie | 1.0 | 1.0 | 19.0 |
| 47 | Brownton | 0.0 | 5.5 | 19.3 |
| 48 | Montgomery | 0.3 | 9.2 | 19.3 |
| 49 | Dundas | 0.6 | 11.7 | 19.4 |
| 50 | Winsted | 0.9 | 10.1 | 20.1 |
| 51 | Madison Lake | 0.0 | 0.8 | 20.3 |
| 52 | Belle Plaine | 0.7 | 10.6 | 20.4 |
| 53 | Warroad | 1.1 | 6.3 | 21.2 |
| 54 | Tracy | 1.0 | 3.9 | 21.2 |
| 55 | Montevideo | 0.8 | 12.2 | 22.0 |
| 56 | Lewiston | 0.6 | 4.5 | 22.0 |
| 57 | Ely | 0.9 | 9.8 | 22.2 |
| 58 | Zumbrota | 0.6 | 13.7 | 22.6 |
| 59 | Lake Crystal | 0.0 | 12.1 | 22.7 |
| 60 | Chisholm | 0.8 | 9.8 | 23.0 |
| 61 | Elmore | 0.0 | 4.8 | 23.3 |
| 62 | International Falls | 1.3 | 9.8 | 23.4 |
| 63 | Canby | 0.6 | 2.4 | 23.7 |
| 64 | Menahga | 0.0 | 4.6 | 23.7 |
| 65 | Blue Earth | 0.6 | 11.6 | 23.8 |
| 66 | Perham | 1.7 | 4.6 | 23.8 |
| 67 | Babbitt | 0.7 | 4.0 | 23.8 |
| 68 | Parkers Prairie | 0.0 | 6.0 | 24.0 |
| 69 | Waterville | 1.6 | 9.1 | 24.7 |
| 70 | Hector | 0.0 | 12.4 | 25.0 |
| 71 | Becker | 1.8 | 4.9 | 25.2 |
| 72 | Minneota | 1.5 | 0.7 | 25.2 |
| 73 | Glencoe | 1.1 | 11.9 | 25.4 |
| 74 | Barnesville | 0.4 | 0.0 | 25.5 |
| 75 | Sherburn | 0.9 | 4.6 | 25.7 |
| 76 | Fulda | 0.0 | 6.5 | 26.2 |
| 77 | Preston | 1.5 | 2.3 | 26.3 |
| 78 | Wells | 1.8 | 3.2 | 26.6 |
| 79 | Coleraine | 0.5 | 9.6 | 26.6 |
| 80 | Truman | 0.0 | 5.7 | 26.8 |
| 81 | New York Mills | 0.8 | 0.8 | 27.4 |
| 82 | New Richland | 0.0 | 9.3 | 27.5 |
| 83 | Morris | 1.9 | 9.4 | 27.5 |
| 84 | Lake Shore | 1.0 | 12.4 | 28.0 |
| 85 | Paynesville | 1.6 | 5.6 | 28.8 |
| 86 | Belgrade/Brooten | 1.3 | 7.2 | 28.9 |
| 87 | Tyler | 0.9 | 0.9 | 29.1 |
| 88 | Sleepy Eye | 2.1 | 6.8 | 29.3 |
| 89 | Moose Lake | 1.4 | 15.4 | 29.3 |
| 90 | Litchfield | 1.2 | 12.7 | 29.6 |
| 91 | Isanti | 0.7 | 19.2 | 30.1 |
| 92 | Baxter | 1.1 | 19.1 | 30.6 |
| 93 | Annandale | 0.3 | 25.4 | 31.0 |
| 94 | Mapleton | 1.8 | 8.8 | 31.1 |
| 95 | Goodview | 1.0 | 17.9 | 31.3 |
| 96 | Lake Benton | 0.0 | 4.7 | 31.5 |
| 97 | Wayzata | 0.9 | 19.8 | 31.6 |
| 98 | St. Paul Park | 1.1 | 18.5 | 31.6 |
| 99 | St. Francis | 1.3 | 15.3 | 31.7 |
| 100 | Wabasha | 0.8 | 18.6 | 31.9 |
| 101 | St. Charles | 1.6 | 18.1 | 32.5 |
| 102 | Sauk Centre | 1.8 | 13.9 | 33.3 |
| 103 | Cleveland | 0.0 | 13.9 | 33.5 |
| 104 | Eden Valley | 0.0 | 0.0 | 33.5 |
| 105 | Plainview | 3.0 | 7.9 | 34.0 |
| 106 | Spring Grove | 0.0 | 17.2 | 34.2 |
| 107 | Little Falls | 1.4 | 19.7 | 35.2 |
| 108 | East Range | 1.7 | 14.4 | 35.7 |
| 109 | Cannon Falls | 1.2 | 21.4 | 35.7 |
| 110 | Osakis | 1.3 | 13.5 | 36.0 |
| 111 | Pierz | 1.5 | 21.3 | 36.1 |
| 112 | Dawson/Boyd | 1.3 | 5.2 | 36.2 |
| 113 | Waseca | 1.3 | 21.9 | 36.6 |
| 114 | Wadena | 1.2 | 19.0 | 36.9 |
| 115 | Renville | 1.7 | 7.6 | 37.4 |
| 116 | Foley | 1.5 | 21.3 | 37.6 |
| 117 | Bovey | 1.3 | 0.0 | 38.0 |
| 118 | Madelia | 2.7 | 10.8 | 38.2 |
| 119 | Janesville | 2.7 | 10.2 | 39.0 |
| 120 | Long Prairie | 2.1 | 16.6 | 39.0 |
| 121 | Staples | 1.0 | 22.3 | 39.3 |
| 122 | Ortonville | 1.1 | 15.7 | 39.4 |
| 123 | Lakes Area | 2.1 | 15.5 | 39.8 |
| 124 | Windom | 1.8 | 15.5 | 40.0 |
| 125 | Slayton | 2.0 | 1.0 | 40.4 |
| 126 | Hill City | 0.0 | 23.9 | 41.0 |
| 127 | Nashwauk | 1.1 | 4.2 | 41.3 |
| 128 | Wheaton | 1.5 | 18.4 | 41.4 |
| 129 | Floodwood | 0.0 | 19.2 | 41.5 |
| 130 | Aitkin | 1.0 | 28.0 | 42.0 |
| 131 | Lauderdale | 2.0 | 25.9 | 42.4 |
| 132 | Winnebago | 1.5 | 7.5 | 42.6 |
| 133 | Pequot Lakes | 0.0 | 40.5 | 42.7 |
| 134 | New Prague | 1.1 | 19.4 | 42.8 |
| 135 | Roseau | 3.3 | 7.8 | 42.9 |
| 136 | Eveleth | 1.7 | 27.7 | 43.2 |
| 137 | Trimont | 1.4 | 4.3 | 44.0 |
| 138 | Thief River Falls | 1.8 | 23.4 | 44.0 |
| 139 | St. James | 2.3 | 19.2 | 45.3 |
| 140 | Breckenridge | 2.5 | 21.3 | 45.3 |
| 141 | Deer River | 1.1 | 34.3 | 46.1 |
| 142 | Buffalo Lake | 1.5 | 4.4 | 47.1 |
| 143 | Cambridge | 1.0 | 34.8 | 48.1 |
| 144 | Lake Park | 2.5 | 16.2 | 49.3 |
| 145 | Crookston | 2.4 | 20.4 | 49.6 |
| 146 | Akeley | 0.0 | 36.5 | 49.8 |
| 147 | Proctor | 1.6 | 32.0 | 51.3 |
| 148 | Callaway | 0.0 | 4.3 | 51.7 |
| 149 | Princeton | 1.3 | 35.6 | 51.8 |
| 150 | Detroit Lakes | 2.0 | 29.2 | 52.1 |
| 151 | Oak Park Heights | 1.2 | 39.3 | 53.9 |
| 152 | Appleton | 3.8 | 24.8 | 54.8 |
| 153 | Milaca | 4.5 | 20.1 | 54.9 |
| 154 | Danube | 0.0 | 19.7 | 55.1 |
| 155 | Hermantown | 1.0 | 43.3 | 55.4 |
| 156 | Frazee | 5.0 | 12.9 | 56.5 |
| 157 | Redwood Falls | 3.0 | 32.3 | 58.6 |
| 158 | Crosby | 3.0 | 31.2 | 59.9 |
| 159 | Gaylord | 5.4 | 15.4 | 60.2 |
| 160 | Fairfax | 2.7 | 23.9 | 60.2 |
| 161 | St. Anthony | 3.3 | 36.1 | 62.5 |
| 162 | Dilworth | 1.3 | 46.5 | 64.4 |
| 163 | West Concord | 2.6 | 9.0 | 64.6 |
| 164 | Clearbrook | 1.9 | 20.8 | 65.1 |
| 165 | Motley | 0.0 | 59.7 | 66.9 |
| 166 | Olivia | 1.7 | 24.5 | 68.3 |
| 167 | Granite Falls | 1.6 | 48.4 | 68.5 |
| 168 | Blackduck | 3.9 | 13.0 | 70.3 |
| 169 | Gilbert | 2.8 | 47.9 | 73.5 |
| 170 | Starbuck | 3.2 | 51.4 | 75.4 |
| 171 | Virginia | 4.1 | 34.6 | 76.5 |
| 172 | Silver Lake | 3.7 | 15.9 | 77.4 |
| 173 | Walker | 1.1 | 49.5 | 84.5 |
| 174 | Spring Lake Park | 4.3 | 46.0 | 88.7 |
| 175 | Pine River | 0.0 | 69.2 | 95.1 |
| 176 | Pillager | 0.0 | 60.0 | 96.4 |
| 177 | Isle | 2.5 | 68.7 | 107.4 |
| 178 | Park Rapids | 3.2 | 71.9 | 115.9 |
| 179 | Onamia | 7.0 | 42.0 | 132.2 |
| 180 | Waite Park | 3.9 | 100.1 | 133.8 |
| 181 | Breitung Township | 3.3 | 1.6 | 148.0 |
Methodology
To create this report, we examined crime data published by the Federal Bureau of Investigation. The data set, which is called the Uniform Crime Reporting Data Set, provides reported crime data for cities all over the country. We studied the crime levels in 270 Minnesota cities. For each city, statistics on the number of violent and property crimes such as murder, rape, robbery, assault, burglary, larceny, and motor vehicle theft were provided by the data set.
We segmented the cities in the report based upon their population so that cities with comparable characteristics could be studied. Cities and places with under 10,000 residents were labeled small towns, while cities with between 10,000 and 50,000 residents were labeled midsize cities. Large cities with over 50,000 residents were also considered separately.
This analysis did not include cities where crime data was provided for less than two months. If a city reported less than a full calendar year (12 months) of crime data, we scaled the city’s reported crime so that it would reflect the proportionate amount of crime for the calendar year.
AdvisorSmith calculated a proprietary crime score for each city in Minnesota using the data from the FBI’s data set. This score was calculated by applying a multiplier to various types of crimes to reflect the severity of the crime. For example, murder, being a more serious crime, was multipled by a higher weight than larceny, a less serious crime. We added the weighted number of crimes for each city and ranked the cities within their population categories to determine the safest small towns, midsize cities, and large cities in the state of Minnesota.
Sources
1. Federal Bureau of Investigation, Uniform Crime Reporting, Return A, 2018