


In this study, AdvisorSmith examined crime rates from the FBI’s crime datasets to find the safest cities and towns in the state of Michigan. We based our analysis on the levels of crime reported by cities across the state and adjusted for population. Crime data provided included crimes such as rape, robbery, murder, assault, burglary, larceny, and motor vehicle theft. We calculated a crime score for each city in the state, with the statewide crime score being 49. Crime scores ranged from as low as 3 to as high as 332 in the state.
Our study of the safest cities in Michigan was organized by population size. We studied a total of 419 cities and towns in the state. Our study included 282 small towns with populations under 10,000; 130 midsize cities with populations between 10,000 and 100,000 residents; and seven large cities with over 100,000 residents.
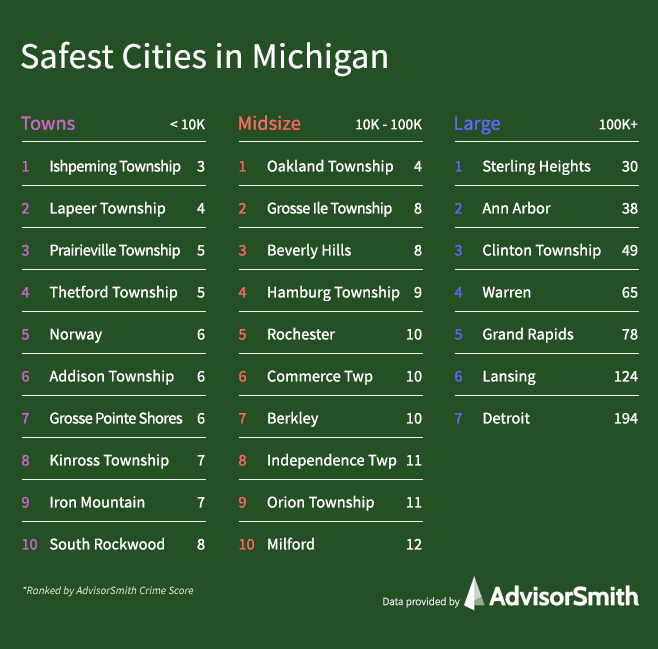
Read on to find the safest large cities, midsize cities, and small towns in the state of Michigan:

Safest Large Cities in Michigan
Seven large cities in Michigan had populations of at least 100,000 residents. Among large cities in the state, the average crime score was 83, and these scores ranged from 30 through 194.
The safest large city in Michigan is Sterling Heights, a core suburb of the Detroit metro area. The city is host to Sterlingfest, which is one of the best-attended festivals in the Detroit area.
Among large cities in the state, Detroit was the city with the highest crime score, with a score of 194. As the most populous city in the state, Detroit is the state’s economic capital and a major shipping port and airport hub. The city is historically linked to the automobile industry, with General Motors, Ford, and Chrysler having historic ties to the city.
| Rank | City | Violent Crimes per 1,000 Residents | Property Crimes per 1,000 Residents | Crime Score |
|---|---|---|---|---|
| 1 | Sterling Heights | 9.1 | 10.0 | 29.5 |
| 2 | Ann Arbor | 8.3 | 15.8 | 37.8 |
| 3 | Clinton Township | 16.1 | 14.1 | 48.5 |
| 4 | Warren | 15.3 | 20.8 | 65.1 |
| 5 | Grand Rapids | 23.5 | 19.1 | 78.2 |
| 6 | Lansing | 28.2 | 31.7 | 124.4 |
| 7 | Detroit | 43.0 | 43.2 | 194.3 |
Safest Midsize Cities in Michigan
Michigan had 130 midsize cities with populations between 10,000 and 100,000 residents in our study. The average crime score for midsize cities in Michigan was 54, with the crime scores ranging from between 4 to 250.
Among midsize cities in Michigan, the safest city was Oakland Township, a northern suburb of the Detroit metropolitan area. This city of approximately 20,000 residents is one of the oldest townships in the state, and it continues to maintain a semi-rural character.
| Rank | City | Violent Crimes per 1,000 Residents | Property Crimes per 1,000 Residents | Crime Score |
|---|---|---|---|---|
| 1 | Oakland Township | 1.5 | 1.5 | 4.3 |
| 2 | Grosse Ile Township | 2.3 | 3.4 | 8.2 |
| 3 | Beverly Hills | 1.4 | 5.5 | 8.3 |
| 4 | Hamburg Township | 2.9 | 3.0 | 8.9 |
| 5 | Rochester | 2.5 | 3.7 | 9.6 |
| 6 | Commerce Township | 2.7 | 5.0 | 9.7 |
| 7 | Berkley | 2.7 | 5.8 | 10.1 |
| 8 | Independence Township | 3.1 | 5.2 | 10.8 |
| 9 | Orion Township | 2.9 | 5.5 | 11.2 |
| 10 | Milford | 3.0 | 4.0 | 11.7 |
| 11 | Oxford Township | 3.8 | 4.3 | 12.1 |
| 12 | Flushing Township | 4.6 | 4.4 | 12.3 |
| 13 | Highland Township | 3.7 | 5.0 | 12.6 |
| 14 | South Lyon | 3.9 | 3.4 | 12.7 |
| 15 | Lyon Township | 3.2 | 5.9 | 13.1 |
| 16 | Springfield Township | 3.7 | 5.1 | 13.2 |
| 17 | Birmingham | 3.7 | 6.4 | 13.4 |
| 18 | Brandon Township | 4.5 | 3.1 | 13.5 |
| 19 | Rochester Hills | 3.6 | 6.0 | 13.7 |
| 20 | Bloomfield Township | 3.1 | 7.8 | 13.8 |
| 21 | West Bloomfield Township | 4.9 | 5.9 | 14.2 |
| 22 | New Baltimore | 6.0 | 4.6 | 14.5 |
| 23 | White Lake Township | 3.8 | 8.5 | 15.0 |
| 24 | Plymouth Township | 3.6 | 6.1 | 15.5 |
| 25 | East Grand Rapids | 2.8 | 10.3 | 16.2 |
| 26 | Novi | 4.5 | 8.8 | 17.5 |
| 27 | Thomas Township | 8.0 | 6.2 | 18.1 |
| 28 | Grosse Pointe Park | 2.4 | 15.8 | 18.2 |
| 29 | Clawson | 6.0 | 5.8 | 18.6 |
| 30 | Royal Oak | 5.2 | 8.1 | 18.7 |
| 31 | Northville Township | 5.3 | 10.5 | 19.9 |
| 32 | Bath Township | 4.1 | 8.2 | 20.5 |
| 33 | Woodhaven | 4.4 | 9.4 | 20.6 |
| 34 | Farmington | 5.0 | 5.5 | 21.0 |
| 35 | Green Oak Township | 4.3 | 7.5 | 21.0 |
| 36 | Farmington Hills | 8.1 | 8.4 | 21.5 |
| 37 | Dewitt Township | 5.3 | 8.4 | 22.2 |
| 38 | Shelby Township | 6.3 | 6.3 | 22.3 |
| 39 | Trenton | 9.1 | 5.7 | 22.4 |
| 40 | Troy | 6.0 | 13.7 | 23.4 |
| 41 | Midland | 6.6 | 8.5 | 23.6 |
| 42 | Riverview | 7.7 | 9.6 | 23.8 |
| 43 | Marquette | 7.0 | 10.0 | 24.6 |
| 44 | Lincoln Township | 7.7 | 12.1 | 25.0 |
| 45 | Grosse Pointe Woods | 6.8 | 14.5 | 26.0 |
| 46 | Chesterfield Township | 7.2 | 13.8 | 28.0 |
| 47 | Canton Township | 9.4 | 10.8 | 28.9 |
| 48 | Grand Blanc Township | 9.2 | 12.3 | 30.0 |
| 49 | Livonia | 7.8 | 14.0 | 30.8 |
| 50 | Wixom | 8.1 | 12.3 | 30.9 |
| 51 | Davison Township | 9.4 | 8.9 | 31.1 |
| 52 | Huron Township | 10.9 | 7.5 | 31.4 |
| 53 | Fraser | 9.1 | 13.6 | 32.2 |
| 54 | Brownstown Township | 10.4 | 8.8 | 32.7 |
| 55 | St. Clair Shores | 10.6 | 10.0 | 32.9 |
| 56 | Pittsfield Township | 7.1 | 14.8 | 35.1 |
| 57 | Waterford Township | 12.0 | 10.3 | 35.6 |
| 58 | Big Rapids | 13.0 | 8.8 | 36.3 |
| 59 | Fenton | 8.0 | 18.4 | 36.5 |
| 60 | Metro Pol Auth Genesee C | 9.9 | 14.3 | 36.6 |
| 61 | East Lansing | 7.7 | 17.2 | 39.5 |
| 62 | Allen Park | 7.8 | 18.5 | 40.2 |
| 63 | Ferndale | 12.9 | 17.0 | 40.8 |
| 64 | Wyandotte | 12.6 | 15.9 | 42.0 |
| 65 | Southgate | 5.1 | 27.2 | 42.1 |
| 66 | Mount Pleasant | 11.1 | 12.6 | 43.0 |
| 67 | Madison Heights | 12.5 | 15.1 | 44.1 |
| 68 | Genesee Township | 11.4 | 12.5 | 44.4 |
| 69 | Garden City | 12.3 | 9.1 | 44.4 |
| 70 | Oak Park | 13.6 | 15.4 | 45.2 |
| 71 | Grand Haven | 17.3 | 15.9 | 46.4 |
| 72 | Saginaw Township | 14.1 | 20.4 | 46.5 |
| 73 | Norton Shores | 10.5 | 28.4 | 48.7 |
| 74 | Meridian Township | 10.2 | 25.3 | 49.6 |
| 75 | Sault Ste. Marie | 19.0 | 16.6 | 50.2 |
| 76 | Walker | 13.1 | 20.8 | 50.9 |
| 77 | Dearborn | 13.2 | 20.0 | 51.4 |
| 78 | Hazel Park | 15.0 | 17.2 | 51.8 |
| 79 | Southfield | 16.5 | 20.7 | 53.4 |
| 80 | Van Buren Township | 16.3 | 19.3 | 53.9 |
| 81 | Portage | 11.8 | 29.4 | 55.4 |
| 82 | Fruitport Township | 10.9 | 38.8 | 55.8 |
| 83 | Ionia | 13.2 | 10.7 | 56.5 |
| 84 | Westland | 18.6 | 15.2 | 58.1 |
| 85 | Dearborn Heights | 19.4 | 16.5 | 59.4 |
| 86 | Kentwood | 18.2 | 21.1 | 59.8 |
| 87 | Grandville | 15.3 | 32.4 | 60.3 |
| 88 | Auburn Hills | 15.1 | 22.6 | 60.4 |
| 89 | Kalamazoo Township | 12.2 | 26.8 | 62.5 |
| 90 | Owosso | 20.8 | 11.7 | 63.2 |
| 91 | Wyoming | 18.1 | 19.6 | 65.4 |
| 92 | Burton | 16.3 | 24.2 | 66.9 |
| 93 | Mount Morris Township | 10.6 | 19.8 | 70.3 |
| 94 | Muskegon Township | 13.2 | 43.7 | 71.4 |
| 95 | Escanaba | 22.3 | 28.2 | 73.0 |
| 96 | Taylor | 17.8 | 22.1 | 73.9 |
| 97 | Traverse City | 28.5 | 16.4 | 74.5 |
| 98 | Blackman Township | 21.6 | 35.9 | 74.9 |
| 99 | Redford Township | 17.9 | 22.3 | 75.5 |
| 100 | Niles | 14.3 | 24.7 | 76.8 |
| 101 | Coldwater | 17.5 | 29.0 | 77.6 |
| 102 | Roseville | 24.2 | 32.2 | 79.2 |
| 103 | Monroe | 25.9 | 19.4 | 79.2 |
| 104 | Hamtramck | 18.4 | 22.8 | 81.0 |
| 105 | Sturgis | 19.4 | 24.4 | 83.2 |
| 106 | Melvindale | 24.4 | 23.6 | 85.4 |
| 107 | Lincoln Park | 27.5 | 28.1 | 85.9 |
| 108 | Wayne | 27.8 | 15.8 | 87.4 |
| 109 | Emmett Township | 13.8 | 52.3 | 87.4 |
| 110 | Adrian | 29.0 | 22.9 | 87.6 |
| 111 | Holland | 28.9 | 27.9 | 90.0 |
| 112 | Bay City | 33.2 | 22.4 | 96.1 |
| 113 | Romulus | 28.6 | 22.9 | 96.9 |
| 114 | Eastpointe | 28.7 | 32.6 | 99.7 |
| 115 | Ypsilanti | 25.3 | 28.7 | 104.0 |
| 116 | Port Huron | 34.1 | 25.9 | 104.7 |
| 117 | Cadillac | 46.3 | 22.0 | 108.7 |
| 118 | Muskegon | 30.8 | 45.1 | 113.5 |
| 119 | Flint Township | 27.1 | 40.2 | 115.5 |
| 120 | Battle Creek | 31.6 | 32.5 | 119.8 |
| 121 | Inkster | 31.9 | 27.1 | 120.2 |
| 122 | Harper Woods | 26.7 | 49.5 | 126.9 |
| 123 | Pontiac | 36.4 | 21.5 | 129.2 |
| 124 | Saginaw | 34.7 | 18.4 | 139.0 |
| 125 | Jackson | 44.9 | 42.5 | 152.8 |
| 126 | Highland Park | 41.2 | 31.9 | 166.5 |
| 127 | Kalamazoo | 44.8 | 50.3 | 168.0 |
| 128 | Flint | 43.5 | 27.0 | 168.1 |
| 129 | Benton Township | 56.0 | 59.7 | 202.1 |
| 130 | Muskegon Heights | 72.6 | 58.9 | 250.5 |
Safest Small Towns in Michigan
We studied 282 small towns in Michigan with under 10,000 residents to find the safest towns in the state, which are listed in the table below. Each town is listed, along with its AdvisorSmith crime score and the number of violent and property crimes per 1,000 residents in the city.
The average crime score in Michigan towns was 45, with a range between 3 and 332. The safest town in Michigan was Ishpeming Township, which is located in the Upper Peninsula of Michigan near Lake Superior.
| Rank | City | Violent Crimes per 1,000 Residents | Property Crimes per 1,000 Residents | Crime Score |
|---|---|---|---|---|
| 1 | Ishpeming Township | 0.6 | 0.9 | 3.4 |
| 2 | Lapeer Township | 1.0 | 2.2 | 3.8 |
| 3 | Prairieville Township | 0.6 | 2.8 | 5.1 |
| 4 | Thetford Township | 0.1 | 0.4 | 5.4 |
| 5 | Norway | 1.8 | 0.0 | 5.5 |
| 6 | Addison Township | 2.9 | 2.3 | 5.9 |
| 7 | Grosse Pointe Shores | 0.4 | 3.2 | 6.1 |
| 8 | Kinross Township | 2.2 | 2.2 | 7.4 |
| 9 | Iron Mountain | 1.9 | 1.2 | 7.4 |
| 10 | South Rockwood | 0.6 | 4.2 | 8.3 |
| 11 | Erie Township | 0.7 | 3.0 | 8.3 |
| 12 | Spring Arbor Township | 1.5 | 1.5 | 8.5 |
| 13 | Argentine Township | 2.5 | 3.4 | 9.5 |
| 14 | Cambridge Township | 3.9 | 4.1 | 10.4 |
| 15 | Raisin Township | 3.8 | 3.4 | 10.5 |
| 16 | Richfield Township | 2.5 | 1.9 | 11.8 |
| 17 | Gaines Township | 5.1 | 4.4 | 12.0 |
| 18 | Springport Township | 4.7 | 3.3 | 12.3 |
| 19 | Rockwood | 3.2 | 3.8 | 12.8 |
| 20 | Williamston | 2.5 | 6.6 | 12.8 |
| 21 | Central Lake | 0.0 | 3.2 | 12.8 |
| 22 | Oxford | 3.4 | 2.2 | 13.1 |
| 23 | Bloomfield Hills | 3.7 | 6.0 | 13.3 |
| 24 | Elk Rapids | 2.5 | 3.1 | 13.4 |
| 25 | Huntington Woods | 1.9 | 5.5 | 13.6 |
| 26 | Metamora Township | 4.2 | 6.1 | 13.8 |
| 27 | Zilwaukee | 3.9 | 6.5 | 13.9 |
| 28 | Shepherd | 3.3 | 7.3 | 14.2 |
| 29 | Chelsea | 3.6 | 7.8 | 14.6 |
| 30 | Otisville | 0.0 | 2.4 | 14.6 |
| 31 | Clayton Township | 4.2 | 4.9 | 14.6 |
| 32 | Somerset Township | 1.1 | 1.5 | 14.9 |
| 33 | Reading | 2.9 | 1.0 | 15.3 |
| 34 | Dewitt | 4.6 | 5.7 | 15.4 |
| 35 | Vernon | 1.3 | 2.6 | 15.5 |
| 36 | Clarkston | 3.2 | 3.2 | 15.6 |
| 37 | Napoleon Township | 7.0 | 5.0 | 15.6 |
| 38 | Ovid | 8.1 | 1.9 | 15.6 |
| 39 | Franklin | 7.3 | 2.8 | 15.9 |
| 40 | Marysville | 3.9 | 7.1 | 16.1 |
| 41 | Linden | 4.4 | 4.6 | 16.2 |
| 42 | Adrian Township | 4.6 | 2.1 | 16.3 |
| 43 | Reese | 4.4 | 5.1 | 16.3 |
| 44 | Dryden Township | 4.6 | 7.0 | 16.4 |
| 45 | Clinton | 5.3 | 5.7 | 16.7 |
| 46 | Marine City | 5.4 | 6.9 | 16.9 |
| 47 | Chocolay Township | 4.7 | 3.5 | 17.0 |
| 48 | Tittabawassee Township | 5.1 | 4.8 | 17.0 |
| 49 | Corunna | 6.8 | 6.3 | 17.6 |
| 50 | Stanton | 2.8 | 9.1 | 17.8 |
| 51 | Grosse Pointe Farms | 4.7 | 9.9 | 18.3 |
| 52 | St. Joseph Township | 5.4 | 9.0 | 18.9 |
| 53 | Plymouth | 4.9 | 8.1 | 19.0 |
| 54 | Rose City | 0.0 | 3.2 | 19.1 |
| 55 | New Buffalo | 11.7 | 5.9 | 19.2 |
| 56 | Tecumseh | 7.3 | 6.7 | 19.6 |
| 57 | Negaunee | 6.1 | 9.0 | 20.2 |
| 58 | Bellevue | 3.1 | 3.1 | 20.2 |
| 59 | Essexville | 12.7 | 4.5 | 20.5 |
| 60 | Pinconning | 0.0 | 13.7 | 20.5 |
| 61 | St. Johns | 5.1 | 5.1 | 20.7 |
| 62 | Grand Blanc | 8.5 | 9.2 | 20.8 |
| 63 | Sumpter Township | 9.7 | 6.7 | 21.1 |
| 64 | Tuscarora Township | 2.7 | 15.4 | 21.2 |
| 65 | Walled Lake | 7.9 | 6.1 | 21.5 |
| 66 | Saline | 5.6 | 8.1 | 21.9 |
| 67 | Lake Odessa | 9.4 | 2.0 | 22.0 |
| 68 | Wolverine Lake | 4.7 | 4.3 | 22.2 |
| 69 | Fennville | 3.5 | 4.9 | 22.2 |
| 70 | Holly | 7.5 | 8.1 | 22.5 |
| 71 | Bellaire | 0.9 | 6.6 | 22.5 |
| 72 | Romeo | 10.2 | 8.6 | 22.6 |
| 73 | Grand Ledge | 5.5 | 10.5 | 23.1 |
| 74 | Deckerville | 1.3 | 2.6 | 23.1 |
| 75 | Leslie | 7.9 | 7.9 | 23.1 |
| 76 | Lathrup Village | 6.3 | 8.0 | 23.5 |
| 77 | Mancelona | 3.7 | 4.4 | 23.5 |
| 78 | Lake Orion | 8.7 | 10.3 | 23.7 |
| 79 | Eau Claire | 3.3 | 6.6 | 23.9 |
| 80 | Orchard Lake | 6.1 | 8.1 | 23.9 |
| 81 | Au Gres | 2.4 | 3.6 | 24.0 |
| 82 | Frankfort | 7.8 | 10.2 | 24.0 |
| 83 | Richland Township | 4.6 | 2.5 | 24.1 |
| 84 | Denton Township | 8.7 | 11.9 | 24.1 |
| 85 | Montrose Township | 9.0 | 6.3 | 24.3 |
| 86 | Pleasant Ridge | 4.0 | 9.3 | 24.8 |
| 87 | Chikaming Township | 7.1 | 10.3 | 24.9 |
| 88 | Gladstone | 11.2 | 9.5 | 25.0 |
| 89 | Schoolcraft | 8.3 | 14.7 | 25.1 |
| 90 | Mayville | 5.6 | 7.9 | 25.5 |
| 91 | Armada | 6.9 | 5.8 | 25.8 |
| 92 | Frankenmuth | 5.9 | 14.2 | 26.3 |
| 93 | Barry Township | 5.8 | 8.9 | 26.8 |
| 94 | Berrien Springs-Oronoko | 6.5 | 9.5 | 26.8 |
| 95 | Richfield Township | 9.0 | 7.0 | 26.8 |
| 96 | Flushing | 4.8 | 12.0 | 26.9 |
| 97 | New Era | 0.0 | 13.6 | 27.1 |
| 98 | Harbor Springs | 7.5 | 6.6 | 27.4 |
| 99 | Clay Township | 11.0 | 7.7 | 27.5 |
| 100 | North Muskegon | 5.0 | 21.3 | 27.7 |
| 101 | Stockbridge | 4.0 | 7.3 | 27.9 |
| 102 | Hancock | 11.7 | 5.7 | 27.9 |
| 103 | Blissfield | 7.4 | 3.7 | 28.0 |
| 104 | Augusta | 3.3 | 17.7 | 28.0 |
| 105 | Rockford | 11.5 | 9.1 | 28.1 |
| 106 | Cassopolis | 5.3 | 4.1 | 28.3 |
| 107.5 | Gerrish Township | 12.0 | 5.5 | 28.8 |
| 107.5 | Perry | 9.6 | 10.1 | 28.8 |
| 109 | Port Austin | 9.6 | 9.6 | 28.9 |
| 110 | Breckenridge | 11.8 | 11.0 | 29.1 |
| 111 | Luna Pier | 7.1 | 7.8 | 29.4 |
| 112 | Tawas | 7.1 | 12.9 | 29.4 |
| 113 | Houghton | 9.0 | 14.8 | 29.7 |
| 114 | Northfield Township | 9.8 | 11.2 | 29.7 |
| 115 | Gibraltar | 12.1 | 7.6 | 29.7 |
| 116 | Kalkaska | 6.8 | 10.2 | 30.0 |
| 117 | Madison Township | 5.2 | 15.1 | 30.2 |
| 118 | Bridgman | 12.6 | 7.6 | 30.5 |
| 119 | Baroda-Lake Township | 10.5 | 6.8 | 30.8 |
| 120 | Kingsford | 8.1 | 6.3 | 31.0 |
| 121 | Unadilla Township | 8.4 | 6.3 | 31.2 |
| 122 | Potterville | 11.6 | 10.8 | 31.4 |
| 123 | Petoskey | 10.6 | 9.2 | 31.6 |
| 124 | Elkton | 6.7 | 12.0 | 32.0 |
| 125 | Brighton | 9.0 | 13.6 | 32.0 |
| 126 | Laurium | 14.0 | 5.2 | 32.3 |
| 127 | Montague | 12.3 | 11.5 | 32.5 |
| 128 | Memphis | 20.1 | 7.1 | 32.7 |
| 129 | Grosse Pointe | 6.4 | 17.5 | 32.8 |
| 130 | Marlette | 7.4 | 9.1 | 32.8 |
| 131 | Carleton | 9.7 | 5.5 | 33.4 |
| 132 | Hartford | 8.5 | 6.6 | 33.5 |
| 133 | Columbia Township | 11.4 | 10.1 | 33.6 |
| 134 | West Branch | 11.2 | 16.1 | 34.1 |
| 135 | Shelby | 11.4 | 13.9 | 34.2 |
| 136 | Keego Harbor | 8.1 | 9.8 | 34.3 |
| 137 | Chesaning | 4.4 | 6.2 | 34.7 |
| 138 | Hampton Township | 11.5 | 10.3 | 34.7 |
| 139 | Morrice | 10.1 | 11.2 | 35.8 |
| 140 | Saugatuck-Douglas | 11.2 | 14.3 | 35.9 |
| 141 | Oscoda Township | 8.6 | 12.8 | 36.2 |
| 142 | Davison | 12.3 | 11.2 | 37.0 |
| 143 | Rogers City | 13.1 | 17.6 | 37.4 |
| 144 | Sebewaing | 4.9 | 6.7 | 37.4 |
| 145 | Sand Lake | 5.6 | 22.6 | 37.6 |
| 146 | Northville | 16.8 | 12.3 | 37.7 |
| 147 | Olivet | 10.0 | 11.2 | 37.8 |
| 148 | Quincy | 11.2 | 17.4 | 37.9 |
| 149 | Imlay City | 14.2 | 11.2 | 38.6 |
| 150 | Clio | 14.1 | 15.3 | 38.9 |
| 151 | Caseville | 6.9 | 13.7 | 39.5 |
| 152 | Colon | 9.5 | 14.7 | 39.6 |
| 153 | Portland | 11.5 | 10.9 | 39.7 |
| 154 | St. Charles | 15.2 | 16.2 | 40.0 |
| 155 | Laingsburg | 7.8 | 10.2 | 40.2 |
| 156 | St. Louis | 14.7 | 8.1 | 40.3 |
| 157 | Sylvan Lake | 9.7 | 17.2 | 40.5 |
| 158 | Litchfield | 12.0 | 8.2 | 40.9 |
| 159 | East Jordan | 16.6 | 16.6 | 41.0 |
| 160 | Caspian-Gaastra | 1.7 | 0.9 | 41.2 |
| 161 | Yale | 8.0 | 8.5 | 42.1 |
| 162 | White Pigeon | 11.2 | 12.5 | 42.3 |
| 163 | Richmond | 19.1 | 6.6 | 42.9 |
| 164 | Allegan | 17.0 | 8.9 | 43.6 |
| 165 | Coleman | 1.7 | 1.7 | 43.6 |
| 166 | St. Ignace | 12.1 | 15.6 | 43.7 |
| 167 | Carrollton Township | 14.6 | 10.0 | 44.1 |
| 168 | Carson City | 8.1 | 11.7 | 44.2 |
| 169 | Marshall | 14.7 | 19.2 | 44.7 |
| 170 | Bad Axe | 17.4 | 27.6 | 45.0 |
| 171 | Ironwood | 32.1 | 10.2 | 45.2 |
| 172 | Sparta | 12.6 | 13.7 | 45.2 |
| 173 | Union City | 8.5 | 27.6 | 45.3 |
| 174 | Hillsdale | 15.3 | 12.7 | 45.3 |
| 175 | Pinckney | 9.7 | 4.0 | 45.5 |
| 176 | Mendon | 8.2 | 11.7 | 45.7 |
| 177 | Coloma Township | 18.5 | 17.1 | 46.0 |
| 178 | Alma | 20.7 | 11.6 | 46.3 |
| 179 | Belleville | 13.5 | 15.0 | 46.7 |
| 180 | Belding | 13.8 | 13.1 | 47.1 |
| 181 | Howell | 16.4 | 11.7 | 47.3 |
| 182 | Flat Rock | 18.7 | 14.4 | 47.4 |
| 183 | Brown City | 14.6 | 17.9 | 47.9 |
| 184 | Iron River | 15.6 | 20.9 | 48.6 |
| 185 | Zeeland | 18.0 | 17.4 | 48.9 |
| 186 | Eaton Rapids | 22.5 | 10.0 | 49.3 |
| 187 | St. Clair | 11.1 | 9.2 | 49.5 |
| 188 | Lawton | 16.2 | 20.6 | 49.8 |
| 189 | Bridgeport Township | 14.3 | 14.1 | 49.9 |
| 190 | Durand | 16.7 | 17.0 | 51.0 |
| 191 | Barryton | 5.7 | 2.8 | 51.0 |
| 192 | Vicksburg | 16.6 | 15.4 | 51.4 |
| 193 | Pentwater | 2.4 | 17.7 | 51.8 |
| 194 | Fowlerville | 15.6 | 18.3 | 52.2 |
| 195 | Mason | 17.1 | 17.0 | 52.3 |
| 196 | Ishpeming | 23.4 | 12.0 | 52.6 |
| 197 | Lakeview | 8.0 | 31.8 | 53.2 |
| 198 | Grand Beach | 7.1 | 10.6 | 53.2 |
| 199 | Lowell | 17.2 | 20.5 | 53.6 |
| 200 | Forsyth Township | 17.9 | 7.7 | 53.9 |
| 201 | Milan | 18.9 | 17.9 | 55.5 |
| 202 | Boyne City | 12.0 | 23.8 | 55.6 |
| 203 | St. Joseph | 16.3 | 22.1 | 56.3 |
| 204 | Watervliet | 20.5 | 7.2 | 56.6 |
| 205 | Whitehall | 20.4 | 17.1 | 56.9 |
| 206 | Munising | 17.4 | 21.0 | 57.6 |
| 207 | Lake Linden | 3.1 | 1.0 | 57.8 |
| 208 | Vassar | 13.8 | 7.1 | 58.6 |
| 209 | Utica | 9.7 | 35.6 | 58.8 |
| 210 | Mattawan | 21.8 | 22.3 | 58.9 |
| 211 | Reed City | 20.6 | 9.7 | 59.7 |
| 212 | Menominee | 22.0 | 16.7 | 59.8 |
| 213 | Ludington | 16.9 | 13.5 | 60.4 |
| 214 | Manistique | 24.1 | 20.0 | 60.5 |
| 215 | Hastings | 22.0 | 22.4 | 60.7 |
| 216 | Charlotte | 17.6 | 26.4 | 60.8 |
| 217 | Plainwell | 21.5 | 17.1 | 61.4 |
| 218 | Center Line | 14.3 | 20.9 | 61.6 |
| 219 | Ontwa Twp-Edwardsburg | 18.8 | 19.1 | 62.1 |
| 220 | Hudson | 22.1 | 18.5 | 62.1 |
| 221 | Harbor Beach | 22.0 | 18.9 | 62.2 |
| 222 | Capac | 16.4 | 10.4 | 62.3 |
| 223 | Otsego | 17.3 | 13.3 | 62.5 |
| 224 | Morenci | 18.5 | 20.8 | 62.5 |
| 225 | Lexington | 8.1 | 6.3 | 63.2 |
| 226 | Caro | 22.5 | 19.5 | 63.4 |
| 227 | Dowagiac | 14.5 | 11.3 | 63.4 |
| 228 | Fremont | 16.0 | 37.9 | 63.6 |
| 229 | Crystal Falls | 10.3 | 24.2 | 64.5 |
| 230 | Cheboygan | 16.8 | 26.7 | 65.5 |
| 231 | Alpena | 20.2 | 19.5 | 65.7 |
| 232 | Wayland | 18.5 | 15.0 | 66.0 |
| 233 | Ubly | 13.8 | 13.8 | 66.4 |
| 234 | Almont | 15.2 | 13.5 | 66.7 |
| 235 | Charlevoix | 19.3 | 14.9 | 67.4 |
| 236 | Bronson | 19.6 | 29.2 | 67.5 |
| 237 | Elsie | 1.0 | 1.0 | 67.6 |
| 238 | Richland | 9.9 | 18.6 | 67.7 |
| 239 | Clare | 23.1 | 17.1 | 68.6 |
| 240 | Millington | 10.0 | 9.0 | 69.0 |
| 241 | Sandusky | 20.7 | 27.8 | 69.2 |
| 242 | Croswell | 22.9 | 12.8 | 70.6 |
| 243 | River Rouge | 16.2 | 23.0 | 70.7 |
| 244 | Beaverton | 14.3 | 9.6 | 70.9 |
| 245 | Buchanan | 28.2 | 21.2 | 72.4 |
| 246 | Jonesville | 12.7 | 41.3 | 73.4 |
| 247 | Grant | 13.6 | 27.2 | 73.7 |
| 248 | Cass City | 26.3 | 21.5 | 74.5 |
| 249 | Manistee | 26.8 | 19.4 | 75.0 |
| 250 | Covert Township | 27.0 | 13.0 | 75.1 |
| 251 | Scottville | 26.3 | 44.3 | 78.8 |
| 252 | Gladwin | 24.4 | 23.0 | 79.7 |
| 253 | Lapeer | 23.6 | 30.6 | 81.4 |
| 254 | Evart | 25.3 | 17.7 | 81.7 |
| 255 | Nashville | 21.1 | 15.1 | 82.5 |
| 256 | Birch Run | 10.9 | 58.7 | 83.3 |
| 257 | Calumet | 33.1 | 25.9 | 85.0 |
| 258 | Lennon | 4.9 | 19.6 | 88.0 |
| 259 | Rothbury | 18.0 | 15.7 | 89.9 |
| 260 | White Cloud | 28.3 | 31.2 | 90.8 |
| 261 | Greenville | 25.0 | 33.4 | 92.3 |
| 262 | Constantine | 25.7 | 17.1 | 96.1 |
| 263 | Michiana | 0.0 | 49.7 | 99.4 |
| 264 | Roosevelt Park | 7.1 | 88.6 | 100.7 |
| 265 | Mount Morris | 27.6 | 23.1 | 102.4 |
| 266 | Newaygo | 44.5 | 33.8 | 103.3 |
| 267 | Three Rivers | 24.8 | 39.2 | 107.9 |
| 268 | Paw Paw | 37.0 | 54.3 | 112.2 |
| 269 | Buena Vista Township | 35.5 | 18.2 | 112.3 |
| 270 | Akron | 21.4 | 10.7 | 119.2 |
| 271 | Ecorse | 34.2 | 32.0 | 121.1 |
| 272 | Grayling | 44.1 | 34.8 | 121.4 |
| 273 | Albion | 40.5 | 37.1 | 123.4 |
| 274 | Bangor | 51.3 | 28.9 | 125.6 |
| 275 | South Haven | 33.9 | 63.6 | 131.7 |
| 276 | Decatur | 48.4 | 26.5 | 134.1 |
| 277 | Lansing Township | 21.2 | 65.4 | 135.9 |
| 278 | Gaylord | 28.7 | 70.7 | 139.2 |
| 279 | Hart | 66.6 | 69.5 | 168.5 |
| 280 | Mackinaw City | 62.7 | 47.1 | 203.2 |
| 281 | Benton Harbor | 64.3 | 42.8 | 227.0 |
| 282 | Mackinac Island | 47.1 | 207.7 | 331.7 |
Methodology
AdvisorSmith used crime reports published by the FBI on Return A in the Uniform Crime Reporting Data Set to determine the safest cities in the state of Michigan. This data set reports crimes from cities around the United States. In this study, we investigated crime levels in 419 cities in the state of Michigan. This data set includes data on the number of violent crimes such as murder, rape, robbery, and assault, as well as property crimes such as burglary, larceny, and motor vehicle theft in cities across the state of Michigan.
Our study analyzed and compared crime rates in cities based upon their population size. As larger cities tend to have higher rates of crime in general, segmentation by population is a way to compare cities with similar characteristics. We segmented cities into three categories based upon their population: small towns had up to 10,000 residents, while midsize cities had between 10,000 and 100,000 residents. Large cities had 100,000 or more residents.
Cities with less than two months of crime data available were not included in our analysis. Cities with less than 12 full months of crime data had their existing crime data scaled proportionately to represent a full calendar year’s worth of crime.
For each city, we calculated a proprietary crime score that reflects the level of crime in the city. To calculate the score, we assigned a multiplier to more serious types of crimes such as murder, rape, robbery, and assault, which reflect their higher severity. We then added these crimes to the number of property crimes in the city to calculate a crime score on a per-capita basis. We ranked the cities and towns within their categories to find the safest small, midsize, and large cities in the state of Michigan.
Sources
1. Federal Bureau of Investigation, Uniform Crime Reporting, Return A, 2018