


AdvisorSmith studied levels of reported crimes in cities across the state of Massachusetts to find the safest cities in the state. Our research was based upon crime data published by the Federal Bureau of Investigation, which reports crimes from cities across the country. We used the volume and mix of reported crimes to calculate a crime score for cities across the state of Massachusetts by adjusting the level of reported crime by the severity of the crime, as well as the population level in each city.
Our study considered crime levels in 284 Massachusetts cities. In total, we studied 26 large cities with over 50,000 residents, 153 midsize cities with between 10,000 and 50,000 residents, and 105 small cities with under 10,000 residents. The average crime score in Massachusetts cities was 27.

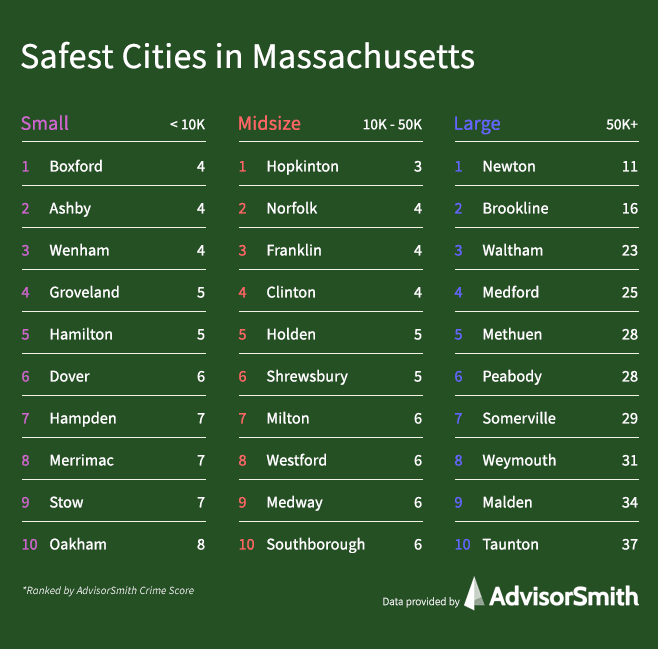
Safest Large Cities in Massachusetts
The average crime score for large cities in Massachusetts was 49, and the range of crime scores was between 11 and 109 for cities with over 50,000 residents.
The safest large city in Massachusetts was Newton. This suburb, located west of Boston, is composed of a set of 13 village communities. Notably, Newton hosts two symphony orchestras and is known for good public schools. The city also has good public transportation links to Boston.
The large city with the highest levels of reported crime in the state was Springfield. Located on the east bank of the Connecticut River on the border of Connecticut, Springfield is known for the many inventions developed there, including the first American dictionary and the first American gas-powered automobile. The city is also host to numerous higher education institutions.
| Rank | City | Violent Crimes per 1,000 Residents | Property Crimes per 1,000 Residents | Crime Score |
|---|---|---|---|---|
| 1 | Newton | 2.6 | 5.8 | 11.3 |
| 2 | Brookline | 2.4 | 8.5 | 16.0 |
| 3 | Waltham | 6.0 | 8.2 | 23.1 |
| 4 | Medford | 5.6 | 9.2 | 25.3 |
| 5 | Methuen | 7.3 | 10.9 | 27.7 |
| 6 | Peabody | 6.9 | 8.2 | 28.2 |
| 7 | Somerville | 5.2 | 12.6 | 28.7 |
| 8 | Weymouth | 6.7 | 8.0 | 30.9 |
| 9 | Malden | 8.0 | 11.8 | 33.8 |
| 10 | Taunton | 10.2 | 6.0 | 36.5 |
| 11 | Plymouth | 10.3 | 9.8 | 38.9 |
| 12 | Revere | 11.0 | 12.2 | 40.2 |
| 13 | Framingham | 8.5 | 10.9 | 40.9 |
| 14 | Cambridge | 9.7 | 16.5 | 41.1 |
| 15 | Quincy | 10.7 | 12.2 | 44.2 |
| 16 | Lowell | 16.1 | 14.8 | 50.0 |
| 17 | Lynn | 12.4 | 14.3 | 53.0 |
| 18 | Haverhill | 16.3 | 13.1 | 56.7 |
| 19 | Lawrence | 18.2 | 11.9 | 65.6 |
| 20 | Boston | 17.7 | 18.9 | 68.6 |
| 21 | Worcester | 18.6 | 20.5 | 71.7 |
| 22 | Chicopee | 21.6 | 23.9 | 78.9 |
| 23 | Fall River | 21.6 | 12.1 | 79.6 |
| 24 | Brockton | 22.5 | 19.4 | 85.9 |
| 25 | New Bedford | 31.6 | 22.5 | 90.2 |
| 26 | Springfield | 35.3 | 26.0 | 109.1 |
Safest Midsize Cities in Massachusetts
The safest midsize city in Massachusetts was Hopkinton. This city of about 19,000 residents is located 30 miles west of Boston. The city is best known for hosting the start of the Boston Marathon on an annual basis. The city also serves as one of the headquarters of the company Dell EMC.
For midsize cities in Massachusetts, the average crime score was 26. Scores for midsize cities ranged from as low as 3 to as high as 113. We studied 153 midsize cities in Massachusetts with between 10,000 and 50,000 residents.
| Rank | City | Violent Crimes per 1,000 Residents | Property Crimes per 1,000 Residents | Crime Score |
|---|---|---|---|---|
| 1 | Hopkinton | 1.8 | 1.6 | 3.4 |
| 2 | Norfolk | 1.1 | 2.1 | 3.6 |
| 3 | Franklin | 2.2 | 1.2 | 3.7 |
| 4 | Clinton | 1.3 | 1.0 | 4.0 |
| 5 | Holden | 1.4 | 2.2 | 4.6 |
| 6 | Shrewsbury | 1.0 | 3.3 | 4.9 |
| 7 | Milton | 1.2 | 2.2 | 5.7 |
| 8 | Westford | 1.5 | 2.2 | 5.8 |
| 9 | Medway | 1.6 | 2.0 | 5.9 |
| 10 | Southborough | 1.6 | 2.9 | 5.9 |
| 11 | Winchester | 0.7 | 3.9 | 6.0 |
| 12 | Bedford | 1.0 | 2.8 | 6.3 |
| 13 | Reading | 1.1 | 4.6 | 6.3 |
| 14 | Lexington | 1.2 | 2.3 | 6.4 |
| 15 | Wellesley | 1.6 | 4.0 | 6.8 |
| 16 | Sharon | 1.4 | 2.5 | 7.1 |
| 17 | Needham | 2.0 | 4.3 | 8.2 |
| 18 | Middleton | 1.9 | 4.1 | 8.4 |
| 19 | Weston | 2.2 | 2.3 | 8.9 |
| 20 | Norton | 1.7 | 0.7 | 9.4 |
| 21 | Lynnfield | 2.8 | 5.9 | 9.4 |
| 22 | Grafton | 2.2 | 2.4 | 9.5 |
| 23 | Billerica | 3.0 | 3.9 | 9.5 |
| 24 | Northborough | 2.8 | 5.8 | 9.6 |
| 25 | Duxbury | 2.9 | 3.6 | 9.8 |
| 26 | Hanover | 0.4 | 8.4 | 9.8 |
| 27 | Scituate | 2.4 | 3.3 | 9.9 |
| 28 | Belmont | 1.8 | 6.8 | 9.9 |
| 29 | Andover | 2.4 | 5.9 | 10.0 |
| 30 | Sudbury | 1.8 | 3.4 | 10.2 |
| 31 | Holliston | 3.3 | 2.7 | 10.3 |
| 32 | Rehoboth | 3.3 | 3.8 | 10.4 |
| 33 | Arlington | 2.9 | 3.7 | 10.8 |
| 34 | North Andover | 2.4 | 5.2 | 10.8 |
| 35 | Pembroke | 3.1 | 4.4 | 11.4 |
| 36 | Norwell | 2.1 | 4.6 | 11.6 |
| 37 | Groton | 3.4 | 2.2 | 11.7 |
| 38 | Marshfield | 2.8 | 2.8 | 12.1 |
| 39 | Charlton | 4.8 | 4.0 | 12.4 |
| 40 | North Reading | 3.1 | 3.8 | 12.8 |
| 41 | Concord | 3.0 | 4.6 | 12.8 |
| 42 | Swampscott | 2.7 | 7.4 | 13.0 |
| 43 | Belchertown | 3.9 | 3.6 | 13.1 |
| 44 | Beverly | 2.4 | 4.9 | 13.2 |
| 45 | Spencer | 2.0 | 5.5 | 13.4 |
| 46 | Dracut | 4.8 | 4.4 | 14.2 |
| 47 | Longmeadow | 2.9 | 7.6 | 14.5 |
| 48 | Ashland | 3.6 | 4.3 | 14.7 |
| 49 | Marblehead | 2.8 | 5.5 | 15.0 |
| 50 | Acton | 4.6 | 2.8 | 15.1 |
| 51 | Melrose | 3.7 | 6.1 | 15.5 |
| 52 | Ipswich | 3.4 | 3.3 | 15.7 |
| 53 | Acushnet | 5.1 | 3.3 | 16.0 |
| 54 | Littleton | 4.6 | 4.6 | 16.5 |
| 55 | Westwood | 3.1 | 10.2 | 16.7 |
| 56 | Dedham | 1.9 | 13.0 | 17.1 |
| 57 | Pepperell | 4.5 | 4.8 | 17.1 |
| 58 | Tyngsboro | 4.6 | 3.8 | 17.3 |
| 59 | Wakefield | 4.5 | 6.0 | 17.7 |
| 60 | Wilmington | 4.1 | 6.4 | 18.1 |
| 61 | Watertown | 4.3 | 8.8 | 18.3 |
| 62 | Hingham | 3.4 | 7.6 | 18.3 |
| 63 | Wrentham | 1.8 | 14.8 | 19.0 |
| 64 | Chelmsford | 2.5 | 11.3 | 19.1 |
| 65 | Lakeville | 3.9 | 7.4 | 19.4 |
| 66 | Westport | 5.0 | 7.0 | 19.6 |
| 67 | Uxbridge | 6.4 | 5.3 | 19.6 |
| 68 | Natick | 3.3 | 10.5 | 19.7 |
| 69 | Bridgewater | 4.8 | 3.5 | 19.7 |
| 70 | Easton | 4.1 | 5.8 | 19.9 |
| 71 | Hanson | 7.7 | 4.3 | 20.2 |
| 72 | Newburyport | 6.2 | 6.9 | 20.6 |
| 73 | Stoneham | 4.3 | 7.7 | 20.8 |
| 74 | East Bridgewater | 6.3 | 4.4 | 20.9 |
| 75 | Amesbury | 5.8 | 7.5 | 21.1 |
| 76 | Maynard | 5.8 | 3.7 | 21.9 |
| 77 | Kingston | 5.5 | 7.8 | 22.2 |
| 78 | Winthrop | 5.1 | 6.9 | 22.3 |
| 79 | Sandwich | 6.6 | 4.8 | 22.4 |
| 80 | Norwood | 6.6 | 7.4 | 23.3 |
| 81 | Northbridge | 5.3 | 8.4 | 23.4 |
| 82 | North Attleboro | 3.7 | 14.4 | 23.5 |
| 83 | Gloucester | 7.6 | 5.4 | 23.5 |
| 84 | Milford | 7.9 | 5.9 | 23.6 |
| 85 | Woburn | 4.6 | 10.3 | 23.8 |
| 86 | Millbury | 5.2 | 10.0 | 24.5 |
| 87 | Abington | 6.2 | 9.3 | 24.7 |
| 88 | Amherst | 5.0 | 4.4 | 24.7 |
| 89 | South Hadley | 7.6 | 8.8 | 24.8 |
| 90 | Harwich | 7.0 | 8.6 | 25.4 |
| 91 | Whitman | 6.9 | 6.9 | 25.5 |
| 92 | Bellingham | 6.5 | 11.3 | 25.8 |
| 93 | Braintree | 6.6 | 13.1 | 26.1 |
| 94 | Westborough | 7.9 | 10.4 | 26.3 |
| 95 | Lunenburg | 4.3 | 10.9 | 26.3 |
| 96 | East Longmeadow | 6.8 | 10.6 | 26.5 |
| 97 | Carver | 7.8 | 5.8 | 26.7 |
| 98 | Swansea | 8.6 | 7.1 | 27.1 |
| 99 | Rockland | 7.4 | 3.3 | 27.4 |
| 100 | Seekonk | 3.9 | 15.4 | 28.1 |
| 101 | Westfield | 6.8 | 9.6 | 28.1 |
| 102 | Wilbraham | 6.3 | 14.9 | 28.6 |
| 103 | Easthampton | 5.9 | 9.8 | 29.0 |
| 104 | Walpole | 7.3 | 10.2 | 29.0 |
| 105 | Canton | 4.7 | 6.6 | 29.2 |
| 106 | Burlington | 4.5 | 15.5 | 29.4 |
| 107 | Danvers | 9.9 | 12.9 | 30.2 |
| 108 | Foxborough | 10.2 | 9.0 | 30.2 |
| 109 | Raynham | 4.8 | 14.7 | 30.4 |
| 110 | Somerset | 10.6 | 7.2 | 30.4 |
| 111 | Stoughton | 9.3 | 9.9 | 30.5 |
| 112 | Dudley | 10.1 | 4.4 | 30.5 |
| 113 | Mansfield | 8.2 | 7.0 | 30.6 |
| 114 | Auburn | 5.0 | 18.2 | 31.6 |
| 115 | Oxford | 6.9 | 11.6 | 32.1 |
| 116 | Mashpee | 7.2 | 9.4 | 32.1 |
| 117 | Ludlow | 8.1 | 9.3 | 33.1 |
| 118 | Saugus | 6.6 | 12.7 | 33.2 |
| 119 | Tewksbury | 8.7 | 11.0 | 35.5 |
| 120 | Nantucket | 9.5 | 13.5 | 35.5 |
| 121 | Randolph | 11.2 | 11.9 | 35.8 |
| 122 | Dartmouth | 9.4 | 14.7 | 35.9 |
| 123 | Attleboro | 9.1 | 11.6 | 36.8 |
| 124 | Leicester | 5.8 | 20.4 | 37.0 |
| 125 | Holbrook | 9.6 | 11.7 | 37.9 |
| 126 | Bourne | 11.9 | 10.8 | 39.0 |
| 127 | Agawam | 11.6 | 13.1 | 40.7 |
| 128 | Winchendon | 12.0 | 9.2 | 41.5 |
| 129 | Athol | 10.4 | 8.6 | 42.0 |
| 130 | Hull | 11.0 | 7.8 | 42.9 |
| 131 | Palmer | 14.7 | 9.4 | 45.1 |
| 132 | Barnstable | 13.1 | 9.7 | 45.1 |
| 133 | Yarmouth | 11.4 | 9.9 | 45.4 |
| 134 | Fairhaven | 14.2 | 13.4 | 46.3 |
| 135 | Marlborough | 12.5 | 13.4 | 46.3 |
| 136 | Falmouth | 15.4 | 11.6 | 47.1 |
| 137 | Gardner | 13.0 | 15.0 | 47.5 |
| 138 | Salem | 18.1 | 16.7 | 48.6 |
| 139 | Middleboro | 13.3 | 7.5 | 48.9 |
| 140 | Everett | 9.7 | 13.2 | 50.7 |
| 141 | Northampton | 14.0 | 15.6 | 53.9 |
| 142 | Fitchburg | 14.1 | 13.2 | 56.7 |
| 143 | Southbridge | 14.8 | 14.1 | 57.4 |
| 144 | Greenfield | 11.5 | 19.6 | 57.6 |
| 145 | Dennis | 15.7 | 14.1 | 66.7 |
| 146 | Leominster | 20.7 | 14.4 | 66.8 |
| 147 | Wareham | 15.6 | 14.3 | 69.7 |
| 148 | Webster | 20.2 | 12.3 | 72.3 |
| 149 | West Springfield | 12.4 | 33.8 | 72.8 |
| 150 | Chelsea | 22.5 | 14.7 | 73.2 |
| 151 | Pittsfield | 19.9 | 18.8 | 77.9 |
| 152 | North Adams | 17.2 | 31.3 | 80.6 |
| 153 | Holyoke | 28.4 | 37.2 | 112.5 |
Safest Small Cities in Massachusetts
The safest small city in Massachusetts was Boxford. Located north of Boston, Boxford is a rural town with minimal commercial development. Founded in 1685, Boxford has many recreational opportunities for its residents, including hiking trails, lakes, and ponds.
The table below lists the safest small cities in the state of Massachusetts. The cities listed below have under 10,000 residents. Additionally, each city’s crime score, rank, and levels of violent and property crime per 1,000 residents are also listed. The average crime score for small cities was 23, and scores ranged from 4 to 220 in the state.
| Rank | City | Violent Crimes per 1,000 Residents | Property Crimes per 1,000 Residents | Crime Score |
|---|---|---|---|---|
| 1 | Boxford | 0.5 | 3.1 | 3.6 |
| 2 | Ashby | 0.0 | 3.7 | 3.7 |
| 3 | Wenham | 2.3 | 1.8 | 4.1 |
| 4 | Groveland | 1.3 | 1.4 | 4.9 |
| 5 | Hamilton | 0.9 | 3.5 | 5.1 |
| 6 | Dover | 2.0 | 2.5 | 5.5 |
| 7 | Hampden | 1.7 | 4.2 | 6.9 |
| 8 | Merrimac | 3.1 | 2.3 | 7.0 |
| 9 | Stow | 2.9 | 1.7 | 7.3 |
| 10 | Oakham | 4.4 | 3.5 | 7.9 |
| 11 | Lincoln | 1.8 | 2.6 | 8.2 |
| 12 | Mendon | 3.2 | 2.6 | 8.3 |
| 13 | Georgetown | 3.4 | 3.8 | 8.3 |
| 14 | Princeton | 2.4 | 4.5 | 8.7 |
| 15 | Boxborough | 1.8 | 4.0 | 8.9 |
| 16 | Pelham | 2.3 | 6.8 | 9.1 |
| 17 | Manchester-By-The-Sea | 1.8 | 5.3 | 9.3 |
| 18 | Northfield | 4.9 | 4.5 | 9.4 |
| 19 | Sterling | 2.5 | 2.3 | 9.5 |
| 20 | Topsfield | 2.5 | 1.8 | 9.6 |
| 21 | Cheshire | 3.8 | 1.0 | 9.6 |
| 22 | Carlisle | 1.8 | 5.6 | 9.6 |
| 23 | Bolton | 3.3 | 4.6 | 9.8 |
| 24 | Lancaster | 1.6 | 5.3 | 10.0 |
| 25 | Gill | 0.0 | 10.1 | 10.1 |
| 26 | Cohasset | 2.7 | 6.2 | 10.6 |
| 27 | Dunstable | 3.5 | 2.2 | 10.6 |
| 28 | Plainville | 2.0 | 5.2 | 10.9 |
| 29 | Boylston | 2.9 | 0.7 | 11.0 |
| 30 | Harvard | 1.5 | 4.3 | 12.0 |
| 31 | Rowley | 2.7 | 4.1 | 12.1 |
| 32 | Douglas | 4.1 | 2.7 | 12.2 |
| 33 | Berkley | 2.9 | 2.8 | 12.8 |
| 34 | Upton | 4.0 | 3.9 | 13.2 |
| 35 | Dalton | 4.9 | 3.4 | 13.4 |
| 36 | Rockport | 4.8 | 2.4 | 13.6 |
| 37 | Townsend | 4.7 | 3.4 | 14.1 |
| 38 | Granby | 3.9 | 3.3 | 14.9 |
| 39 | Newbury | 3.9 | 2.8 | 15.1 |
| 40 | Blackstone | 5.9 | 2.3 | 15.6 |
| 41 | Halifax | 3.7 | 6.5 | 15.7 |
| 42 | Wellfleet | 4.9 | 11.1 | 16.0 |
| 43 | Ashburnham | 4.1 | 4.4 | 16.1 |
| 44 | Paxton | 3.3 | 2.6 | 16.5 |
| 45 | Marion | 6.0 | 6.2 | 17.0 |
| 46 | West Boylston | 3.6 | 6.2 | 17.1 |
| 47 | Williamstown | 2.7 | 8.9 | 17.3 |
| 48 | Southwick | 4.4 | 6.7 | 17.4 |
| 49 | Sutton | 4.9 | 5.5 | 17.6 |
| 50 | Templeton | 6.0 | 2.7 | 17.8 |
| 51 | Erving | 8.6 | 9.2 | 17.9 |
| 52 | Southampton | 4.2 | 5.9 | 17.9 |
| 53 | Holland | 3.8 | 4.8 | 18.3 |
| 54 | Orleans | 4.5 | 8.7 | 18.3 |
| 55 | Williamsburg | 2.9 | 8.7 | 18.3 |
| 56 | Great Barrington | 5.4 | 4.1 | 18.8 |
| 57 | Hatfield | 2.6 | 12.8 | 19.0 |
| 58 | Sunderland | 6.0 | 5.7 | 19.4 |
| 59 | Eastham | 5.0 | 7.9 | 19.7 |
| 60 | Deerfield | 4.8 | 8.5 | 19.9 |
| 61 | Berlin | 1.9 | 9.6 | 20.1 |
| 62 | West Bridgewater | 3.7 | 9.8 | 20.3 |
| 63 | Hopedale | 6.3 | 2.4 | 20.4 |
| 64 | Mattapoisett | 5.2 | 6.3 | 21.5 |
| 65 | Whately | 3.4 | 14.3 | 21.8 |
| 66 | Plympton | 10.7 | 5.0 | 22.5 |
| 67 | Goshen | 0.0 | 22.5 | 22.5 |
| 68 | Westminster | 4.6 | 5.4 | 23.2 |
| 69 | Shirley | 5.1 | 5.5 | 23.6 |
| 70 | Chatham | 6.4 | 9.6 | 23.9 |
| 71 | East Brookfield | 9.3 | 3.8 | 24.0 |
| 72 | Millville | 3.3 | 5.7 | 24.2 |
| 73 | Freetown | 8.8 | 5.4 | 24.4 |
| 74 | Stockbridge | 4.2 | 16.9 | 24.6 |
| 75 | Brookfield | 6.1 | 7.6 | 24.7 |
| 76 | West Tisbury | 4.1 | 6.4 | 25.1 |
| 77 | Brewster | 7.0 | 3.9 | 25.4 |
| 78 | Barre | 7.4 | 3.2 | 25.7 |
| 79 | Ayer | 10.0 | 7.0 | 26.0 |
| 80 | Lenox | 4.4 | 14.3 | 27.5 |
| 81 | Nahant | 5.0 | 3.7 | 28.6 |
| 82 | Lee | 7.0 | 11.4 | 29.4 |
| 83 | Salisbury | 10.8 | 7.7 | 29.5 |
| 84 | Wales | 6.3 | 6.3 | 30.4 |
| 85 | Rochester | 5.3 | 6.4 | 30.9 |
| 86 | Bernardston | 6.7 | 6.2 | 32.0 |
| 87 | Truro | 11.5 | 3.0 | 32.1 |
| 88 | Monson | 10.8 | 4.9 | 32.8 |
| 89 | Sturbridge | 10.9 | 11.8 | 32.8 |
| 90 | Becket | 13.9 | 4.0 | 32.8 |
| 91 | Rutland | 7.7 | 2.5 | 34.3 |
| 92 | Orange | 7.3 | 12.2 | 35.5 |
| 93 | New Braintree | 6.7 | 6.7 | 38.5 |
| 94 | Adams | 10.0 | 11.7 | 42.9 |
| 95 | Avon | 6.4 | 24.6 | 43.1 |
| 96 | Hardwick | 12.9 | 5.4 | 46.3 |
| 97 | Ware | 14.7 | 8.5 | 48.6 |
| 98 | Edgartown | 10.8 | 13.8 | 50.2 |
| 99 | Montague | 10.4 | 10.1 | 51.9 |
| 100 | Chilmark | 8.7 | 13.0 | 54.3 |
| 101 | Oak Bluffs | 12.2 | 13.7 | 54.5 |
| 102 | Tisbury | 14.1 | 7.5 | 61.0 |
| 103 | Provincetown | 23.8 | 17.4 | 71.1 |
| 104 | Hadley | 11.4 | 31.7 | 72.6 |
| 105 | Aquinnah | 36.6 | 0.0 | 219.5 |
Methodology
This study used a dataset published by the Federal Bureau of Investigation that compiles reported crime statistics from cities and law enforcement agencies around the country. Jurisdictions report crimes on Return A, which are compiled together into the Uniform Crime Reporting Statistics dataset. This data reports violent and property crimes such as murder, rape, robbery, assault, burglary, larceny, and motor vehicle theft. This study was based on the most recent release of the data, which reports crimes from calendar year 2019.
To find the safest cities in Massachusetts, we counted the number of reported crimes for each city in the dataset. We applied a multiplier to more severe crimes such as murder, and weighted each crime to calculate a composite crime value for each city. We normalized the crime values by population in order to calculate a crime score for each city.
Finally, we divided Massachusetts cities into three categories based upon population size. Cities with under 10,000 residents were considered small cities. Cities with between 10,000 and 50,000 residents were considered midsize cities, and cities with over 50,000 residents were considered large cities. We ranked the cities within their population cohorts to find the safest small, midsize, and large cities in Massachusetts.
Sources
- Federal Bureau of Investigation, Uniform Crime Reporting, Return A, 2019