


AdvisorSmith analyzed data published by the FBI to find the cities in California with the lowest levels of reported crime on a population-adjusted basis. Our analysis relied upon crime reports from cities across the state to form crime scores which reflect the level of reported crimes adjusted for population. Our crime score assigns a higher weight to more serious crimes such as murder and rape, while giving less weight to property crimes. The average crime score for cities in the Golden State was 82, while the range of scores was as low as 5 and as high as 8,248.
This study included 460 cities in the state of California. We divided cities into three groups based upon population. Small cities were those with under 10,000 residents. Midsize cities had between 10,000 and 100,000 residents, and large cities had over 100,000 residents. Our study included 74 large cities, 294 midsize cities, and 92 small cities in California.

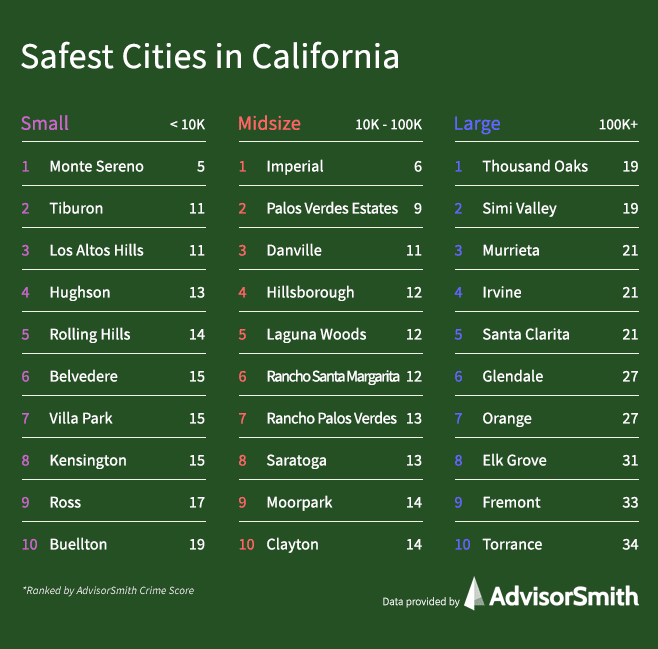
Safest Large Cities in California
The average crime score for large California cities with over 100,000 residents was 57. The safest large city had a crime score of 19, while the highest crime score was 163.
The safest large city in California was Thousand Oaks. Located in Ventura County, Thousand Oaks is in the northwestern part of the Greater Los Angeles metropolitan area. The city has served as host to hundreds of movie productions due to its proximity to Hollywood. Today, the city is host to numerous high-tech and biotechnology companies, as well as California Lutheran University.
The city with the most reported crime in California is Oakland. One of the anchor cities of the San Francisco metropolitan area, Oakland is the largest city in the East Bay, and the city grew rapidly in the early 1900s. Today, Oakland, or “The Town” as known by locals, has a busy international seaport and numerous technology companies.
| Rank | City | Violent Crimes per 1,000 Residents | Property Crimes per 1,000 Residents | Crime Score |
|---|---|---|---|---|
| 1 | Thousand Oaks | 4.1 | 10.9 | 19.3 |
| 2 | Simi Valley | 3.7 | 9.4 | 19.4 |
| 3 | Murrieta | 3.8 | 13.0 | 20.9 |
| 4 | Irvine | 3.9 | 13.1 | 20.9 |
| 5 | Santa Clarita | 4.2 | 9.4 | 20.9 |
| 6 | Glendale | 4.3 | 16.3 | 26.7 |
| 7 | Orange | 4.7 | 15.6 | 27.3 |
| 8 | Elk Grove | 4.9 | 14.8 | 31.1 |
| 9 | Fremont | 5.2 | 18.8 | 32.9 |
| 10 | Torrance | 4.0 | 19.7 | 34.1 |
| 11 | Corona | 4.2 | 20.4 | 34.2 |
| 12 | Temecula | 4.4 | 22.5 | 34.3 |
| 13 | Sunnyvale | 3.9 | 21.8 | 35.0 |
| 14 | Carlsbad | 6.3 | 18.2 | 36.2 |
| 15 | El Monte | 7.3 | 15.4 | 37.1 |
| 16 | Daly City | 7.9 | 17.3 | 37.7 |
| 17 | Huntington Beach | 7.3 | 20.5 | 38.6 |
| 18 | Clovis | 6.5 | 19.9 | 39.0 |
| 19 | Roseville | 7.3 | 22.3 | 39.7 |
| 20 | Chula Vista | 8.6 | 13.9 | 39.8 |
| 21 | Rancho Cucamonga | 6.0 | 19.3 | 40.2 |
| 22 | Burbank | 5.7 | 25.2 | 40.5 |
| 23 | West Covina | 5.0 | 22.3 | 40.6 |
| 24 | San Mateo | 5.9 | 20.9 | 41.2 |
| 25 | Fontana | 9.7 | 14.3 | 42.8 |
| 26 | Jurupa Valley | 6.2 | 22.6 | 43.7 |
| 27 | Norwalk | 7.3 | 15.0 | 44.0 |
| 28 | Escondido | 10.0 | 15.5 | 44.4 |
| 29 | Garden Grove | 6.7 | 22.6 | 45.3 |
| 30 | Vista | 12.6 | 14.1 | 45.5 |
| 31 | Downey | 7.8 | 22.0 | 46.7 |
| 32 | Palmdale | 10.6 | 14.2 | 47.3 |
| 33 | San Diego | 9.2 | 18.8 | 47.8 |
| 34 | Fullerton | 9.8 | 22.5 | 48.0 |
| 35 | Oxnard | 9.6 | 20.1 | 48.2 |
| 36 | Pasadena | 6.8 | 20.2 | 50.1 |
| 37 | Vacaville | 8.3 | 24.1 | 50.8 |
| 38 | Santa Clara | 5.7 | 36.2 | 51.1 |
| 39 | Ontario | 8.1 | 23.4 | 51.6 |
| 40 | Anaheim | 10.9 | 23.3 | 51.8 |
| 41 | Santa Rosa | 10.0 | 16.2 | 53.6 |
| 42 | Hayward | 6.5 | 30.2 | 55.2 |
| 43 | Moreno Valley | 9.0 | 26.2 | 55.9 |
| 44 | Santa Ana | 11.2 | 20.4 | 56.0 |
| 45 | Oceanside | 13.3 | 21.1 | 56.7 |
| 46 | Costa Mesa | 9.2 | 32.8 | 57.5 |
| 47 | San Jose | 11.0 | 24.2 | 59.8 |
| 48 | Ventura | 11.9 | 26.6 | 61.1 |
| 49 | El Cajon | 13.4 | 19.7 | 61.3 |
| 50 | Santa Maria | 12.2 | 18.1 | 61.8 |
| 51 | Salinas | 12.9 | 22.5 | 62.2 |
| 52 | Fairfield | 12.5 | 31.9 | 64.9 |
| 53 | Inglewood | 11.8 | 21.2 | 65.6 |
| 54 | Long Beach | 15.2 | 24.1 | 67.1 |
| 55 | Visalia | 13.8 | 28.9 | 67.8 |
| 56 | Concord | 11.2 | 34.9 | 69.0 |
| 57 | Riverside | 14.9 | 29.4 | 71.5 |
| 58 | Victorville | 13.8 | 18.5 | 74.0 |
| 59 | Pomona | 13.0 | 27.5 | 74.2 |
| 60 | Rialto | 12.6 | 30.3 | 74.3 |
| 61 | Antioch | 16.6 | 28.4 | 76.2 |
| 62 | Bakersfield | 11.2 | 41.4 | 76.9 |
| 63 | Sacramento | 14.0 | 31.8 | 78.4 |
| 64 | Fresno | 17.6 | 32.8 | 79.5 |
| 65 | Los Angeles | 17.3 | 23.8 | 80.2 |
| 66 | Berkeley | 6.7 | 50.9 | 85.3 |
| 67 | Lancaster | 20.6 | 21.0 | 87.2 |
| 68 | Modesto | 16.3 | 33.2 | 92.1 |
| 69 | Richmond | 12.2 | 37.7 | 98.4 |
| 70 | Vallejo | 15.0 | 40.3 | 102.5 |
| 71 | San Francisco | 12.5 | 55.1 | 102.7 |
| 72 | Stockton | 24.1 | 39.4 | 136.1 |
| 73 | San Bernardino | 28.8 | 41.9 | 140.1 |
| 74 | Oakland | 31.4 | 64.2 | 163.3 |
Safest Midsize Cities in California
The safest midsize city in California was Imperial. The city is located in Imperial County, just north of the U.S. border. The city is known for the annual California Mid-Winter Fair & Fiesta which attracts visitors from around the state.
Among midsize cities in California, the average crime score was 47. The range of crime scores spanned from 6 to 310. Midsize California cities included cities with populations between 10,000 and 100,000 residents.
| Rank | City | Violent Crimes per 1,000 Residents | Property Crimes per 1,000 Residents | Crime Score |
|---|---|---|---|---|
| 1 | Imperial | 1.7 | 3.1 | 6.2 |
| 2 | Palos Verdes Estates | 0.7 | 6.6 | 8.8 |
| 3 | Danville | 1.0 | 6.6 | 10.7 |
| 4 | Hillsborough | 1.0 | 8.4 | 11.6 |
| 5 | Laguna Woods | 1.7 | 7.7 | 11.7 |
| 6 | Rancho Santa Margarita | 2.8 | 6.1 | 12.4 |
| 7 | Rancho Palos Verdes | 1.2 | 7.5 | 12.6 |
| 8 | Saratoga | 1.7 | 7.8 | 12.7 |
| 9 | Moorpark | 3.4 | 6.2 | 13.9 |
| 10 | Clayton | 1.1 | 12.5 | 14.0 |
| 11 | Paradise | 1.7 | 7.5 | 14.1 |
| 12 | Aliso Viejo | 2.9 | 8.3 | 14.1 |
| 13 | Yorba Linda | 2.4 | 9.2 | 14.8 |
| 14 | Lafayette | 0.7 | 13.3 | 15.0 |
| 15 | Moraga | 1.7 | 6.9 | 15.3 |
| 16 | Los Altos | 1.9 | 10.1 | 15.8 |
| 17 | Mission Viejo | 3.2 | 9.1 | 16.0 |
| 18 | Lincoln | 2.8 | 9.6 | 16.0 |
| 19 | Laguna Niguel | 3.1 | 9.1 | 16.0 |
| 20 | Orinda | 0.9 | 9.7 | 16.3 |
| 21 | Lake Forest | 4.3 | 7.9 | 16.4 |
| 22 | Sierra Madre | 2.1 | 7.2 | 16.6 |
| 23 | Los Alamitos | 3.4 | 11.3 | 17.6 |
| 24 | Los Gatos | 2.0 | 13.6 | 18.2 |
| 25 | Canyon Lake | 5.2 | 6.5 | 18.3 |
| 26 | Coronado | 1.4 | 15.3 | 19.0 |
| 27 | Soledad | 3.2 | 5.2 | 19.2 |
| 28 | Chino Hills | 2.7 | 10.5 | 19.3 |
| 29 | Pacific Grove | 4.7 | 10.8 | 20.3 |
| 30 | Benicia | 4.3 | 13.2 | 20.5 |
| 31 | Poway | 5.1 | 9.8 | 20.5 |
| 32 | San Ramon | 2.2 | 14.4 | 20.6 |
| 33 | Oakley | 2.8 | 11.6 | 20.9 |
| 34 | Cypress | 3.2 | 12.1 | 21.3 |
| 35 | Carpinteria | 5.5 | 11.5 | 21.4 |
| 36 | Camarillo | 4.8 | 11.7 | 21.9 |
| 37 | Newman | 5.2 | 9.5 | 22.2 |
| 38 | Walnut | 2.8 | 12.8 | 22.5 |
| 39 | La Canada Flintridge | 2.3 | 16.0 | 22.6 |
| 40 | San Marino | 1.4 | 15.8 | 22.8 |
| 41 | Temple City | 4.1 | 9.1 | 22.9 |
| 42 | Foster City | 3.9 | 12.3 | 23.0 |
| 43 | Laguna Hills | 4.6 | 13.0 | 23.1 |
| 44 | Encinitas | 6.3 | 9.6 | 23.4 |
| 45 | Eastvale | 2.8 | 14.2 | 23.5 |
| 46 | Rocklin | 3.0 | 14.3 | 23.6 |
| 47 | Scotts Valley | 5.7 | 11.9 | 23.7 |
| 48 | San Juan Capistrano | 6.2 | 8.2 | 23.8 |
| 49 | Hercules | 4.0 | 13.2 | 24.0 |
| 50 | Cupertino | 2.5 | 16.9 | 24.4 |
| 51 | Solana Beach | 5.9 | 12.9 | 24.5 |
| 52 | Agoura Hills | 3.0 | 14.9 | 24.5 |
| 53 | Truckee | 7.7 | 6.9 | 24.6 |
| 54 | Windsor | 4.5 | 9.2 | 25.2 |
| 55 | Riverbank | 5.1 | 15.0 | 25.5 |
| 56 | Fillmore | 10.2 | 7.7 | 25.5 |
| 57 | Morgan Hill | 4.4 | 15.2 | 25.7 |
| 58 | Calabasas | 3.5 | 13.8 | 25.7 |
| 59 | Mill Valley | 3.0 | 15.5 | 25.8 |
| 60 | Diamond Bar | 2.8 | 16.1 | 25.8 |
| 61 | Healdsburg | 4.5 | 14.4 | 26.5 |
| 62 | Dana Point | 7.1 | 11.8 | 26.6 |
| 63 | Ripon | 5.8 | 15.4 | 26.7 |
| 64 | San Clemente | 5.9 | 14.1 | 27.1 |
| 65 | King City | 9.2 | 10.4 | 27.2 |
| 66 | Folsom | 3.3 | 18.6 | 27.6 |
| 67 | La Mirada | 3.9 | 14.4 | 27.6 |
| 68 | Belmont | 3.7 | 14.4 | 27.6 |
| 69 | Grover Beach | 4.4 | 17.6 | 27.7 |
| 70 | San Marcos | 7.7 | 9.7 | 27.9 |
| 71 | Arroyo Grande | 4.9 | 15.1 | 27.9 |
| 72 | Piedmont | 1.3 | 20.1 | 28.7 |
| 73 | Morro Bay | 6.5 | 12.0 | 28.8 |
| 74 | Goleta | 6.1 | 16.5 | 29.3 |
| 75 | Fountain Valley | 3.7 | 20.8 | 29.7 |
| 76 | Wildomar | 5.5 | 16.8 | 30.4 |
| 77 | Pleasanton | 3.7 | 19.4 | 30.5 |
| 78 | La Palma | 5.7 | 19.4 | 30.8 |
| 79 | Santee | 8.1 | 13.7 | 30.9 |
| 80 | Hollister | 7.7 | 7.7 | 31.1 |
| 81 | Dublin | 4.0 | 19.1 | 31.6 |
| 82 | South Pasadena | 3.8 | 22.1 | 31.9 |
| 83 | Redwood City | 4.5 | 15.4 | 32.1 |
| 84 | Martinez | 5.0 | 14.7 | 32.2 |
| 85 | Coalinga | 5.9 | 13.3 | 32.2 |
| 86 | La Verne | 4.1 | 19.4 | 32.3 |
| 87 | Kingsburg | 6.3 | 18.1 | 32.4 |
| 88 | Menifee | 4.7 | 20.0 | 32.6 |
| 89 | Duarte | 4.9 | 14.2 | 32.6 |
| 90 | Seal Beach | 5.9 | 22.8 | 32.8 |
| 91 | Cathedral City | 7.3 | 10.9 | 33.0 |
| 92 | Marina | 6.9 | 15.8 | 33.1 |
| 93 | San Fernando | 6.3 | 9.9 | 33.3 |
| 94 | Baldwin Park | 5.6 | 14.6 | 34.0 |
| 95 | Chowchilla | 10.8 | 12.5 | 34.1 |
| 96 | Arcadia | 3.4 | 22.9 | 34.2 |
| 97 | Claremont | 5.7 | 21.1 | 34.4 |
| 98 | Seaside | 8.4 | 12.9 | 34.4 |
| 99 | Stanton | 7.0 | 13.7 | 34.5 |
| 100 | Cudahy | 6.2 | 9.0 | 34.5 |
| 101 | Maywood | 6.0 | 10.8 | 34.6 |
| 102 | Greenfield | 8.1 | 9.3 | 34.8 |
| 103 | Port Hueneme | 5.6 | 18.7 | 34.9 |
| 104 | Menlo Park | 3.8 | 22.2 | 35.0 |
| 105 | Monrovia | 5.3 | 23.0 | 35.2 |
| 106 | Lomita | 6.0 | 12.4 | 35.5 |
| 107 | Laguna Beach | 9.9 | 14.2 | 35.5 |
| 108 | Beaumont | 7.2 | 18.1 | 35.6 |
| 109 | Novato | 6.4 | 15.9 | 35.9 |
| 110 | Pacifica | 9.7 | 13.7 | 35.9 |
| 111 | Manhattan Beach | 3.8 | 23.9 | 36.0 |
| 112 | Livermore | 7.1 | 17.0 | 36.1 |
| 113 | Kerman | 7.6 | 20.2 | 36.2 |
| 114 | Alhambra | 5.8 | 20.6 | 36.6 |
| 115 | Newport Beach | 6.5 | 20.7 | 36.7 |
| 116 | Atascadero | 9.2 | 16.1 | 36.9 |
| 117 | Petaluma | 7.5 | 12.6 | 36.9 |
| 118 | Santa Paula | 7.7 | 13.4 | 37.3 |
| 119 | Tracy | 6.9 | 19.8 | 37.4 |
| 120 | Calexico | 3.3 | 22.2 | 37.4 |
| 121 | Sonoma | 7.9 | 10.8 | 37.6 |
| 122 | San Gabriel | 7.7 | 17.7 | 37.7 |
| 123 | Imperial Beach | 12.0 | 12.0 | 37.7 |
| 124 | Oakdale | 6.1 | 22.3 | 37.8 |
| 125 | La Habra | 7.4 | 18.0 | 37.9 |
| 126 | La Puente | 6.9 | 11.2 | 38.0 |
| 127 | Monterey Park | 4.7 | 22.4 | 38.1 |
| 128 | Redondo Beach | 5.5 | 20.3 | 38.2 |
| 129 | Paso Robles | 9.4 | 19.9 | 38.5 |
| 130 | Lawndale | 6.6 | 12.5 | 39.1 |
| 131 | Dixon | 6.6 | 18.7 | 39.1 |
| 132 | Yucaipa | 7.3 | 11.9 | 39.1 |
| 133 | La Quinta | 5.6 | 24.5 | 39.2 |
| 134 | Norco | 4.4 | 25.2 | 39.3 |
| 135 | Central Marin | 3.0 | 31.4 | 39.7 |
| 136 | Rosemead | 5.4 | 17.3 | 39.8 |
| 137 | Patterson | 9.6 | 19.2 | 40.0 |
| 138 | Bell Gardens | 7.9 | 14.9 | 40.5 |
| 139 | Milpitas | 6.8 | 26.6 | 40.5 |
| 140 | Coachella | 7.2 | 19.2 | 40.7 |
| 141 | Palo Alto | 4.1 | 29.6 | 40.8 |
| 142 | Galt | 8.4 | 16.8 | 41.0 |
| 143 | Rancho Cordova | 6.7 | 18.7 | 41.2 |
| 144 | Grand Terrace | 6.3 | 18.7 | 41.3 |
| 145 | Azusa | 6.6 | 19.0 | 41.7 |
| 146 | Parlier | 9.8 | 11.6 | 42.1 |
| 147 | Reedley | 9.1 | 9.1 | 42.2 |
| 148 | Tustin | 6.2 | 26.4 | 42.2 |
| 149 | Whittier | 6.5 | 22.1 | 42.2 |
| 150 | Brentwood | 8.4 | 20.4 | 42.4 |
| 151 | San Dimas | 4.8 | 24.5 | 42.5 |
| 152 | Farmersville | 8.6 | 17.6 | 42.5 |
| 153 | Twentynine Palms | 9.1 | 10.0 | 42.5 |
| 154 | Hermosa Beach | 5.1 | 23.1 | 42.8 |
| 155 | La Mesa | 10.2 | 16.7 | 43.0 |
| 156 | American Canyon | 6.8 | 22.2 | 43.4 |
| 157 | Placentia | 6.7 | 17.2 | 43.4 |
| 158 | South San Francisco | 8.4 | 21.7 | 43.5 |
| 159 | Pico Rivera | 7.4 | 16.7 | 44.0 |
| 160 | Davis | 3.6 | 31.4 | 44.0 |
| 161 | Manteca | 8.7 | 22.1 | 44.1 |
| 162 | Lakewood | 6.2 | 23.0 | 44.3 |
| 163 | Livingston | 9.0 | 21.6 | 44.5 |
| 164 | Mcfarland | 8.2 | 10.5 | 44.6 |
| 165 | Montebello | 7.3 | 23.1 | 45.3 |
| 166 | Mountain View | 5.7 | 29.1 | 45.5 |
| 167 | Bell | 8.5 | 12.3 | 45.6 |
| 168 | Newark | 7.4 | 28.6 | 45.7 |
| 169 | Shafter | 7.1 | 25.1 | 45.7 |
| 170 | Avenal | 12.7 | 4.5 | 45.9 |
| 171 | Porterville | 8.4 | 21.5 | 46.5 |
| 172 | Apple Valley | 7.9 | 14.9 | 46.9 |
| 173 | Artesia | 7.9 | 16.9 | 47.0 |
| 174 | Loma Linda | 7.5 | 22.8 | 47.2 |
| 175 | Napa | 11.0 | 15.5 | 47.4 |
| 176 | El Centro | 3.7 | 26.7 | 47.7 |
| 177 | Brea | 7.0 | 32.8 | 48.9 |
| 178 | Auburn | 12.4 | 16.7 | 48.9 |
| 179 | Buena Park | 8.4 | 24.9 | 49.0 |
| 180 | Union City | 7.3 | 22.8 | 49.1 |
| 181 | Exeter | 9.9 | 25.1 | 49.3 |
| 182 | Lake Elsinore | 8.2 | 28.5 | 49.4 |
| 183 | Walnut Creek | 5.3 | 35.4 | 49.6 |
| 184 | Los Banos | 8.9 | 21.8 | 49.7 |
| 185 | Alameda | 6.4 | 32.7 | 49.8 |
| 186 | Selma | 7.2 | 24.2 | 49.9 |
| 187 | Banning | 9.3 | 16.9 | 50.1 |
| 188 | Chino | 7.3 | 23.8 | 50.4 |
| 189 | Cerritos | 4.7 | 32.3 | 50.5 |
| 190 | San Bruno | 6.8 | 26.3 | 50.6 |
| 191 | Perris | 8.1 | 25.7 | 50.6 |
| 192 | Delano | 9.4 | 21.1 | 51.0 |
| 193 | Fortuna | 13.5 | 25.7 | 51.2 |
| 194 | Albany | 5.6 | 34.1 | 51.2 |
| 195 | Hesperia | 8.1 | 17.3 | 51.4 |
| 196 | Bellflower | 9.2 | 19.5 | 51.5 |
| 197 | Campbell | 7.9 | 31.8 | 52.2 |
| 198 | Glendora | 7.0 | 28.7 | 52.3 |
| 199 | Hawaiian Gardens | 9.4 | 15.7 | 53.0 |
| 200 | Rancho Mirage | 6.8 | 34.0 | 53.1 |
| 201 | Brawley | 6.0 | 23.4 | 53.3 |
| 202 | Lemoore | 13.2 | 13.9 | 53.4 |
| 203 | Suisun City | 10.9 | 22.2 | 53.6 |
| 204 | Westminster | 9.9 | 28.7 | 53.6 |
| 205 | San Jacinto | 9.5 | 33.1 | 53.7 |
| 206 | Citrus Heights | 8.5 | 25.4 | 53.7 |
| 207 | Ceres | 8.1 | 23.6 | 54.0 |
| 208 | Upland | 10.1 | 23.5 | 54.1 |
| 209 | Lodi | 10.9 | 24.5 | 54.1 |
| 210 | Lindsay | 9.3 | 18.2 | 54.2 |
| 211 | Hanford | 9.3 | 21.7 | 54.8 |
| 212 | Palm Desert | 7.4 | 34.4 | 55.1 |
| 213 | Carson | 7.7 | 21.8 | 55.2 |
| 214 | Covina | 10.4 | 24.8 | 55.2 |
| 215 | Corcoran | 13.2 | 12.7 | 55.2 |
| 216 | Woodland | 11.4 | 24.3 | 55.4 |
| 217 | Sanger | 11.4 | 11.9 | 55.5 |
| 218 | Placerville | 12.3 | 25.3 | 55.8 |
| 219 | Gardena | 7.2 | 20.1 | 55.9 |
| 220 | East Palo Alto | 12.1 | 18.0 | 57.4 |
| 221 | Ridgecrest | 14.6 | 13.8 | 57.5 |
| 222 | Colton | 9.8 | 27.6 | 57.6 |
| 223 | Tulare | 13.4 | 22.6 | 57.9 |
| 224 | Gilroy | 10.8 | 24.6 | 59.1 |
| 225 | Malibu | 7.8 | 32.5 | 59.4 |
| 226 | Redlands | 10.6 | 29.3 | 60.0 |
| 227 | South El Monte | 9.4 | 24.0 | 60.2 |
| 228 | Burlingame | 8.5 | 38.6 | 60.4 |
| 229 | San Rafael | 10.8 | 28.7 | 60.6 |
| 230 | Yuba City | 14.1 | 27.1 | 61.1 |
| 231 | Santa Barbara | 13.5 | 23.1 | 61.6 |
| 232 | Watsonville | 10.7 | 17.9 | 61.7 |
| 233 | Mendota | 10.1 | 13.6 | 61.8 |
| 234 | West Sacramento | 10.4 | 29.5 | 61.9 |
| 235 | California City | 10.4 | 19.6 | 62.3 |
| 236 | Monterey | 12.7 | 34.4 | 62.4 |
| 237 | Highland | 11.9 | 16.3 | 62.6 |
| 238 | Pleasant Hill | 7.0 | 42.2 | 63.0 |
| 239 | Rohnert Park | 12.3 | 17.8 | 63.4 |
| 240 | National City | 14.2 | 18.2 | 63.5 |
| 241 | Lynwood | 10.0 | 20.1 | 63.6 |
| 242 | Hemet | 9.7 | 33.4 | 64.4 |
| 243 | Hawthorne | 9.6 | 17.0 | 64.7 |
| 244 | Madera | 18.4 | 19.6 | 65.3 |
| 245 | Yucca Valley | 14.0 | 13.4 | 65.7 |
| 246 | Indio | 15.2 | 20.3 | 66.0 |
| 247 | South Lake Tahoe | 18.9 | 20.3 | 66.5 |
| 248 | Pinole | 6.4 | 44.5 | 66.5 |
| 249 | Paramount | 10.5 | 22.9 | 66.8 |
| 250 | Arcata | 11.5 | 33.0 | 66.9 |
| 251 | Beverly Hills | 7.3 | 43.8 | 67.0 |
| 252 | Tehachapi | 13.9 | 26.9 | 68.6 |
| 253 | Pittsburg | 13.3 | 22.5 | 68.9 |
| 254 | Dinuba | 14.1 | 21.5 | 69.2 |
| 255 | Chico | 11.1 | 25.1 | 69.4 |
| 256 | Culver City | 5.3 | 42.0 | 70.6 |
| 257 | Adelanto | 15.2 | 13.3 | 70.9 |
| 258 | Lemon Grove | 19.1 | 20.3 | 71.0 |
| 259 | El Segundo | 8.3 | 37.4 | 71.3 |
| 260 | South Gate | 9.8 | 29.2 | 72.9 |
| 261 | San Luis Obispo | 12.8 | 36.4 | 73.0 |
| 262 | Blythe | 17.5 | 32.4 | 74.5 |
| 263 | Ukiah | 20.0 | 18.4 | 74.8 |
| 264 | Redding | 14.0 | 30.6 | 75.3 |
| 265 | Turlock | 14.0 | 31.3 | 75.7 |
| 266 | Merced | 13.8 | 27.9 | 75.8 |
| 267 | San Pablo | 12.7 | 32.2 | 77.0 |
| 268 | Arvin | 11.6 | 20.0 | 77.6 |
| 269 | Capitola | 10.6 | 52.3 | 78.9 |
| 270 | Anderson | 14.5 | 34.4 | 80.1 |
| 271 | Montclair | 10.2 | 36.9 | 80.3 |
| 272 | Lompoc | 18.4 | 24.7 | 80.4 |
| 273 | San Leandro | 9.6 | 45.5 | 81.0 |
| 274 | Huntington Park | 13.2 | 27.4 | 82.3 |
| 275 | Desert Hot Springs | 13.7 | 23.4 | 83.4 |
| 276 | Atwater | 13.6 | 34.8 | 84.6 |
| 277 | Palm Springs | 14.8 | 40.2 | 86.1 |
| 278 | Grass Valley | 22.1 | 35.8 | 87.1 |
| 279 | El Cerrito | 9.2 | 50.3 | 89.6 |
| 280 | Santa Cruz | 14.1 | 44.9 | 90.6 |
| 281 | Clearlake | 19.5 | 29.9 | 93.2 |
| 282 | Compton | 16.1 | 24.3 | 99.9 |
| 283 | Oroville | 20.3 | 42.7 | 100.1 |
| 284 | Santa Monica | 19.2 | 43.3 | 100.6 |
| 285 | Santa Fe Springs | 11.8 | 57.4 | 100.9 |
| 286 | Susanville | 20.4 | 13.9 | 102.1 |
| 287 | Eureka | 20.1 | 50.1 | 111.0 |
| 288 | Signal Hill | 13.2 | 58.3 | 112.7 |
| 289 | West Hollywood | 21.0 | 51.1 | 114.2 |
| 290 | Marysville | 30.2 | 43.0 | 126.4 |
| 291 | Barstow | 29.2 | 40.9 | 129.4 |
| 292 | Red Bluff | 37.9 | 55.0 | 146.9 |
| 293 | Commerce | 17.7 | 78.4 | 151.9 |
| 294 | Emeryville | 27.9 | 211.9 | 310.7 |
Safest Small Cities in California
The #1 safest small city in California was Monte Sereno. This tony city of under 4,000 residents is located in the San Jose metropolitan area, nestled between the cities of Los Gatos and Saratoga in the foothills of the Santa Cruz Mountains. The city has no commercial real estate and consists almost entirely of single-family houses. Monte Sereno serves as a bedroom community for Silicon Valley, and the city was once home to author John Steinbeck, who wrote The Grapes of Wrath and completed Of Mice and Men while living there.
The following table lists the safest small cities in California with under 10,000 residents. For each city, the level of violent crime and property crime per 1,000 residents is included, as well as the city’s rank and the crime score we calculated for the city. Crime scores for small cities ranged from 5 to 8,248, with an average of 212 for small cities.
| Rank | City | Violent Crimes per 1,000 Residents | Property Crimes per 1,000 Residents | Crime Score |
|---|---|---|---|---|
| 1 | Monte Sereno | 0.8 | 4.6 | 5.3 |
| 2 | Tiburon | 1.5 | 9.0 | 10.5 |
| 3 | Los Altos Hills | 1.5 | 7.8 | 11.5 |
| 4 | Hughson | 3.9 | 6.0 | 13.2 |
| 5 | Rolling Hills | 1.8 | 7.3 | 13.8 |
| 6 | Belvedere | 1.9 | 9.5 | 14.5 |
| 7 | Villa Park | 3.8 | 7.7 | 14.9 |
| 8 | Kensington | 0.9 | 8.9 | 15.2 |
| 9 | Ross | 2.8 | 10.1 | 17.0 |
| 10 | Buellton | 5.4 | 10.5 | 18.9 |
| 11 | Ione | 6.6 | 5.9 | 20.1 |
| 12 | La Habra Heights | 2.1 | 14.7 | 20.5 |
| 13 | Orange Cove | 5.7 | 6.3 | 21.4 |
| 14 | Lake Shastina | 2.3 | 7.8 | 21.8 |
| 15 | Wheatland | 4.1 | 10.9 | 22.6 |
| 16 | Calistoga | 4.5 | 13.3 | 23.4 |
| 17 | Holtville | 3.2 | 10.3 | 24.5 |
| 18 | Rolling Hills Estates | 2.6 | 15.5 | 25.3 |
| 19 | Gonzales | 6.3 | 8.7 | 25.6 |
| 20 | Fairfax | 6.1 | 12.2 | 25.8 |
| 21 | Firebaugh | 6.3 | 12.2 | 26.0 |
| 22 | Ojai | 9.1 | 9.9 | 26.9 |
| 23 | Hidden Hills | 2.7 | 16.2 | 27.0 |
| 24 | St. Helena | 6.0 | 10.8 | 27.1 |
| 25 | Rio Vista | 6.0 | 14.7 | 27.4 |
| 26 | Yountville | 5.0 | 14.1 | 27.4 |
| 27 | Atherton | 3.0 | 15.2 | 27.7 |
| 28 | Solvang | 8.4 | 11.4 | 28.2 |
| 29 | Bear Valley | 3.4 | 8.7 | 28.5 |
| 30 | Colusa | 8.0 | 13.2 | 29.0 |
| 31 | Cloverdale | 6.6 | 13.0 | 29.1 |
| 32 | Winters | 6.6 | 15.6 | 29.7 |
| 33 | Waterford | 6.4 | 15.9 | 29.9 |
| 34 | Guadalupe | 8.8 | 10.7 | 30.3 |
| 35 | Biggs | 5.6 | 11.8 | 30.6 |
| 36 | Bradbury | 3.7 | 18.4 | 31.2 |
| 37 | Sutter Creek | 7.6 | 16.8 | 31.6 |
| 38 | Stallion Springs | 5.9 | 8.6 | 34.0 |
| 39 | Angels Camp | 6.7 | 18.9 | 35.3 |
| 40 | Ferndale | 4.4 | 17.6 | 36.7 |
| 41 | Del Mar | 10.3 | 15.3 | 36.9 |
| 42 | Broadmoor | 4.5 | 18.4 | 37.1 |
| 43 | Westlake Village | 4.3 | 22.7 | 37.2 |
| 44 | Woodlake | 5.9 | 11.5 | 37.6 |
| 45 | Escalon | 10.1 | 17.7 | 38.7 |
| 46 | Tulelake | 9.5 | 5.4 | 40.6 |
| 47 | Indian Wells | 5.1 | 25.1 | 42.7 |
| 48 | Sausalito | 2.8 | 36.2 | 44.0 |
| 49 | Mount Shasta | 13.7 | 10.7 | 44.0 |
| 50 | Avalon | 18.3 | 10.7 | 44.6 |
| 51 | Fowler | 6.8 | 15.1 | 44.6 |
| 52 | Brisbane | 5.3 | 28.9 | 46.4 |
| 53 | Williams | 11.6 | 14.2 | 46.7 |
| 54 | Carmel | 7.7 | 26.6 | 48.5 |
| 55 | Sebastopol | 11.1 | 22.6 | 48.8 |
| 56 | Calimesa | 6.2 | 30.9 | 49.2 |
| 57 | Alturas | 14.2 | 12.1 | 49.8 |
| 58 | Gustine | 13.2 | 19.7 | 52.1 |
| 59 | Cotati | 10.5 | 12.4 | 52.7 |
| 60 | Willits | 16.6 | 18.6 | 53.1 |
| 61 | Rio Dell | 16.8 | 18.0 | 53.4 |
| 62 | Orland | 13.0 | 17.5 | 54.0 |
| 63 | Del Rey Oaks | 7.2 | 25.4 | 55.4 |
| 64 | Mammoth Lakes | 7.9 | 16.1 | 57.3 |
| 65 | Yreka | 11.2 | 31.5 | 61.2 |
| 66 | Dorris | 22.7 | 14.7 | 64.2 |
| 67 | Nevada City | 7.3 | 28.3 | 64.4 |
| 68 | Etna | 20.1 | 0.0 | 67.0 |
| 69 | Pismo Beach | 8.7 | 41.2 | 67.4 |
| 70 | Corning | 19.5 | 28.0 | 69.3 |
| 71 | Jackson | 13.6 | 27.7 | 75.0 |
| 72 | Montague | 20.7 | 22.9 | 75.1 |
| 73 | Taft | 11.2 | 25.9 | 75.2 |
| 74 | Gridley | 16.9 | 31.0 | 78.9 |
| 75 | Huron | 15.6 | 7.6 | 80.2 |
| 76 | Fort Bragg | 17.6 | 42.9 | 85.0 |
| 77 | Dunsmuir | 18.5 | 11.5 | 85.0 |
| 78 | Crescent City | 21.6 | 46.3 | 86.2 |
| 79 | Isleton | 18.8 | 6.3 | 86.4 |
| 80 | Lakeport | 17.9 | 32.3 | 86.9 |
| 81 | Fort Jones | 10.4 | 59.1 | 93.9 |
| 82 | Dos Palos | 18.4 | 30.2 | 105.8 |
| 83 | Weed | 24.3 | 20.6 | 113.0 |
| 84 | Sonora | 33.9 | 55.3 | 120.8 |
| 85 | Bishop | 24.7 | 49.0 | 128.9 |
| 86 | Big Bear | 34.1 | 25.4 | 136.3 |
| 87 | Needles | 34.6 | 34.8 | 144.4 |
| 88 | Irwindale | 27.9 | 163.4 | 282.5 |
| 89 | Sand City | 36.9 | 189.2 | 336.6 |
| 90 | Colma | 32.4 | 214.9 | 339.9 |
| 91 | Vernon | 616.1 | 4330.4 | 6187.5 |
| 92 | Industry | 567.2 | 5870.6 | 8248.8 |
Methodology
In this analysis, AdvisorSmith used published data on reported crimes in the state of California provided by the Federal Bureau of Investigation for the calendar year 2019. In these crime reports, which are reported on Return A by cities and law enforcement agencies in the state of California, the levels of violent and property crimes in each city are compiled. Crime reports include statistics on reported crimes such as murder, rape, robbery, assault, larceny, motor vehicle theft, and burglary. These datasets are released as part of the Uniform Crime Reporting Statistics.
To find the safest cities in California, we calculated a crime score for each city that reported at least two months of crime data. We assigned a multiplier to each type of crime to account for the severity of each crime, and we then multiplied the number of reported crimes by the respective multiplier. We then added the multiplied level of crimes and adjusted this crime level for the number of months reported and the population of each city.
We segmented California cities into three groups based on population size. Cities with under 10,000 residents were considered to be small cities. Cities with between 10,000 and 100,000 residents were labeled midsize cities, and cities with over 100,000 residents were labeled large cities. We ranked cities within their population groups in order to determine the safest small, midsize, and large cities in the state.
Sources
- Federal Bureau of Investigation, Uniform Crime Reporting, Return A, 2019