


All Americans have an interest in living in safe communities, and the crime rate in a locale is an important determinant in everything from rent prices to individual decisions to live in and move to a community. Additionally, knowing which neighborhoods are safe is an important variable for small business owners when deciding where to start and expand a business. AdvisorSmith studied crime data from a federal database to determine the safest cities in the United States by city size.
Below are links to the safest small, midsize, and large cities:
The Cost of Crime
For consumers and businesses alike, crime and a lack of safety in a neighborhood can exact a significant toll on daily lives. For the consumer, this can equate to decreases in home values, increases in insurance costs, and more. For businesses, crimes such as shoplifting, robbery, vandalism, theft, and fraud, end up costing U.S. businesses billions of dollars each year. As crime rates increase, so do costs for insurance coverage, including commercial property, commercial crime, and cyber insurance. Studies have shown that the average annual cost of crime prevention for small businesses is over $12,000, while the annual average crime loss is over $14,000.
In this study, we used the most recently available data from the FBI, released in September 2021, which includes crimes committed during the calendar year 2020. Crimes considered in this report include violent crimes such as robbery, assault, rape, and murder, as well as property crimes including burglary, larceny, and motor vehicle theft. We created a proprietary crime score, which weights different types of crimes based upon the severity of the crime, with violent crimes weighted more highly.
Cities were divided into categories based on their population. We excluded towns with populations under 10,000. Cities with populations of less than 100,000 were labeled as small cities, while cities with populations of 100,000 to 300,000 were considered midsize cities. Any cities with populations over 300,000 were labeled large cities. This study included 2,837 small cities, 219 midsize cities, and 59 large cities, for a total of 3,115 cities.
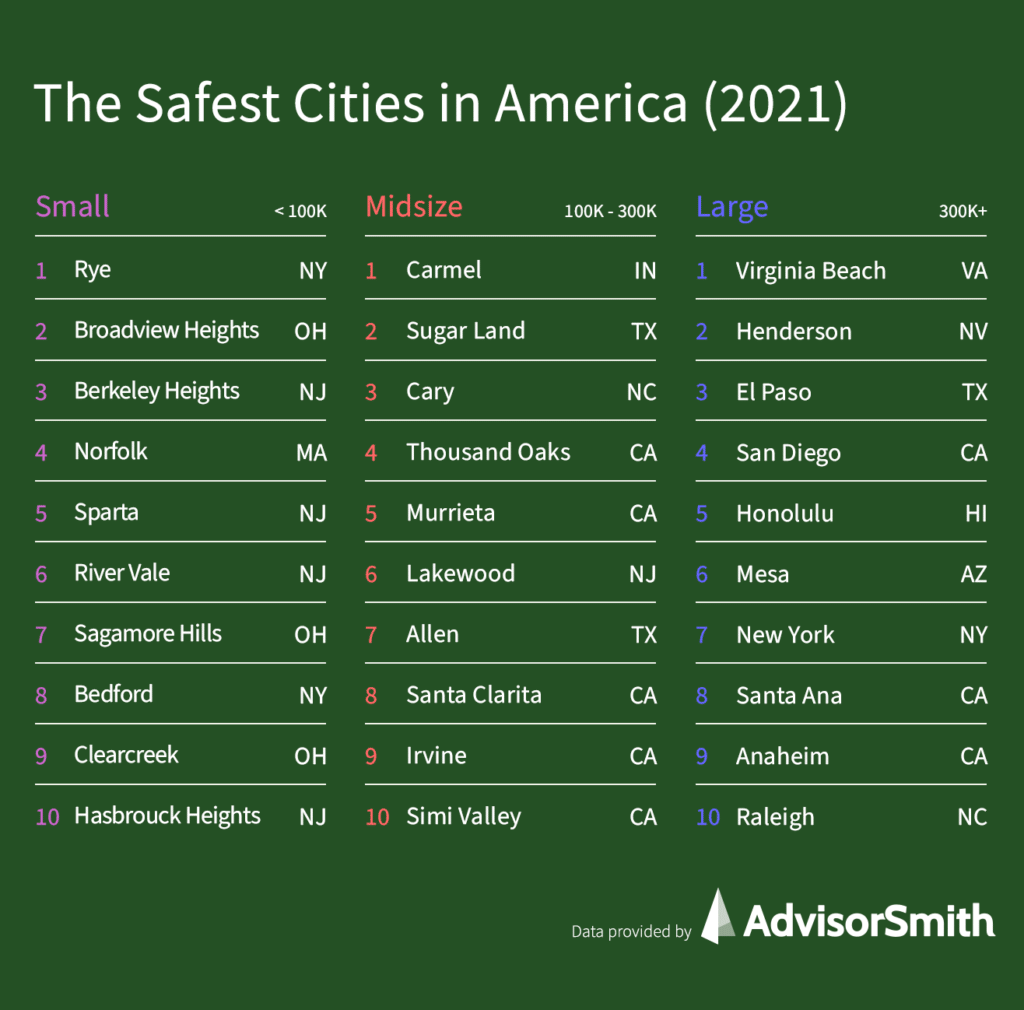
What are the safest U.S. cities?
Rye, New York, was the safest small city in the United States. Located in Westchester County, just north of New York City, Rye was incorporated in 1942, making it the youngest city in the state of New York. The city is known for its waterfront, which abuts the Long Island Sound near the New York-Connecticut border. Among the top 20 small cities, nine were in New Jersey, four in Ohio, three in New York, two in Massachusetts, and one in each of Connecticut and Michigan.
Carmel, Indiana, was the safest midsize city in the United States. Carmel is a suburb in the Indianapolis metropolitan area and is known as the roundabout capital of the United States due to its numerous roundabouts. The city has a median household income that exceeds six figures. Of the top 10 midsize cities, five were in California, two were in Texas, and Indiana, North Carolina, and New Jersey each had one city.
The safest large city in the United States in our study was Virginia Beach, Virginia. This mostly suburban coastal city has the world’s longest pleasure beach, which contributes to the city’s tourism economy. Three of the safest large cities in the top 10 were cities in California.

Safest Small Cities in America
| Rank | City | State | Population | Violent crimes per 1k people | Property crimes per 1k people | Crime score |
|---|---|---|---|---|---|---|
| 1 | Rye | NY | 15,692 | 0.3 | 1.5 | 1.8 |
| 2 | Broadview Heights | OH | 19,059 | 0.3 | 1.3 | 2.3 |
| 3 | Berkeley Heights | NJ | 13,371 | 0.1 | 2.8 | 2.9 |
| 4 | Norfolk | MA | 12,068 | 0.9 | 1.2 | 3.1 |
| 5 | Sparta | NJ | 18,467 | 1.2 | 1.0 | 3.2 |
| 6 | River Vale | NJ | 10,007 | 0.0 | 3.3 | 3.3 |
| 7 | Sagamore Hills | OH | 10,917 | 0.6 | 2.7 | 3.4 |
| 8 | Bedford | NY | 17,672 | 0.5 | 2.4 | 3.4 |
| 9 | Clearcreek | OH | 16,312 | 0.5 | 2.2 | 3.4 |
| 10 | Hasbrouck Heights | NJ | 11,988 | 0.8 | 2.9 | 3.7 |
| 11 | Franklin | MA | 34,281 | 1.8 | 0.9 | 3.7 |
| 12 | Olmsted | OH | 13,478 | 1.0 | 2.7 | 3.7 |
| 13 | Sleepy Hollow | NY | 10,064 | 1.0 | 2.9 | 3.8 |
| 14 | Bernards | NJ | 27,130 | 0.8 | 3.0 | 3.8 |
| 15 | Robbinsville | NJ | 14,628 | 0.2 | 3.1 | 4.0 |
| 16 | Warren | NJ | 15,689 | 0.1 | 3.6 | 4.1 |
| 17 | Weston | CT | 10,258 | 0.9 | 3.2 | 4.1 |
| 18 | Grosse Ile | MI | 10,114 | 1.5 | 2.0 | 4.1 |
| 19 | Ringwood | NJ | 12,177 | 1.3 | 2.1 | 4.2 |
| 20 | Chatham | NJ | 10,071 | 0.1 | 4.2 | 4.3 |
| 21 | Woolwich | NJ | 13,278 | 0.4 | 3.5 | 4.3 |
| 22 | Medway | MA | 13,534 | 1.1 | 0.8 | 4.3 |
| 23 | Weston | MA | 12,146 | 1.1 | 2.9 | 4.4 |
| 24 | Monroe | NJ | 45,653 | 0.9 | 2.5 | 4.4 |
| 25 | Carmel | NY | 34,093 | 0.4 | 3.3 | 4.4 |
| 26 | Westford | MA | 25,011 | 1.2 | 2.4 | 4.4 |
| 27 | Hillsdale | NJ | 10,308 | 0.3 | 4.1 | 4.4 |
| 28 | Madison | CT | 18,004 | 0.2 | 4.1 | 4.5 |
| 29 | Hopkinton | MA | 18,806 | 1.8 | 1.5 | 4.6 |
| 30 | Hanover | MA | 15,143 | 0.4 | 3.6 | 4.7 |
| 31 | Clinton | MA | 13,967 | 1.7 | 0.7 | 4.8 |
| 32 | Holden | MA | 19,412 | 1.8 | 1.1 | 4.8 |
| 33 | Dyer | IN | 15,932 | 1.3 | 3.2 | 4.8 |
| 34 | Denville | NJ | 16,400 | 0.9 | 3.4 | 4.9 |
| 35 | Long Beach | NY | 33,461 | 1.6 | 1.4 | 4.9 |
| 36 | Stony Point | NY | 15,338 | 1.0 | 2.9 | 5.0 |
| 37 | Glen Rock | NJ | 11,705 | 0.4 | 4.1 | 5.0 |
| 38 | New Castle | NY | 17,824 | 0.7 | 4.3 | 5.0 |
| 39 | Glen Cove | NY | 27,186 | 0.6 | 3.9 | 5.0 |
| 40 | Westwood | NJ | 11,079 | 0.0 | 5.1 | 5.1 |
| 41 | Newtown | CT | 27,924 | 0.6 | 3.3 | 5.1 |
| 42 | Randolph | NJ | 25,311 | 1.2 | 3.7 | 5.1 |
| 43 | Ridgefield | CT | 24,990 | 0.7 | 3.9 | 5.2 |
| 44 | Frederick | CO | 14,712 | 0.7 | 3.3 | 5.2 |
| 45 | Kent | NY | 13,123 | 2.1 | 2.8 | 5.3 |
| 46 | Springboro | OH | 17,727 | 1.9 | 1.5 | 5.4 |
| 47 | Mahwah | NJ | 26,201 | 0.6 | 3.8 | 5.5 |
| 48 | Avon Lake | OH | 24,724 | 2.3 | 2.3 | 5.5 |
| 49 | Roxbury | NJ | 22,439 | 1.3 | 3.8 | 5.6 |
| 50 | Shrewsbury | MA | 38,656 | 1.4 | 3.6 | 5.6 |
| 51 | Vernon | NJ | 21,819 | 1.3 | 4.1 | 5.6 |
| 52 | Sharon | MA | 19,011 | 1.5 | 1.8 | 5.6 |
| 53 | Cranford | NJ | 24,186 | 0.2 | 4.7 | 5.7 |
| 54 | Dumont | NJ | 17,507 | 0.6 | 3.0 | 5.9 |
| 55 | Brecksville | OH | 13,591 | 1.0 | 4.2 | 6.0 |
| 56 | Jefferson | NJ | 20,626 | 1.5 | 2.5 | 6.0 |
| 57 | Plattekill | NY | 10,168 | 2.6 | 3.4 | 6.0 |
| 58 | Shawangunk | NY | 13,782 | 1.5 | 2.8 | 6.0 |
| 59 | Raritan | NJ | 22,402 | 1.4 | 3.3 | 6.1 |
| 60 | Fulshear | TX | 14,094 | 0.7 | 4.3 | 6.1 |
| 61 | Trophy Club | TX | 12,539 | 2.1 | 4.1 | 6.2 |
| 62 | Oakland | MI | 19,882 | 1.8 | 1.3 | 6.2 |
| 63 | New Providence | NJ | 13,741 | 1.2 | 4.0 | 6.3 |
| 64 | Rexburg | ID | 29,865 | 1.4 | 3.4 | 6.4 |
| 65 | St. John | IN | 19,289 | 1.2 | 4.1 | 6.5 |
| 66 | Lindenhurst | IL | 14,174 | 0.4 | 2.9 | 6.6 |
| 67 | Florham Park | NJ | 11,455 | 0.3 | 5.8 | 6.6 |
| 68 | Lexington | MA | 33,138 | 1.4 | 3.4 | 6.6 |
| 69 | Middleton | MA | 10,189 | 1.9 | 2.8 | 6.7 |
| 70 | Wanaque | NJ | 11,828 | 2.5 | 2.1 | 6.7 |
| 71 | Zionsville | IN | 28,824 | 1.2 | 3.0 | 6.7 |
| 72 | Canton | CT | 10,249 | 0.5 | 5.8 | 6.7 |
| 73 | Mamaroneck | NY | 12,017 | 0.0 | 6.7 | 6.7 |
| 74 | Palos Hills | IL | 17,013 | 0.8 | 2.2 | 6.8 |
| 75 | East Pennsboro | PA | 21,556 | 1.7 | 2.0 | 6.9 |
| 76 | Harrison | NY | 29,110 | 1.5 | 4.3 | 6.9 |
| 77 | Waldwick | NJ | 10,156 | 0.4 | 5.5 | 6.9 |
| 78 | North Ridgeville | OH | 34,972 | 1.6 | 3.1 | 6.9 |
| 79 | Bristol | RI | 21,748 | 2.4 | 3.2 | 6.9 |
| 80 | Tenafly | NJ | 14,427 | 0.7 | 4.5 | 6.9 |
| 81 | Hamburg | MI | 21,867 | 3.0 | 1.5 | 7.0 |
| 82 | Milton | MA | 27,600 | 0.8 | 3.8 | 7.0 |
| 83 | Imperial | CA | 18,528 | 1.6 | 3.0 | 7.0 |
| 84 | Montgomery | NJ | 23,268 | 1.3 | 3.6 | 7.0 |
| 85 | Bergenfield | NJ | 27,347 | 1.6 | 3.1 | 7.0 |
| 86 | Powell | OH | 13,593 | 1.3 | 5.7 | 7.1 |
| 87 | Homer Glen | IL | 24,497 | 0.3 | 4.8 | 7.1 |
| 88 | Scituate | RI | 10,739 | 2.0 | 3.6 | 7.1 |
| 89 | Kennebunk | ME | 11,719 | 2.6 | 4.5 | 7.2 |
| 90 | Plainsboro | NJ | 22,847 | 1.3 | 3.9 | 7.2 |
| 91 | Hampden | PA | 31,034 | 1.7 | 3.1 | 7.2 |
| 92 | Readington | NJ | 15,813 | 1.6 | 4.9 | 7.3 |
| 93 | Goshen | IN | 34,409 | 2.0 | 3.0 | 7.4 |
| 94 | Eastchester | NY | 19,991 | 0.4 | 6.8 | 7.4 |
| 95 | Hamilton | OH | 24,081 | 2.9 | 2.7 | 7.5 |
| 96 | Verona | NJ | 13,368 | 0.1 | 6.7 | 7.5 |
| 97 | West Milford | NJ | 26,310 | 1.6 | 3.5 | 7.5 |
| 98 | Wellesley | MA | 28,687 | 1.2 | 3.8 | 7.6 |
| 99 | Winchester | MA | 22,827 | 0.7 | 4.3 | 7.6 |
| 100 | Norton | MA | 19,932 | 1.5 | 0.2 | 7.6 |
Safest Midsize Cities in America
| Rank | City | State | Population | Violent crimes per 1k people | Property crimes per 1k people | Crime score |
|---|---|---|---|---|---|---|
| 1 | Carmel | IN | 103,100 | 2.1 | 5.9 | 11.0 |
| 2 | Sugar Land | TX | 119,671 | 3.0 | 10.7 | 17.0 |
| 3 | Cary | NC | 172,079 | 3.9 | 9.6 | 17.2 |
| 4 | Thousand Oaks | CA | 126,823 | 4.0 | 10.4 | 18.1 |
| 5 | Murrieta | CA | 117,639 | 3.7 | 10.2 | 18.7 |
| 6 | Lakewood | NJ | 108,023 | 4.5 | 8.1 | 18.9 |
| 7 | Allen | TX | 108,218 | 4.2 | 9.2 | 19.2 |
| 8 | Santa Clarita | CA | 221,932 | 4.0 | 9.1 | 20.5 |
| 9 | Irvine | CA | 297,069 | 3.9 | 15.0 | 21.9 |
| 10 | Simi Valley | CA | 125,742 | 4.3 | 10.5 | 22.4 |
| 11 | Woodbridge | NJ | 100,119 | 4.0 | 12.3 | 23.3 |
| 12 | Mckinney | TX | 208,335 | 6.2 | 9.4 | 23.4 |
| 13 | Gilbert | AZ | 259,629 | 7.8 | 10.8 | 24.9 |
| 14 | Meridian | ID | 119,203 | 6.9 | 8.4 | 25.0 |
| 15 | Glendale | CA | 200,168 | 4.0 | 16.0 | 25.5 |
| 16 | Amherst | NY | 121,304 | 5.3 | 15.4 | 27.6 |
| 17 | Sandy Springs | GA | 111,219 | 6.1 | 13.8 | 28.0 |
| 18 | Sterling Heights | MI | 132,745 | 10.0 | 8.6 | 28.5 |
| 19 | Centennial | CO | 112,104 | 4.3 | 17.7 | 28.6 |
| 20 | Orange | CA | 138,846 | 4.3 | 17.3 | 28.6 |
| 21 | Pearland | TX | 119,634 | 8.0 | 15.0 | 29.4 |
| 22 | Daly City | CA | 106,855 | 5.8 | 13.7 | 29.6 |
| 23 | Surprise | AZ | 144,620 | 7.9 | 13.9 | 30.0 |
| 24 | League City | TX | 108,478 | 9.3 | 13.8 | 30.3 |
| 25 | Elk Grove | CA | 177,331 | 4.7 | 13.4 | 30.5 |
| 26 | Temecula | CA | 116,442 | 4.5 | 19.4 | 30.7 |
| 27 | Frisco | TX | 130,768 | 7.5 | 15.8 | 31.5 |
| 28 | Plano | TX | 284,611 | 5.8 | 16.8 | 32.0 |
| 29 | Carlsbad | CA | 116,516 | 6.1 | 15.8 | 32.4 |
| 30 | Corona | CA | 171,848 | 3.9 | 21.0 | 32.7 |
| 31 | Sunnyvale | CA | 154,133 | 3.8 | 20.6 | 32.8 |
| 32 | Yonkers | NY | 200,816 | 6.5 | 9.9 | 33.6 |
| 33 | Round Rock | TX | 135,776 | 9.7 | 16.8 | 34.2 |
| 34 | Bend | OR | 103,485 | 6.1 | 18.9 | 34.5 |
| 35 | Ann Arbor | MI | 120,647 | 7.5 | 13.2 | 34.6 |
| 36 | Torrance | CA | 143,421 | 4.1 | 20.5 | 35.5 |
| 37 | Stamford | CT | 130,425 | 11.1 | 12.6 | 35.5 |
| 38 | Fort Collins | CO | 173,274 | 6.3 | 18.7 | 36.1 |
| 39 | West Covina | CA | 104,989 | 4.4 | 21.1 | 36.2 |
| 40 | Scottsdale | AZ | 263,006 | 7.1 | 18.8 | 36.6 |
| 41 | Fontana | CA | 216,553 | 8.4 | 11.6 | 36.8 |
| 42 | Roseville | CA | 144,128 | 6.9 | 19.7 | 36.8 |
| 43 | Mcallen | TX | 144,569 | 12.2 | 19.3 | 37.1 |
| 44 | Chula Vista | CA | 278,027 | 7.9 | 11.7 | 37.1 |
| 45 | Fremont | CA | 244,259 | 5.0 | 23.4 | 37.2 |
| 46 | Clovis | CA | 116,809 | 6.1 | 20.0 | 37.7 |
| 47 | Burbank | CA | 102,419 | 4.9 | 24.2 | 38.0 |
| 48 | Alexandria | VA | 161,525 | 11.2 | 17.3 | 38.0 |
| 49 | Vacaville | CA | 101,616 | 7.5 | 17.3 | 38.6 |
| 50 | Santa Clara | CA | 131,976 | 4.9 | 25.0 | 38.9 |
| 51 | El Monte | CA | 115,690 | 7.1 | 15.3 | 39.2 |
| 52 | College Station | TX | 120,831 | 9.3 | 19.0 | 39.2 |
| 53 | Olathe | KS | 142,228 | 12.0 | 13.6 | 39.5 |
| 54 | Peoria | AZ | 178,486 | 9.9 | 15.0 | 39.7 |
| 55 | Hillsboro | OR | 111,146 | 6.9 | 19.3 | 39.8 |
| 56 | Jurupa Valley | CA | 111,198 | 5.8 | 21.1 | 40.1 |
| 57 | Rancho Cucamonga | CA | 178,916 | 5.7 | 18.2 | 40.4 |
| 58 | Chandler | AZ | 264,071 | 9.6 | 18.5 | 40.5 |
| 59 | Beaverton | OR | 100,085 | 5.4 | 22.0 | 40.6 |
| 60 | Overland Park | KS | 198,036 | 9.9 | 19.7 | 40.9 |
| 61 | Downey | CA | 111,054 | 7.1 | 19.4 | 40.9 |
| 62 | Naperville | IL | 100,087 | 1.0 | 34.5 | 41.2 |
| 63 | Vista | CA | 102,600 | 11.5 | 11.7 | 41.3 |
| 64 | Huntington Beach | CA | 200,128 | 8.0 | 19.6 | 41.4 |
| 65 | Bellevue | WA | 150,548 | 5.7 | 30.1 | 42.2 |
| 66 | Rochester | MN | 120,336 | 8.2 | 19.2 | 42.5 |
| 67 | Cambridge | MA | 119,938 | 9.2 | 18.3 | 42.6 |
| 68 | San Mateo | CA | 105,246 | 6.1 | 21.9 | 42.8 |
| 69 | Pasadena | CA | 141,473 | 6.4 | 21.4 | 44.0 |
| 70 | Jersey City | NJ | 263,273 | 6.7 | 15.0 | 45.0 |
| 71 | Laredo | TX | 265,515 | 12.9 | 14.4 | 45.1 |
| 72 | Boise | ID | 231,223 | 11.1 | 16.4 | 45.2 |
| 73 | Garden Grove | CA | 171,698 | 6.6 | 22.9 | 45.6 |
| 74 | Kenosha | WI | 100,005 | 10.0 | 14.4 | 45.7 |
| 75 | Lowell | MA | 110,876 | 14.8 | 14.7 | 46.0 |
| 76 | Norwalk | CA | 103,774 | 7.1 | 17.1 | 46.3 |
| 77 | Lewisville | TX | 109,576 | 11.7 | 17.8 | 47.1 |
| 78 | Nampa | ID | 101,411 | 11.1 | 16.4 | 47.2 |
| 79 | Joliet | IL | 136,687 | 5.3 | 14.0 | 47.6 |
| 80 | Escondido | CA | 152,446 | 10.9 | 17.7 | 48.7 |
| 81 | Oxnard | CA | 210,064 | 9.0 | 20.6 | 49.0 |
| 82 | West Jordan | UT | 117,955 | 10.9 | 25.3 | 50.1 |
| 83 | Aurora | IL | 130,539 | 5.0 | 17.5 | 50.2 |
| 84 | Ontario | CA | 187,464 | 8.6 | 21.3 | 50.2 |
| 85 | Palmdale | CA | 155,321 | 11.0 | 13.7 | 50.3 |
| 86 | Clinton | MI | 100,884 | 16.9 | 12.2 | 50.4 |
| 87 | Fullerton | CA | 139,011 | 9.7 | 24.0 | 50.6 |
| 88 | Arvada | CO | 119,700 | 6.2 | 32.5 | 51.4 |
| 89 | Denton | TX | 144,569 | 13.1 | 21.9 | 51.7 |
| 90 | Moreno Valley | CA | 215,257 | 8.7 | 23.8 | 52.7 |
| 91 | Madison | WI | 262,736 | 7.7 | 27.8 | 52.8 |
| 92 | Norman | OK | 126,480 | 11.1 | 25.8 | 52.8 |
| 93 | Oceanside | CA | 176,616 | 12.9 | 18.0 | 52.9 |
| 94 | Santa Rosa | CA | 176,932 | 9.8 | 16.0 | 54.2 |
| 95 | Garland | TX | 241,455 | 14.0 | 25.3 | 54.9 |
| 96 | Hampton | VA | 134,082 | 15.4 | 24.9 | 55.3 |
| 97 | Ventura | CA | 109,295 | 11.6 | 28.2 | 56.1 |
| 98 | Edinburg | TX | 103,491 | 14.8 | 22.3 | 56.1 |
| 99 | Concord | CA | 130,074 | 10.1 | 29.1 | 56.7 |
| 100 | Warren | MI | 133,928 | 14.0 | 14.5 | 56.7 |
Safest Large Cities in America
| Rank | City | State | Population | Violent crimes per 1k people | Property crimes per 1k people | Crime score |
|---|---|---|---|---|---|---|
| 1 | Virginia Beach | VA | 450,858 | 10.2 | 15.1 | 30.9 |
| 2 | Henderson | NV | 328,056 | 10.7 | 14.3 | 36.8 |
| 3 | El Paso | TX | 685,288 | 11.4 | 12.4 | 41.3 |
| 4 | San Diego | CA | 1,437,608 | 8.8 | 16.9 | 45.7 |
| 5 | Honolulu | HI | 966,438 | 9.6 | 26.4 | 50.0 |
| 6 | Mesa | AZ | 527,361 | 12.0 | 18.5 | 51.0 |
| 7 | New York | NY | 8,300,377 | 5.8 | 15.6 | 51.6 |
| 8 | Santa Ana | CA | 333,107 | 10.3 | 20.8 | 54.5 |
| 9 | Anaheim | CA | 351,913 | 10.7 | 25.2 | 55.2 |
| 10 | Raleigh | NC | 480,964 | 14.0 | 20.3 | 55.5 |
| 11 | San Jose | CA | 1,029,542 | 10.2 | 23.2 | 57.0 |
| 12 | Lexington | KY | 325,851 | 15.8 | 28.7 | 63.1 |
| 13 | Riverside | CA | 334,370 | 13.7 | 29.8 | 67.9 |
| 14 | Long Beach | CA | 462,654 | 14.8 | 27.5 | 70.0 |
| 15 | Boston | MA | 697,323 | 20.8 | 18.7 | 72.1 |
| 16 | Fort Worth | TX | 919,789 | 14.8 | 27.6 | 72.2 |
| 17 | Las Vegas | NV | 1,693,061 | 24.2 | 22.1 | 75.5 |
| 18 | Los Angeles | CA | 4,000,587 | 15.9 | 21.5 | 75.8 |
| 19 | Arlington | TX | 402,700 | 21.9 | 25.5 | 76.6 |
| 20 | Sacramento | CA | 519,050 | 14.8 | 27.5 | 77.7 |
| 21 | Colorado Springs | CO | 485,083 | 11.6 | 33.8 | 78.8 |
| 22 | Bakersfield | CA | 388,265 | 12.4 | 40.2 | 80.1 |
| 23 | San Francisco | CA | 881,514 | 9.9 | 43.9 | 82.2 |
| 24 | Fresno | CA | 535,472 | 16.6 | 30.8 | 82.2 |
| 25 | Chicago | IL | 2,693,598 | 9.9 | 22.1 | 84.5 |
| 26 | Omaha | NB | 480,297 | 20.1 | 31.7 | 86.7 |
| 27 | Austin | TX | 943,059 | 21.6 | 38.5 | 87.1 |
| 28 | Portland | OR | 660,216 | 13.5 | 47.6 | 89.2 |
| 29 | Columbus | OH | 891,855 | 24.9 | 32.0 | 89.7 |
| 30 | Phoenix | AZ | 1,708,960 | 22.4 | 29.9 | 95.2 |
| 31 | St. Paul | MN | 309,859 | 16.4 | 38.0 | 95.2 |
| 32 | Tucson | AZ | 550,448 | 21.2 | 36.2 | 96.1 |
| 33 | Charlotte | NC | 958,358 | 21.3 | 32.4 | 97.0 |
| 34 | San Antonio | TX | 1,573,157 | 21.9 | 36.3 | 98.3 |
| 35 | Seattle | WA | 771,517 | 16.4 | 48.7 | 98.3 |
| 36 | Corpus Christi | TX | 329,050 | 27.2 | 32.7 | 105.2 |
| 37 | Louisville | KY | 673,730 | 21.5 | 36.3 | 106.0 |
| 38 | Indianapolis | IN | 890,672 | 23.7 | 35.7 | 106.5 |
| 39 | Dallas | TX | 1,278,608 | 25.2 | 36.7 | 109.5 |
| 40 | Denver | CO | 737,709 | 16.5 | 46.5 | 110.1 |
| 41 | Washington | DC | 712,816 | 26.2 | 34.3 | 111.2 |
| 42 | Cincinnati | OH | 304,724 | 25.8 | 36.8 | 111.3 |
| 43 | Oklahoma City | OK | 532,581 | 20.1 | 48.5 | 118.5 |
| 44 | Stockton | CA | 314,981 | 21.8 | 29.8 | 118.6 |
| 45 | Aurora | CO | 334,644 | 24.3 | 39.1 | 120.5 |
| 46 | Nashville | TN | 688,013 | 30.7 | 40.7 | 132.1 |
| 47 | Minneapolis | MN | 435,116 | 24.7 | 45.6 | 132.1 |
| 48 | Tulsa | OK | 396,150 | 26.1 | 51.9 | 140.1 |
| 49 | Milwaukee | WI | 589,105 | 29.0 | 27.3 | 140.4 |
| 50 | Houston | TX | 2,297,580 | 33.0 | 42.7 | 142.5 |
| 51 | Baltimore | MD | 588,594 | 29.8 | 31.3 | 144.8 |
| 52 | Albuquerque | NM | 562,065 | 26.9 | 50.1 | 147.9 |
| 53 | New Orleans | LA | 393,779 | 27.2 | 45.4 | 148.1 |
| 54 | Wichita | KS | 390,746 | 37.4 | 45.6 | 149.4 |
| 55 | Oakland | CA | 437,923 | 30.3 | 51.7 | 150.7 |
| 56 | Cleveland | OH | 379,121 | 60.0 | 40.7 | 189.3 |
| 57 | Detroit | MI | 659,616 | 44.9 | 32.1 | 192.0 |
| 58 | Memphis | TN | 650,937 | 56.2 | 55.6 | 233.7 |
| 59 | Kansas City | MO | 318,398 | 49.7 | 64.6 | 245.7 |
Methodology
This study on the safest cities in the United States was conducted based upon data provided by the Federal Bureau of Investigation’s Uniform Crime Reporting Data Set from Return A. This data set contains crime reports from cities, counties, metropolitan statistical areas, and other jurisdictions around the country. Specifically, monthly crime data for violent crimes such as murder, rape, robbery, and assault, and property crimes such as burglary, larceny, and motor vehicle theft are provided for each jurisdiction in the data set.
Our study focused on the crime rate in cities around the country. We used a definition of “city” as legally incorporated municipalities. This definition differs somewhat from how many people think about cities such as contiguous metropolitan areas. However, since crime tends to be a local or hyper-local issue, providing data at a municipal level provides important granularity to understand the distribution of crime.
Cities were divided into one of three groups based on population, with small cities having populations between 10,000 to 99,999 residents, midsize cities from 100,000 to 300,000 residents, and large cities having more than 300,000 residents. Towns with populations below 10,000 were excluded from this study.
Data from the data set was provided on a monthly basis. In order to ensure the accuracy of results, we excluded cities where only six months or less of data was available. For cities that provided at least six months of data but less than 12 months of data, we scaled up the months reported to a proportional amount of crime for the entire year.
Our study tabulated the violent and property crimes per 1,000 residents per year for publication. We also created a proprietary crime score that was based upon applying a multiplier to more serious forms of crime such as murder, rape, robbery, and aggravated assault. These crimes were added to simple assault and property crimes to form a crime score for each city, with a lower score indicating that a city experiences less crime. We then ranked the cities based upon their crime scores to determine the safest cities in the United States.
Sources
- Federal Bureau of Investigation, Uniform Crime Reporting, Return A, 2020