


Sustainability is an important topic that has been gaining increasing attention in recent years, as climate change has begun to create extreme weather conditions across the globe. The United States is the second-largest emitting country in the world of greenhouse gases, and the U.S. is among the top countries in carbon emissions on a per capita basis. With such a large and varied economy, the energy profile of cities varies dramatically around the country.
In this analysis, AdvisorSmith examined data from the U.S. Environmental Protection Agency, the U.S. Department of Energy, and the U.S. Census Bureau to study the cities that are the most sustainable nationwide. Our study calculated a sustainability score for 457 metro areas in the U.S., which we call “cities.” We considered factors such as the greenhouse gas emissions per capita, the transportation patterns of commuters, and the mix of renewable energy in each city. Nationwide, Americans emitted an average of 15.2 metric tons of carbon dioxide per capita.

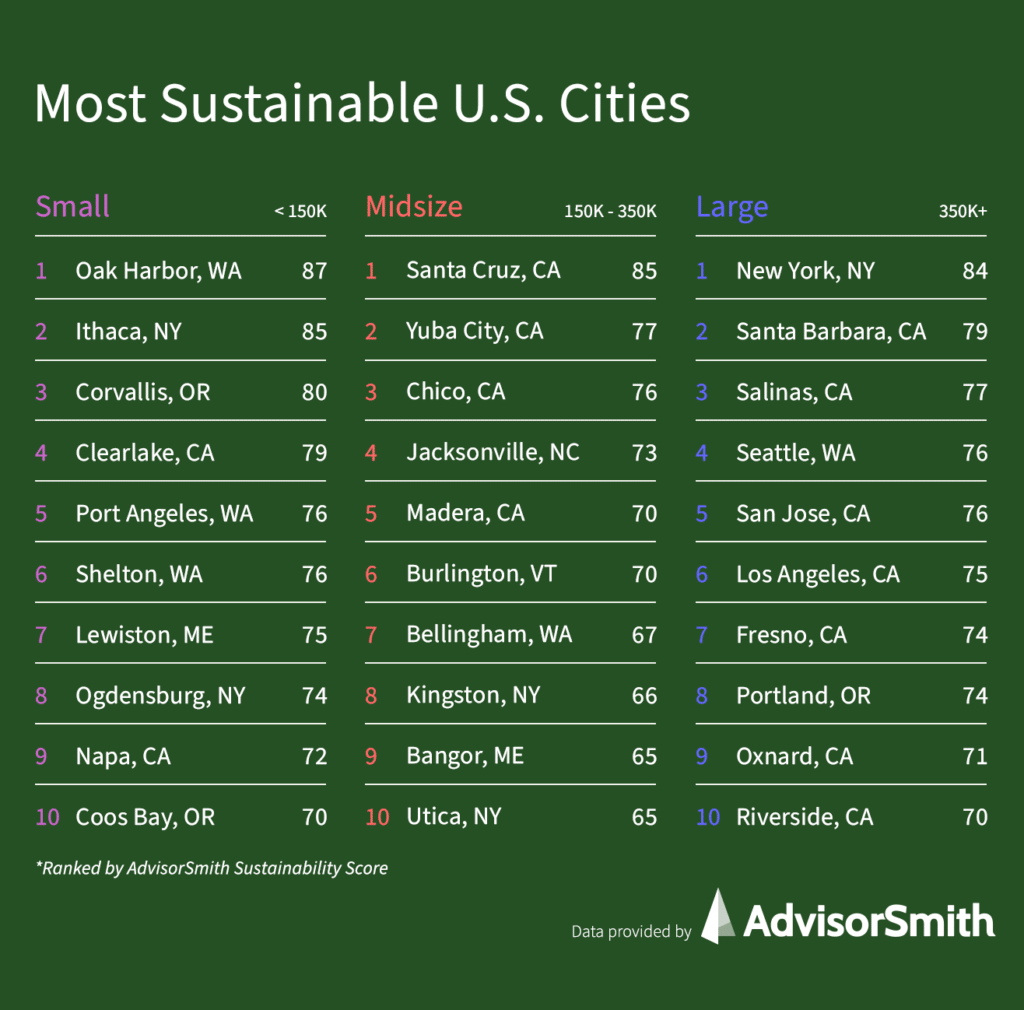
Most Sustainable Large Cities
The nation’s largest city, New York City, with its extensive public transportation system, was the nation’s most sustainable city. NYC had the lowest carbon dioxide emissions per capita among large cities, at 7.5 metric tons per capita, showing the climate benefits of dense urban living. NYC also had the lowest share of commuters driving to work alone, with just under half doing so. The rest of the top 10 cities were all located on the West Coast, including California, Oregon, and Washington. These cities all benefited from the mild climate, which reduced heating and cooling costs, as well as relatively high shares of renewable energy in all of these states.
Large cities emitted an average of 14.1 metric tons of carbon dioxide per capita, and 79% of commuters drove to work alone on average.
| Rank | City | State | Greenhouse Gas Emissions (metric tons of CO2 equivalent) | Greenhouse Gas Emissions per Capita (metric tons of CO2 equivalent) | Driving Alone to Work (%) | Sustainability Score |
|---|---|---|---|---|---|---|
| 1 | New York | NY | 149,803,742 | 7.5 | 49% | 84 |
| 2 | Santa Barbara | CA | 3,581,617 | 8.2 | 68% | 79 |
| 3 | Salinas | CA | 3,379,404 | 7.9 | 74% | 77 |
| 4 | Seattle | WA | 34,498,586 | 9.4 | 67% | 76 |
| 5 | San Jose | CA | 15,823,392 | 8.1 | 75% | 76 |
| 6 | Los Angeles | CA | 108,153,540 | 8.2 | 75% | 75 |
| 7 | Fresno | CA | 7,843,254 | 8.1 | 78% | 74 |
| 8 | Portland | OR | 22,687,180 | 9.6 | 70% | 74 |
| 9 | Oxnard | CA | 7,231,542 | 8.6 | 79% | 71 |
| 10 | Riverside | CA | 39,541,504 | 8.9 | 80% | 70 |
| 11 | Salem | OR | 3,953,295 | 9.8 | 78% | 69 |
| 12 | Modesto | CA | 4,666,570 | 8.8 | 83% | 68 |
| 13 | Portland | ME | 5,337,549 | 10.2 | 78% | 67 |
| 14 | Rochester | NY | 8,471,154 | 7.8 | 81% | 66 |
| 15 | Honolulu | HI | 7,710,157 | 7.8 | 67% | 66 |
| 16 | Boise | ID | 7,066,878 | 10.6 | 79% | 64 |
| 17 | Syracuse | NY | 5,838,918 | 8.8 | 79% | 63 |
| 18 | Spokane | WA | 6,240,756 | 11.5 | 77% | 62 |
| 19 | Boston | MA | 42,296,636 | 8.9 | 66% | 62 |
| 20 | Manchester | NH | 3,330,559 | 8.2 | 82% | 58 |
| 21 | Albany | NY | 9,022,025 | 10.3 | 78% | 58 |
| 22 | Bridgeport | CT | 8,401,699 | 8.9 | 71% | 56 |
| 23 | Springfield | MA | 5,448,502 | 8.7 | 80% | 56 |
| 24 | McAllen | TX | 8,087,478 | 9.8 | 78% | 56 |
| 25 | Tucson | AZ | 9,551,268 | 9.5 | 76% | 55 |
| 26 | Providence | RI | 13,664,277 | 8.5 | 81% | 54 |
| 27 | Provo | UT | 5,840,909 | 10.2 | 72% | 54 |
| 28 | Las Vegas | NV | 23,197,571 | 11.2 | 78% | 54 |
| 29 | Philadelphia | PA | 59,394,422 | 9.8 | 71% | 53 |
| 30 | Colorado Springs | CO | 7,705,068 | 11.2 | 77% | 53 |
| 31 | Brownsville | TX | 4,163,127 | 9.9 | 83% | 53 |
| 32 | New Haven | CT | 7,719,018 | 9 | 78% | 53 |
| 33 | Fayetteville | NC | 3,586,383 | 9.5 | 82% | 53 |
| 34 | Worcester | MA | 9,064,246 | 9.7 | 79% | 52 |
| 35 | Reno | NV | 5,531,409 | 12.5 | 75% | 50 |
| 36 | York | PA | 3,970,778 | 9 | 85% | 50 |
| 37 | Washington | DC | 69,521,463 | 11.6 | 65% | 50 |
| 38 | Ogden | UT | 6,748,275 | 10.7 | 80% | 48 |
| 39 | Tampa | FL | 29,830,659 | 10.2 | 78% | 48 |
| 40 | Baltimore | MD | 30,442,763 | 10.9 | 77% | 48 |
| 41 | Salt Lake City | UT | 13,192,519 | 11.4 | 77% | 47 |
| 42 | Killeen | TX | 5,141,079 | 12 | 79% | 46 |
| 43 | Cape Coral | FL | 7,239,377 | 10.6 | 78% | 46 |
| 44 | Anchorage | AK | 5,390,600 | 13.5 | 78% | 44 |
| 45 | Hickory | NC | 4,197,492 | 11.6 | 83% | 43 |
| 46 | Albuquerque | NM | 11,701,917 | 12.9 | 82% | 43 |
| 47 | North Port | FL | 8,528,504 | 11.3 | 78% | 43 |
| 48 | Orlando | FL | 26,787,019 | 11.5 | 77% | 42 |
| 49 | Durham | NC | 6,720,511 | 12.4 | 77% | 42 |
| 50 | Tallahassee | FL | 4,212,041 | 11.2 | 81% | 42 |
| 51 | Salisbury | MD | 4,628,173 | 11.9 | 81% | 42 |
| 52 | Charlotte | NC | 29,539,651 | 12.4 | 79% | 41 |
| 53 | Lancaster | PA | 6,260,665 | 11.7 | 78% | 41 |
| 54 | Denver | CO | 39,293,381 | 14.3 | 74% | 41 |
| 55 | Virginia Beach | VA | 19,388,504 | 11.3 | 81% | 41 |
| 56 | El Paso | TX | 10,816,278 | 12.9 | 81% | 41 |
| 57 | Pensacola | FL | 5,794,617 | 12.2 | 75% | 41 |
| 58 | Palm Bay | FL | 6,333,200 | 11.3 | 83% | 41 |
| 59 | Lakeland | FL | 7,122,901 | 11.2 | 84% | 40 |
| 60 | Port St. Lucie | FL | 5,276,529 | 11.8 | 80% | 40 |
| 61 | Jacksonville | FL | 17,025,846 | 12 | 80% | 39 |
| 62 | Deltona | FL | 7,401,025 | 12.1 | 79% | 39 |
| 63 | Allentown | PA | 9,948,868 | 12 | 82% | 38 |
| 64 | Myrtle Beach | SC | 5,177,260 | 12.3 | 80% | 38 |
| 65 | Chicago | IL | 134,904,970 | 14.2 | 69% | 38 |
| 66 | Asheville | NC | 5,905,373 | 13.4 | 79% | 37 |
| 67 | Reading | PA | 5,139,809 | 12.4 | 81% | 37 |
| 68 | Ann Arbor | MI | 4,936,554 | 13.8 | 74% | 36 |
| 69 | Minneapolis | MN | 52,426,116 | 15 | 77% | 36 |
| 70 | Flint | MI | 5,409,422 | 13.1 | 82% | 35 |
| 71 | San Antonio | TX | 34,691,367 | 14.9 | 78% | 34 |
| 72 | Greensboro | NC | 10,528,497 | 14.1 | 80% | 34 |
| 73 | Wichita | KS | 10,753,165 | 16.8 | 86% | 32 |
| 74 | Harrisburg | PA | 7,962,437 | 14.2 | 79% | 31 |
| 75 | Lansing | MI | 6,857,536 | 14.6 | 79% | 30 |
| 76 | Des Moines | IA | 10,961,149 | 17.9 | 83% | 29 |
| 77 | Lafayette | LA | 6,639,648 | 13.7 | 87% | 28 |
| 78 | Charleston | SC | 10,618,128 | 14.6 | 81% | 28 |
| 79 | Winston | NC | 9,939,276 | 15.2 | 83% | 27 |
| 80 | Detroit | MI | 63,793,338 | 14.8 | 82% | 27 |
| 81 | Pittsburgh | PA | 37,197,801 | 15.8 | 75% | 26 |
| 82 | Dallas | TX | 115,964,612 | 16.7 | 80% | 26 |
| 83 | Oklahoma City | OK | 24,316,381 | 18.2 | 84% | 25 |
| 84 | Richmond | VA | 19,146,296 | 15.2 | 80% | 25 |
| 85 | Cleveland | OH | 31,609,883 | 15.3 | 81% | 25 |
| 86 | Madison | WI | 10,534,775 | 16.6 | 75% | 24 |
| 87 | Nashville | TN | 29,856,741 | 16.6 | 79% | 24 |
| 88 | Columbus | OH | 30,757,258 | 15.4 | 82% | 24 |
| 89 | Bakersfield | CA | 17,066,227 | 19.6 | 81% | 23 |
| 90 | Akron | OH | 10,668,135 | 15.2 | 85% | 23 |
| 91 | Davenport | IA | 7,318,885 | 19.1 | 85% | 23 |
| 92 | Indianapolis | IN | 31,837,820 | 16.2 | 82% | 22 |
| 93 | Springfield | MO | 7,274,903 | 16.1 | 83% | 22 |
| 94 | Little Rock | AR | 11,781,305 | 16.2 | 83% | 22 |
| 95 | Columbia | SC | 12,834,569 | 16 | 81% | 22 |
| 96 | Savannah | GA | 6,203,892 | 16.7 | 78% | 21 |
| 97 | Knoxville | TN | 14,596,767 | 17 | 83% | 20 |
| 98 | Memphis | TN | 22,759,868 | 17 | 85% | 20 |
| 99 | Cincinnati | OH | 35,295,014 | 16.4 | 82% | 19 |
| 100 | Kansas City | MO | 34,655,008 | 16.7 | 84% | 19 |
| 101 | Lexington | KY | 8,413,859 | 17 | 81% | 19 |
| 102 | Tulsa | OK | 21,006,524 | 21.6 | 83% | 19 |
| 103 | Huntsville | AL | 7,435,949 | 16.9 | 86% | 18 |
| 104 | Augusta | GA | 9,891,849 | 16.9 | 83% | 18 |
| 105 | Houston | TX | 121,118,031 | 18.7 | 81% | 17 |
| 106 | Omaha | NE | 17,107,579 | 18.9 | 83% | 16 |
| 107 | Louisville | KY | 22,221,751 | 17.5 | 82% | 16 |
| 108 | Birmingham | AL | 20,067,866 | 17.6 | 85% | 15 |
| 109 | Huntington | WV | 6,276,255 | 17.3 | 85% | 15 |
| 110 | Montgomery | AL | 6,671,397 | 17.8 | 86% | 14 |
| 111 | Jackson | MS | 10,224,130 | 17.7 | 83% | 13 |
| 112 | Toledo | OH | 10,737,513 | 17.7 | 85% | 12 |
| 113 | Youngstown | OH | 10,150,167 | 18.4 | 84% | 10 |
| 114 | Corpus Christi | TX | 11,084,033 | 24.8 | 84% | 10 |
| 115 | Chattanooga | TN | 10,767,368 | 19.8 | 81% | 9 |
| 116 | St. Louis | MO | 54,185,650 | 19.3 | 83% | 8 |
| 117 | Fort Wayne | IN | 8,349,632 | 19.6 | 82% | 7 |
| 118 | Beaumont | TX | 15,919,271 | 39.2 | 90% | 7 |
| 119 | New Orleans | LA | 29,550,011 | 23.6 | 77% | 7 |
| 120 | Peoria | IL | 9,883,224 | 26.1 | 84% | 5 |
| 121 | Mobile | AL | 8,835,983 | 21.3 | 85% | 5 |
| 122 | Canton | OH | 8,439,280 | 20.9 | 85% | 3 |
| 123 | Shreveport | LA | 12,730,330 | 28.6 | 85% | 2 |
| 124 | Baton Rouge | LA | 37,261,137 | 45.2 | 85% | 2 |
Most Sustainable Midsize Cities
Cities in California and the Northeast were the most sustainable midsize cities. Northeastern states had higher shares of renewable energy and relatively lower greenhouse gas emissions than other midsize cities. The only Southern city to make the top 10 was Jacksonville, North Carolina, which has a higher than average proportion of commuters who walk to work. Among midsize cities, the average carbon dioxide emissions per capita were 15.7 metric tons, and an average of 80% of commuters drove to work alone.
| Rank | City | State | Greenhouse Gas Emissions (metric tons of CO2 equivalent) | Greenhouse Gas Emissions per Capita (metric tons of CO2 equivalent) | Driving Alone to Work (%) | Sustainability Score |
|---|---|---|---|---|---|---|
| 1 | Santa Cruz | CA | 1,787,370 | 6.6 | 69% | 85 |
| 2 | Yuba City | CA | 1,246,483 | 7.4 | 78% | 77 |
| 3 | Chico | CA | 1,790,460 | 8 | 76% | 76 |
| 4 | Jacksonville | NC | 1,130,424 | 6.1 | 70% | 73 |
| 5 | Madera | CA | 1,478,616 | 9.6 | 73% | 70 |
| 6 | Burlington | VT | 2,170,729 | 10 | 74% | 70 |
| 7 | Bellingham | WA | 2,191,037 | 10.4 | 76% | 67 |
| 8 | Kingston | NY | 1,530,909 | 8.5 | 75% | 66 |
| 9 | Bangor | ME | 1,580,401 | 10.3 | 80% | 65 |
| 10 | Utica | NY | 2,393,461 | 8.1 | 82% | 65 |
| 11 | Redding | CA | 1,780,294 | 9.9 | 82% | 64 |
| 12 | Medford | OR | 2,242,593 | 10.6 | 80% | 64 |
| 13 | Yakima | WA | 2,580,838 | 10.4 | 83% | 64 |
| 14 | Binghamton | NY | 2,088,733 | 8.5 | 82% | 63 |
| 15 | Kahului | HI | 1,247,300 | 7.7 | 76% | 62 |
| 16 | Hanford | CA | 1,730,406 | 11.5 | 79% | 59 |
| 17 | Kennewick | WA | 3,309,488 | 12 | 81% | 58 |
| 18 | El Centro | CA | 2,185,370 | 12.2 | 79% | 56 |
| 19 | St. George | UT | 1,498,060 | 9.9 | 72% | 56 |
| 20 | Boulder | CO | 3,867,891 | 12.3 | 65% | 54 |
| 21 | Torrington | CT | 1,548,216 | 8.4 | 81% | 54 |
| 22 | Iowa City | IA | 2,388,605 | 14.6 | 65% | 52 |
| 23 | Yuma | AZ | 2,010,186 | 9.9 | 80% | 52 |
| 24 | Billings | MT | 2,217,434 | 13.3 | 83% | 49 |
| 25 | Norwich | CT | 2,609,071 | 9.6 | 81% | 49 |
| 26 | Hilo | HI | 2,259,995 | 11.7 | 70% | 49 |
| 27 | Laredo | TX | 3,030,540 | 11.4 | 81% | 48 |
| 28 | Las Cruces | NM | 2,655,235 | 12.4 | 77% | 48 |
| 29 | Punta Gorda | FL | 1,732,623 | 10.2 | 79% | 47 |
| 30 | Fort Collins | CO | 4,133,496 | 12.7 | 76% | 47 |
| 31 | Wilmington | NC | 3,079,709 | 11.3 | 77% | 47 |
| 32 | Merced | CA | 3,859,377 | 14.6 | 77% | 47 |
| 33 | Bloomington | IN | 1,915,091 | 11.7 | 71% | 47 |
| 34 | Greenville | NC | 2,013,375 | 11.5 | 79% | 45 |
| 35 | Ocala | FL | 3,690,254 | 10.8 | 80% | 44 |
| 36 | Erie | PA | 3,187,044 | 11.4 | 78% | 43 |
| 37 | Vineland | NJ | 1,786,291 | 11.5 | 80% | 41 |
| 38 | Barnstable Town | MA | 2,591,552 | 12.1 | 81% | 41 |
| 39 | Dover | DE | 1,969,609 | 11.5 | 82% | 40 |
| 40 | Rochester | MN | 3,107,726 | 14.6 | 73% | 40 |
| 41 | East Stroudsburg | PA | 2,035,292 | 12.2 | 78% | 40 |
| 42 | Crestview | FL | 3,171,323 | 12.3 | 77% | 39 |
| 43 | Auburn | AL | 1,919,893 | 12.5 | 81% | 39 |
| 44 | State College | PA | 2,104,778 | 13.2 | 71% | 39 |
| 45 | Gainesville | FL | 3,544,269 | 13 | 75% | 37 |
| 46 | Pueblo | CO | 2,365,381 | 14.6 | 79% | 37 |
| 47 | Athens | GA | 2,658,590 | 13.3 | 75% | 37 |
| 48 | Lincoln | NE | 4,608,426 | 14.5 | 81% | 37 |
| 49 | Gainesville | GA | 2,573,251 | 13.5 | 77% | 35 |
| 50 | Waterloo | IA | 2,865,693 | 16.9 | 79% | 35 |
| 51 | Chambersburg | PA | 1,983,320 | 13 | 82% | 34 |
| 52 | Atlantic City | NJ | 3,610,251 | 13.2 | 79% | 34 |
| 53 | Panama City | FL | 2,497,408 | 12.9 | 82% | 34 |
| 54 | College Station | TX | 3,587,918 | 14.7 | 80% | 34 |
| 55 | Warner Robins | GA | 2,373,166 | 12.7 | 88% | 33 |
| 56 | Sioux Falls | SD | 4,335,758 | 17.5 | 83% | 33 |
| 57 | Racine | WI | 2,623,972 | 13.5 | 85% | 33 |
| 58 | Rockford | IL | 4,731,942 | 13.8 | 84% | 32 |
| 59 | Columbia | MO | 2,479,231 | 14.3 | 79% | 32 |
| 60 | Muskegon | MI | 2,379,469 | 13.8 | 85% | 30 |
| 61 | Charlottesville | VA | 3,410,463 | 15 | 72% | 30 |
| 62 | Lake Havasu City | AZ | 3,189,864 | 15.7 | 75% | 29 |
| 63 | Albany | GA | 2,312,015 | 14.9 | 77% | 29 |
| 64 | Johnson City | TN | 2,985,823 | 14.9 | 86% | 28 |
| 65 | Kalamazoo | MI | 4,960,504 | 14.9 | 82% | 28 |
| 66 | Janesville | WI | 2,412,194 | 15 | 82% | 27 |
| 67 | Greeley | CO | 4,755,101 | 17.1 | 79% | 27 |
| 68 | Burlington | NC | 2,368,403 | 15.1 | 85% | 26 |
| 69 | Clarksville | TN | 4,381,241 | 15.8 | 82% | 26 |
| 70 | Jackson | MI | 2,389,517 | 15 | 85% | 25 |
| 71 | St. Cloud | MN | 3,313,992 | 17.2 | 80% | 25 |
| 72 | Topeka | KS | 4,359,485 | 18.6 | 83% | 25 |
| 73 | Hagerstown | MD | 4,065,377 | 15.7 | 82% | 25 |
| 74 | Columbus | GA | 4,770,513 | 15.3 | 83% | 25 |
| 75 | Appleton | WI | 3,507,777 | 15.2 | 86% | 25 |
| 76 | Alexandria | LA | 2,437,575 | 15.8 | 79% | 23 |
| 77 | Eau Claire | WI | 2,700,479 | 16.3 | 79% | 23 |
| 78 | Roanoke | VA | 4,811,065 | 15.4 | 83% | 23 |
| 79 | Houma | LA | 3,328,758 | 15.8 | 80% | 23 |
| 80 | Saginaw | MI | 3,140,852 | 16.1 | 84% | 21 |
| 81 | Daphne | AL | 3,205,665 | 16.1 | 86% | 21 |
| 82 | Sioux City | IA | 4,508,208 | 26.7 | 81% | 21 |
| 83 | South Bend | IN | 5,375,460 | 16.8 | 79% | 21 |
| 84 | Lafayette | IN | 3,600,464 | 17 | 78% | 21 |
| 85 | Waco | TX | 4,497,838 | 17.3 | 85% | 21 |
| 86 | Fargo | ND | 4,349,363 | 19.1 | 83% | 21 |
| 87 | Cedar Rapids | IA | 6,245,896 | 23.6 | 84% | 20 |
| 88 | Lubbock | TX | 5,592,168 | 18.3 | 79% | 19 |
| 89 | Spartanburg | SC | 5,261,720 | 16.3 | 83% | 19 |
| 90 | Odessa | TX | 2,812,607 | 18.4 | 80% | 18 |
| 91 | Bowling Green | KY | 2,859,370 | 17.2 | 83% | 17 |
| 92 | Bloomington | IL | 3,360,838 | 17.7 | 81% | 17 |
| 93 | Elizabethtown | KY | 2,584,245 | 17.2 | 84% | 16 |
| 94 | Jefferson City | MO | 2,675,576 | 17.7 | 83% | 15 |
| 95 | Joplin | MO | 3,143,743 | 17.9 | 82% | 15 |
| 96 | Florence | SC | 3,491,638 | 16.9 | 88% | 15 |
| 97 | Duluth | MN | 5,750,745 | 20.6 | 82% | 13 |
| 98 | Abilene | TX | 3,588,183 | 21.3 | 79% | 13 |
| 99 | Champaign | IL | 4,835,567 | 20.4 | 71% | 12 |
| 100 | Wichita Falls | TX | 3,805,317 | 25.2 | 79% | 12 |
| 101 | Tyler | TX | 4,662,199 | 21.2 | 81% | 12 |
| 102 | Midland | TX | 7,467,114 | 46.3 | 84% | 10 |
| 103 | Amarillo | TX | 6,520,083 | 25 | 84% | 10 |
| 104 | Longview | TX | 7,031,121 | 32.4 | 84% | 10 |
| 105 | Fort Smith | AR | 5,292,648 | 18.9 | 85% | 9 |
| 106 | Tuscaloosa | AL | 4,556,494 | 19.2 | 84% | 9 |
| 107 | Elkhart | IN | 5,379,626 | 26.7 | 77% | 9 |
| 108 | Terre Haute | IN | 3,693,137 | 21.5 | 79% | 8 |
| 109 | Springfield | IL | 4,816,863 | 22.8 | 82% | 7 |
| 110 | Oshkosh | WI | 3,459,898 | 20.4 | 82% | 6 |
| 111 | Charleston | WV | 4,479,814 | 20.2 | 81% | 6 |
| 112 | Green Bay | WI | 7,213,326 | 22.9 | 84% | 5 |
| 113 | Evansville | IN | 7,391,521 | 23.5 | 85% | 5 |
| 114 | Decatur | AL | 4,029,913 | 26.3 | 88% | 4 |
| 115 | Lake Charles | LA | 10,993,029 | 53.9 | 85% | 2 |
| 116 | Monroe | LA | 3,634,690 | 20.3 | 86% | 2 |
Most Sustainable Small Cities
All of the top 10 most sustainable small cities were located on the West Coast, including California, Oregon, and Washington, or in New York state. The moderate weather of the West Coast contributed to lower energy usage for heating and cooling. Additionally, all three West Coast states had high shares of renewable energy in use. New York state also had a high share of renewable energy. Among the small cities studied, the average carbon dioxide emissions were 16.5 metric tons per capita, and an average of 81% of commuters drove to work alone.
| Rank | City | State | Greenhouse Gas Emissions (metric tons of CO2 equivalent) | Greenhouse Gas Emissions per Capita (metric tons of CO2 equivalent) | Driving Alone to Work (%) | Sustainability Score |
|---|---|---|---|---|---|---|
| 1 | Oak Harbor | WA | 513,112 | 6.4 | 71% | 87 |
| 2 | Ithaca | NY | 615,615 | 5.9 | 60% | 85 |
| 3 | Corvallis | OR | 734,880 | 8.4 | 67% | 80 |
| 4 | Clearlake | CA | 544,016 | 8.5 | 65% | 79 |
| 5 | Port Angeles | WA | 660,553 | 9.1 | 70% | 76 |
| 6 | Shelton | WA | 522,768 | 8.6 | 75% | 76 |
| 7 | Lewiston | ME | 873,896 | 8.1 | 80% | 75 |
| 8 | Ogdensburg | NY | 756,439 | 6.8 | 74% | 74 |
| 9 | Napa | CA | 1,242,754 | 8.8 | 76% | 72 |
| 10 | Coos Bay | OR | 596,141 | 9.5 | 78% | 70 |
| 11 | Grants Pass | OR | 836,872 | 10 | 75% | 70 |
| 12 | Watertown | NY | 927,321 | 7.9 | 76% | 69 |
| 13 | Plattsburgh | NY | 583,691 | 7.2 | 84% | 68 |
| 14 | Manhattan | KS | 984,793 | 10.1 | 72% | 67 |
| 15 | Truckee | CA | 1,008,956 | 10.2 | 74% | 67 |
| 16 | Ukiah | CA | 898,800 | 10.3 | 75% | 66 |
| 17 | Augusta | ME | 1,217,408 | 10.1 | 81% | 66 |
| 18 | Pocatello | ID | 907,511 | 10.8 | 78% | 64 |
| 19 | Aberdeen | WA | 824,958 | 11.6 | 74% | 63 |
| 20 | Auburn | NY | 665,625 | 8.4 | 83% | 63 |
| 21 | Idaho Falls | ID | 1,606,744 | 11.6 | 76% | 62 |
| 22 | Wenatchee | WA | 1,293,496 | 11.3 | 79% | 62 |
| 23 | Keene | NH | 586,447 | 7.7 | 79% | 62 |
| 24 | Missoula | MT | 1,319,957 | 11.7 | 73% | 61 |
| 25 | Great Falls | MT | 906,488 | 11 | 79% | 61 |
| 26 | Carson City | NV | 509,059 | 9.4 | 83% | 59 |
| 27 | Fairbanks | AK | 1,082,211 | 10.8 | 72% | 59 |
| 28 | Elmira | NY | 826,742 | 9.4 | 84% | 58 |
| 29 | Coeur d'Alene | ID | 1,777,036 | 12 | 81% | 58 |
| 30 | California | MD | 865,573 | 7.8 | 83% | 58 |
| 31 | Kapaa | HI | 583,231 | 8.3 | 81% | 58 |
| 32 | Olean | NY | 781,113 | 9.9 | 81% | 57 |
| 33 | Bozeman | MT | 1,288,170 | 13.2 | 71% | 56 |
| 34 | Logan | UT | 1,298,059 | 9.8 | 72% | 56 |
| 35 | Alamogordo | NM | 685,658 | 10.5 | 79% | 55 |
| 36 | Jamestown | NY | 1,420,286 | 10.8 | 82% | 54 |
| 37 | Morehead City | NC | 619,240 | 9 | 85% | 53 |
| 38 | Homosassa Springs | FL | 1,228,825 | 8.7 | 80% | 53 |
| 39 | Red Bluff | CA | 822,147 | 13 | 78% | 53 |
| 40 | Glens Falls | NY | 1,387,698 | 10.9 | 82% | 53 |
| 41 | Walla Walla | WA | 865,767 | 13.6 | 79% | 52 |
| 42 | Pinehurst | NC | 955,710 | 10.3 | 76% | 52 |
| 43 | Centralia | WA | 1,113,403 | 14.7 | 72% | 51 |
| 44 | Athens | OH | 697,980 | 10.7 | 68% | 51 |
| 45 | Pittsfield | MA | 1,423,444 | 11.1 | 72% | 50 |
| 46 | Goldsboro | NC | 1,214,725 | 9.8 | 86% | 49 |
| 47 | New Bern | NC | 1,311,675 | 10.3 | 81% | 49 |
| 48 | Kalispell | MT | 1,265,685 | 13.4 | 83% | 49 |
| 49 | Helena | MT | 1,110,569 | 14.3 | 75% | 49 |
| 50 | Concord | NH | 1,606,956 | 10.9 | 80% | 47 |
| 51 | Lawrence | KS | 1,649,921 | 14.2 | 79% | 46 |
| 52 | Johnstown | PA | 1,379,715 | 10 | 84% | 46 |
| 53 | Gettysburg | PA | 1,071,447 | 10.5 | 80% | 46 |
| 54 | Klamath Falls | OR | 961,989 | 14.6 | 84% | 45 |
| 55 | Key West | FL | 962,870 | 12.5 | 64% | 45 |
| 56 | Forest City | NC | 735,118 | 11 | 84% | 45 |
| 57 | Roseburg | OR | 1,636,924 | 15.2 | 80% | 45 |
| 58 | Grand Junction | CO | 1,905,199 | 12.9 | 80% | 44 |
| 59 | Lawton | OK | 1,981,031 | 15.2 | 72% | 44 |
| 60 | Hermiston | OR | 1,354,616 | 15.4 | 81% | 43 |
| 61 | The Villages | FL | 1,288,885 | 11.3 | 79% | 43 |
| 62 | Twin Falls | ID | 1,618,755 | 15.6 | 81% | 42 |
| 63 | Corning | NY | 1,347,040 | 13.7 | 79% | 42 |
| 64 | Sunbury | PA | 1,043,926 | 11.2 | 82% | 42 |
| 65 | Heber | UT | 368,680 | 13.2 | 72% | 41 |
| 66 | Show Low | AZ | 1,405,574 | 13 | 74% | 41 |
| 67 | North Wilkesboro | NC | 849,724 | 12.3 | 82% | 40 |
| 68 | Mount Pleasant | MI | 853,582 | 12.1 | 81% | 40 |
| 69 | Santa Fe | NM | 2,137,030 | 14.5 | 75% | 40 |
| 70 | Moses Lake | WA | 1,602,441 | 17.3 | 76% | 37 |
| 71 | Faribault | MN | 1,001,018 | 15.4 | 72% | 37 |
| 72 | Mount Vernon | WA | 2,069,133 | 17.2 | 80% | 36 |
| 73 | Ames | IA | 1,602,351 | 16.9 | 78% | 36 |
| 74 | Sebastian | FL | 1,815,660 | 12.5 | 83% | 36 |
| 75 | Indiana | PA | 1,146,142 | 13.1 | 79% | 35 |
| 76 | Adrian | MI | 1,269,144 | 12.9 | 84% | 35 |
| 77 | Ocean City | NJ | 1,289,406 | 13.5 | 76% | 35 |
| 78 | Hot Springs | AR | 1,280,636 | 13.2 | 83% | 34 |
| 79 | Portsmouth | OH | 963,257 | 12.5 | 86% | 34 |
| 80 | Stillwater | OK | 1,333,327 | 16.7 | 79% | 34 |
| 81 | Jonesboro | AR | 1,671,415 | 13.2 | 84% | 34 |
| 82 | Nacogdoches | TX | 1,017,543 | 15.5 | 75% | 33 |
| 83 | Meadville | PA | 1,181,761 | 13.6 | 79% | 33 |
| 84 | Salem | OH | 1,348,678 | 12.8 | 85% | 33 |
| 85 | Williamsport | PA | 1,531,452 | 13.2 | 83% | 33 |
| 86 | Morgantown | WV | 1,958,092 | 14.3 | 76% | 33 |
| 87 | Brainerd | MN | 1,434,261 | 15.6 | 80% | 32 |
| 88 | Cumberland | MD | 1,404,527 | 14 | 83% | 32 |
| 89 | Lufkin | TX | 1,313,784 | 15 | 82% | 32 |
| 90 | Farmington | MO | 939,702 | 14.2 | 81% | 32 |
| 91 | Mount Airy | NC | 1,021,587 | 14 | 85% | 31 |
| 92 | La Crosse | WI | 1,974,042 | 14.5 | 79% | 31 |
| 93 | Kokomo | IN | 1,174,747 | 14.2 | 81% | 31 |
| 94 | Grand Forks | ND | 1,735,234 | 17.1 | 79% | 31 |
| 95 | Dubuque | IA | 1,703,350 | 17.7 | 81% | 31 |
| 96 | Athens | TX | 1,188,914 | 15 | 84% | 31 |
| 97 | Lumberton | NC | 1,888,418 | 14 | 87% | 31 |
| 98 | Somerset | PA | 1,024,194 | 13.4 | 86% | 30 |
| 99 | Altoona | PA | 1,727,159 | 13.7 | 84% | 30 |
| 100 | Chillicothe | OH | 1,050,395 | 13.6 | 85% | 30 |
| 101 | Marquette | MI | 1,010,834 | 15 | 76% | 30 |
| 102 | Shawnee | OK | 1,217,139 | 17 | 86% | 29 |
| 103 | Traverse City | MI | 2,205,720 | 15 | 78% | 29 |
| 104 | Winchester | VA | 1,903,403 | 14.3 | 80% | 29 |
| 105 | Valdosta | GA | 2,121,256 | 14.7 | 80% | 29 |
| 106 | New Castle | PA | 1,293,728 | 14.6 | 80% | 28 |
| 107 | Statesboro | GA | 1,059,584 | 14.5 | 83% | 28 |
| 108 | Rome | GA | 1,412,343 | 14.7 | 82% | 28 |
| 109 | Shelby | NC | 1,455,809 | 15 | 85% | 27 |
| 110 | Pottsville | PA | 2,093,201 | 14.4 | 84% | 27 |
| 111 | Cookeville | TN | 1,686,390 | 15.6 | 84% | 26 |
| 112 | Flagstaff | AZ | 2,389,145 | 17.3 | 68% | 26 |
| 113 | Rapid City | SD | 2,766,155 | 19.4 | 82% | 26 |
| 114 | Wooster | OH | 1,814,048 | 15.7 | 76% | 26 |
| 115 | Sierra Vista | AZ | 2,058,502 | 16.1 | 79% | 25 |
| 116 | Russellville | AR | 1,298,653 | 15.3 | 83% | 25 |
| 117 | Muncie | IN | 1,872,517 | 16.1 | 77% | 25 |
| 118 | Springfield | OH | 2,022,190 | 14.8 | 84% | 25 |
| 119 | Beaver Dam | WI | 1,379,841 | 15.6 | 82% | 25 |
| 120 | Hammond | LA | 1,865,576 | 14.7 | 85% | 25 |
| 121 | Lewiston | ID | 1,257,474 | 20.2 | 81% | 24 |
| 122 | Glenwood Springs | CO | 1,544,476 | 20.6 | 60% | 24 |
| 123 | Hutchinson | KS | 1,200,483 | 18.8 | 84% | 24 |
| 124 | Sumter | SC | 1,643,351 | 15.3 | 85% | 23 |
| 125 | Roanoke Rapids | NC | 1,151,667 | 15.7 | 88% | 23 |
| 126 | Pine Bluff | AR | 1,474,680 | 15.6 | 86% | 23 |
| 127 | Farmington | NM | 2,071,954 | 16.9 | 88% | 23 |
| 128 | Longview | WA | 2,612,458 | 25.4 | 84% | 23 |
| 129 | Holland | MI | 1,792,000 | 15.8 | 84% | 23 |
| 130 | Brunswick | GA | 1,822,672 | 15.9 | 82% | 22 |
| 131 | San Angelo | TX | 2,108,357 | 17.9 | 77% | 22 |
| 132 | Dothan | AL | 2,334,086 | 15.8 | 87% | 22 |
| 133 | Bluefield | WV | 1,655,166 | 15.8 | 85% | 22 |
| 134 | Seneca | SC | 1,182,138 | 15.7 | 85% | 21 |
| 135 | Palatka | FL | 1,160,218 | 16 | 82% | 21 |
| 136 | Sevierville | TN | 1,709,561 | 18.1 | 72% | 21 |
| 137 | Tullahoma | TN | 1,727,677 | 17 | 84% | 20 |
| 138 | Danville | IL | 1,325,520 | 16.6 | 84% | 19 |
| 139 | Casper | WY | 1,406,218 | 17.4 | 82% | 19 |
| 140 | Hattiesburg | MS | 2,391,694 | 16.2 | 83% | 19 |
| 141 | Muskogee | OK | 1,364,043 | 19.5 | 85% | 19 |
| 142 | Frankfort | KY | 1,223,445 | 17 | 80% | 19 |
| 143 | Fond du Lac | WI | 1,729,868 | 17 | 83% | 18 |
| 144 | Greeneville | TN | 1,129,692 | 16.5 | 91% | 18 |
| 145 | Martinsville | VA | 1,139,138 | 17.3 | 76% | 18 |
| 146 | Bismarck | ND | 2,468,124 | 19.5 | 84% | 18 |
| 147 | Kankakee | IL | 1,955,982 | 17.5 | 80% | 18 |
| 148 | Richmond | IN | 1,210,330 | 18 | 76% | 17 |
| 149 | Minot | ND | 1,528,923 | 19.7 | 85% | 17 |
| 150 | Richmond | KY | 1,876,347 | 18 | 78% | 16 |
| 151 | Hinesville | GA | 1,396,983 | 17.2 | 83% | 16 |
| 152 | St. Joseph | MO | 2,254,971 | 17.7 | 82% | 16 |
| 153 | Gadsden | AL | 1,731,178 | 16.7 | 91% | 16 |
| 154 | Meridian | MS | 1,821,370 | 17.3 | 81% | 15 |
| 155 | Watertown | WI | 1,511,555 | 17.9 | 82% | 15 |
| 156 | Parkersburg | WV | 1,642,447 | 17.8 | 80% | 15 |
| 157 | Morristown | TN | 2,087,823 | 18 | 85% | 15 |
| 158 | London | KY | 2,251,828 | 17.7 | 84% | 15 |
| 159 | Victoria | TX | 2,571,318 | 26.1 | 77% | 14 |
| 160 | Monroe | MI | 2,642,332 | 17.6 | 87% | 13 |
| 161 | Albertville | AL | 1,673,042 | 17.7 | 88% | 13 |
| 162 | Rocky Mount | NC | 2,733,498 | 18.3 | 86% | 13 |
| 163 | Quincy | IL | 1,406,397 | 18.2 | 84% | 13 |
| 164 | Hobbs | NM | 1,826,106 | 26.5 | 83% | 12 |
| 165 | Grand Island | NE | 2,486,949 | 29.5 | 83% | 12 |
| 166 | Danville | VA | 1,853,953 | 17.7 | 86% | 12 |
| 167 | Roswell | NM | 1,298,195 | 19.8 | 86% | 11 |
| 168 | Ashtabula | OH | 1,815,500 | 18.3 | 81% | 11 |
| 169 | Clarksburg | WV | 1,706,036 | 18.1 | 86% | 11 |
| 170 | Cheyenne | WY | 2,673,549 | 27.7 | 77% | 11 |
| 171 | Sherman | TX | 2,606,406 | 21 | 83% | 11 |
| 172 | Marion | OH | 1,236,128 | 18.8 | 79% | 10 |
| 173 | Texarkana | TX | 3,223,243 | 21.5 | 84% | 10 |
| 174 | Marion | IN | 1,356,459 | 19.9 | 76% | 9 |
| 175 | Mansfield | OH | 2,240,236 | 18.4 | 85% | 9 |
| 176 | Jackson | TN | 2,627,837 | 20.2 | 80% | 9 |
| 177 | Beckley | WV | 2,393,006 | 19.4 | 79% | 9 |
| 178 | Talladega | AL | 1,836,147 | 20 | 78% | 9 |
| 179 | Stevens Point | WI | 1,468,755 | 20.8 | 79% | 8 |
| 180 | New Philadelphia | OH | 1,738,469 | 18.8 | 85% | 8 |
| 181 | Cleveland | TN | 2,694,767 | 22.5 | 83% | 8 |
| 182 | Carbondale | IL | 2,553,260 | 20.2 | 80% | 8 |
| 183 | Marinette | WI | 2,810,428 | 43.5 | 80% | 7 |
| 184 | Wilson | NC | 1,689,925 | 20.7 | 83% | 7 |
| 185 | Harrisonburg | VA | 2,643,907 | 20.3 | 76% | 7 |
| 186 | Wisconsin Rapids | WI | 1,783,741 | 24.2 | 81% | 7 |
| 187 | Manitowoc | WI | 1,668,544 | 20.8 | 81% | 7 |
| 188 | Opelousas | LA | 1,583,035 | 18.9 | 86% | 6 |
| 189 | Weirton | WV | 2,607,981 | 21.5 | 80% | 6 |
| 190 | Cullman | AL | 1,730,017 | 21.3 | 84% | 6 |
| 191 | Warsaw | IN | 1,681,190 | 21.4 | 82% | 6 |
| 192 | Battle Creek | MI | 2,779,162 | 20.6 | 82% | 6 |
| 193 | Lebanon | PA | 5,108,224 | 37.3 | 80% | 6 |
| 194 | Cape Girardeau | MO | 2,211,137 | 22.7 | 84% | 6 |
| 195 | Owensboro | KY | 2,681,539 | 22.9 | 83% | 5 |
| 196 | Michigan City | IN | 2,991,600 | 27 | 84% | 5 |
| 197 | DuBois | PA | 1,601,223 | 19.7 | 82% | 5 |
| 198 | Sheboygan | WI | 2,293,043 | 19.9 | 85% | 5 |
| 199 | Zanesville | OH | 1,640,986 | 19.1 | 88% | 5 |
| 200 | Dublin | GA | 1,114,513 | 19.4 | 87% | 5 |
| 201 | Columbus | IN | 1,802,285 | 22.5 | 85% | 5 |
| 202 | Bloomsburg | PA | 1,710,929 | 20.1 | 83% | 4 |
| 203 | Paducah | KY | 2,206,061 | 22.6 | 86% | 4 |
| 204 | Dalton | GA | 4,159,952 | 29.1 | 84% | 4 |
| 205 | Jefferson | GA | 1,551,104 | 25 | 85% | 4 |
| 206 | Sandusky | OH | 1,583,287 | 20.9 | 83% | 4 |
| 207 | Florence | AL | 3,373,914 | 22.9 | 88% | 4 |
| 208 | Orangeburg | SC | 1,979,182 | 22.1 | 84% | 3 |
| 209 | Lynchburg | VA | 9,121,908 | 91.9 | 83% | 3 |
| 210 | Decatur | IL | 3,213,825 | 29.6 | 89% | 3 |
| 211 | Bay City | MI | 2,326,553 | 21.9 | 88% | 3 |
| 212 | Midland | MI | 2,344,520 | 28.1 | 88% | 3 |
| 213 | Findlay | OH | 2,079,247 | 27.5 | 86% | 3 |
| 214 | Wheeling | WV | 3,051,852 | 21.1 | 88% | 2 |
| 215 | Lima | OH | 2,610,008 | 24.9 | 87% | 2 |
| 216 | Tupelo | MS | 2,940,128 | 21.1 | 89% | 0 |
| 217 | Laurel | MS | 3,648,453 | 43 | 91% | 0 |
Methodology
AdvisorSmith examined data on air quality, greenhouse gas emissions, carbon footprints, transportation choices, energy usage, and energy generation sources in 457 metropolitan statistical areas in the United States, which we term “cities,” to find the most sustainable cities in the country. We developed a model that assigned a score for each of the considered factors to each city. We also weighted each of the factors and aggregated the score across all weighted factors to create a sustainability score for each city.
We divided the cities into three groups based on population size. Small cities were those with up to 150,000 residents. Midsize cities included those cities that had between 150,000 and 350,000 residents, while large cities were those with over 350,000 residents in the metropolitan area.
Our study included data on air pollution measurements provided by the EPA for each of the cities. We also included data on the means of transportation that commuters use to get to work, considering the number of commuters who drove alone, carpooled, or took public transit.
The heaviest weighted factor in our analysis was the greenhouse gas emissions per capita for each city. This factor was the aggregate metric tons of carbon dioxide (equivalent) emitted per capita for each of the cities. This measure of greenhouse gas emissions includes emissions from residential electricity generation and natural gas, commercial electricity and natural gas, industrial electricity and natural gas consumption, and on-road transportation using gasoline and diesel fuels. We also calculated the mix of renewable energy used in each state’s energy grid and applied this metric to the cities within their respective states.
Sources
- U.S. Environmental Protection Agency, Air Quality – Cities and Counties
- U.S. Census Bureau, American Community Survey
- U.S. Department of Energy, City and County Energy Profiles
- U.S. Energy Information Administration, Net Generation by State by Type of Producer by Energy Source (EIA-906, EIA-920, and EIA-923)