


With health care costs rising year over year, health insurance premiums have major financial impacts for both employers and employees. In this study, AdvisorSmith examined the cost of health insurance premiums for employer-sponsored health insurance plans in 73 U.S. cities for businesses of all sizes. We also found the cities in which employer costs for health insurance are growing the fastest.
Our study found that cities in the Northeast had some of the highest insurance premiums for business health insurance plans, taking seven of the top ten spots, led by New York City. We used data from the Medical Expenditure Panel Survey to find the average premiums paid per employee for businesses from 2018, which is the most recent year of data available.
Additionally, our study used premium data and data about the employee contributions to company-sponsored health insurance plans to determine the cost that businesses bear for their employee insurance plans. Our study considered the period from 2013-2018 to find the growth rates for employer costs.
How much are health insurance premiums for businesses?
The average cost of health insurance premiums for businesses nationwide was $11,330 per employee. This number is a composite cost for single, employee-plus-one, and family coverage options and includes the portion paid by employee contributions. Cities in our study had premium costs ranging from $9,892 up to $13,503.
Where Health Insurance Premiums for Businesses are Highest

1. New York City, NY
As the nation’s largest city and a center of finance, entertainment, culture, and technology, New York City also leads the country for the highest business health insurance premiums. Coming in at $13,503 per employee, insurance premiums for businesses in New York City are 19% higher than the national average.
2. Anchorage, AK
Anchorage, the most populous city in the state of Alaska, was second in our study of cities with the highest insurance premiums for business health insurance plans. Anchorage’s economy is based upon transportation, military, and tourism industries, and these businesses pay on average 16% higher health insurance premiums than the national average.
3. Tampa, FL
Tampa, near the Gulf of Mexico, is a growing Florida city with the third highest business health insurance premiums in the country. In addition to having the third highest premiums, Tampa was the second fastest growing city in terms of costs borne by employers for health insurance over the study period. Premiums in Tampa averaged $13,076 in 2018, which was 15% above the national average.
4. Boston, MA
Located on the banks of the Charles River, Boston is a center of education and scientific research, coupled with strong tourism and financial services industries. Businesses in Boston paid an average of $12,799 per employee in health insurance premiums, which was 13% above the national average.
5. Newark, NJ
Located just ten miles west of New York City, Newark is the largest city by population in New Jersey. Newark hosts a major global port, as well as jobs in insurance, finance, government, and healthcare. Newark’s businesses paid an average of $12,661 per employee in health insurance premiums, which was 12% above the national average.
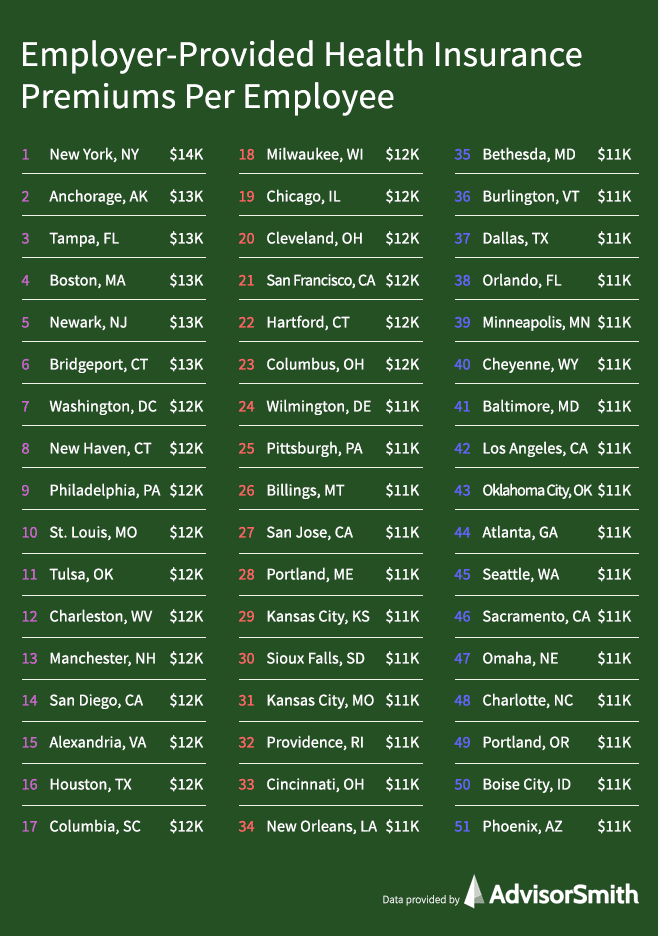
Cities with the Highest Business Health Insurance Premiums
The ranking below shows the highest ranked cities for business health insurance premiums among 73 major U.S. cities. Included in the data is a composite premium cost per employee that factors in the number of employees who select single, employee-plus-one, and family coverage applied to the average costs of coverage in each of the cities.
| Rank | City | Avg Premium per Employee | Difference from National Avg |
|---|---|---|---|
| 1 | New York, NY | $13,503 | 19% |
| 2 | Anchorage, AK | $13,197 | 16% |
| 3 | Tampa, FL | $13,076 | 15% |
| 4 | Boston, MA | $12,799 | 13% |
| 5 | Newark, NJ | $12,661 | 12% |
| 6 | Bridgeport, CT | $12,640 | 12% |
| 7 | Washington, DC | $12,497 | 10% |
| 8 | New Haven, CT | $12,229 | 8% |
| 9 | Philadelphia, PA | $12,145 | 7% |
| 10 | St. Louis, MO | $11,832 | 4% |
| 11 | Tulsa, OK | $11,760 | 4% |
| 12 | Charleston, WV | $11,732 | 4% |
| 13 | Manchester, NH | $11,732 | 4% |
| 14 | San Diego, CA | $11,719 | 3% |
| 15 | Alexandria, VA | $11,709 | 3% |
| 16 | Houston, TX | $11,701 | 3% |
| 17 | Columbia, SC | $11,677 | 3% |
| 18 | Milwaukee, WI | $11,674 | 3% |
| 19 | Chicago, IL | $11,649 | 3% |
| 20 | Cleveland, OH | $11,601 | 2% |
| 21 | San Francisco, CA | $11,592 | 2% |
| 22 | Hartford, CT | $11,547 | 2% |
| 23 | Columbus, OH | $11,528 | 2% |
| 24 | Wilmington, DE | $11,495 | 1% |
| 25 | Pittsburgh, PA | $11,484 | 1% |
| 26 | Billings, MT | $11,468 | 1% |
| 27 | San Jose, CA | $11,455 | 1% |
| 28 | Portland, ME | $11,411 | 1% |
| 29 | Kansas City, KS | $11,404 | 1% |
| 30 | Sioux Falls, SD | $11,401 | 1% |
| 31 | Kansas City, MO | $11,397 | 1% |
| 32 | Providence, RI | $11,358 | 0% |
| 33 | Cincinnati, OH | $11,339 | 0% |
| 34 | New Orleans, LA | $11,308 | 0% |
| 35 | Bethesda, MD | $11,273 | -1% |
| 36 | Burlington, VT | $11,110 | -2% |
| 37 | Dallas, TX | $11,083 | -2% |
| 38 | Orlando, FL | $11,065 | -2% |
| 39 | Minneapolis, MN | $11,055 | -2% |
| 40 | Cheyenne, WY | $11,044 | -3% |
| 41 | Baltimore, MD | $11,012 | -3% |
| 42 | Los Angeles, CA | $10,942 | -3% |
| 43 | Oklahoma City, OK | $10,927 | -4% |
| 44 | Atlanta, GA | $10,926 | -4% |
| 45 | Seattle, WA | $10,923 | -4% |
| 46 | Sacramento, CA | $10,919 | -4% |
| 47 | Omaha, NE | $10,888 | -4% |
| 48 | Charlotte, NC | $10,887 | -4% |
| 49 | Portland, OR | $10,844 | -4% |
| 50 | Boise City, ID | $10,832 | -4% |
| 51 | Phoenix, AZ | $10,794 | -5% |
| 52 | Virginia Beach, VA | $10,782 | -5% |
| 53 | Indianapolis, IN | $10,780 | -5% |
| 54 | Riverside, CA | $10,732 | -5% |
| 55 | Detroit, MI | $10,635 | -6% |
| 56 | Wichita, KS | $10,554 | -7% |
| 57 | Honolulu, HI | $10,547 | -7% |
| 58 | Denver, CO | $10,517 | -7% |
| 59 | Salt Lake City, UT | $10,479 | -8% |
| 60 | Louisville, KY | $10,468 | -8% |
| 61 | Miami, FL | $10,403 | -8% |
| 62 | Albuquerque, NM | $10,348 | -9% |
| 63 | Fargo, ND | $10,325 | -9% |
| 64 | Birmingham, AL | $10,325 | -9% |
| 65 | San Antonio, TX | $10,305 | -9% |
| 66 | Ogden, UT | $10,249 | -10% |
| 67 | Nashville, TN | $10,230 | -10% |
| 68 | Provo, UT | $10,221 | -10% |
| 69 | Des Moines, IA | $10,098 | -11% |
| 70 | Little Rock, AR | $10,091 | -11% |
| 71 | Jackson, MS | $10,052 | -11% |
| 72 | Las Vegas, NV | $10,030 | -11% |
| 73 | Memphis, TN | $9,892 | -13% |
How much does health insurance cost businesses?
The average cost of health insurance for businesses nationally was $8,443 per employee. This figure is based upon single, employee-plus-one, and family coverages, and subtracts the employee contribution from the employer’s premium costs. The cost to companies has grown at a 3.9% compound annual growth rate over the study period.
Health Insurance Cost Per Employee to Businesses
Health insurance plans for businesses are generally offered with options for single, employee-plus-one, and family coverage. Single coverage is most frequently chosen by employees and costs the least, while family coverage is the second most common while costing the most. To calculate the cost to employees, we examined the ratio of employees that chose each of the coverage options in order to come up with a composite cost per employee.
The cost to businesses for health insurance has two components. The first is the premium charged by the insurance company. Secondly, most employees make a contribution towards their health insurance coverage even when they receive insurance through an employer-sponsored plan. The difference between the two is the cost that the business is responsible for paying.
Cities Where Health Insurance Costs are Rising Fastest for Businesses
1. Jackson, MS
Located near the center of the state along the Pearl River, Jackson is the capital and most populous city in the state of Mississippi.
During the study period, the average cost of health insurance for businesses in Jackson rose from $4,735 per employee to $7,142, a rise of 51%, or 8.6% annualized growth. Although the cost of health insurance for businesses in Jackson in 2018 was still 15% below the national average, the city led the nation in terms of cost growth. The majority of the increase in costs in Jackson was driven by increasing premiums, as employee contributions were relatively stable over the study period.
2. Tampa, FL
Tampa is a major metropolitan city on the west coast of Florida, with a diversified economy that includes healthcare, retail, financial services, military, tourism, and real estate.
In Tampa, the cost to employers of the employer-paid portion of health insurance rose from $6,395 to $9,310 during the period 2013-2018, ending the period 10% above the national average cost. This increase of 46% was the second largest increase among cities in our study, and it corresponds to a 7.8% annualized increase. In Tampa, despite increases in employee contributions, premiums rose rapidly, leading to Tampa having the second largest increase in employer costs.
3. St. Louis, MO
As the largest metropolitan area in the state of Missouri, St. Louis is located in the eastern part of the state along the Mississippi River. St. Louis has a diversified economy with major trade, service, manufacturing, and transportation industries.
In St. Louis, the cost to employers for health insurance rose from $6,651 to $9,253 over the period of the study, an increase of 39%, and an annualized increase of 6.8%. In 2018, St. Louis’ cost to businesses was 10% above the national average for health insurance. The increase in costs was driven by higher insurance premiums in St. Louis. Employee contributions rose modestly over the study period.
4. New Orleans, LA
New Orleans is a major port city on the Gulf Coast located on the banks of the Mississippi River. The city has one of the world’s busiest ports, and its economy is bolstered by oil refining and petrochemicals, as well as a significant tourism industry.
The cost of employer-provided health insurance in New Orleans rose from $6,038 to $8,313 over the study period, an increase of 38%, or 6.7% on an annualized basis. In 2018, health insurance costs in New Orleans were 2% below the national average. Health insurance cost increases were driven by rising premiums, as employee contributions also had substantial increases.
5. Oklahoma City, OK
Oklahoma City is located in the center of the state of Oklahoma, and it is the state’s largest city and the capital. Some of the largest industries in the city include livestock and oil and gas products.
Health insurance costs in Oklahoma City rose 37.3% during the study period to $8,135 from $5,923. This increase was a compounded annual increase of 6.6%. At the end of the study period, the cost of health insurance in Oklahoma City was 4% below the national average. Increases in costs in Oklahoma City were primarily driven by increases in premiums costs, but were partially driven by decreased employee contributions for family coverage.
Ranking of Cities by Growth in Business Health Insurance Costs
In the table below, we rank 73 U.S. cities by their growth in health insurance costs borne by businesses during the study period. The costs to businesses per employee at the beginning and end of the study period are listed, along with the percentage growth rate and the compounded annual growth rate.
| Rank | City | Avg Company Cost Per Employee (2018) | Avg Company Cost Per Employee (2013) | Cost Growth | Compounded Annual Growth |
|---|---|---|---|---|---|
| 1 | Jackson, MS | $7,142 | $4,735 | 51% | 8.6% |
| 2 | Tampa, FL | $9,310 | $6,395 | 46% | 7.8% |
| 3 | St. Louis, MO | $9,253 | $6,651 | 39% | 6.8% |
| 4 | New Orleans, LA | $8,313 | $6,038 | 38% | 6.6% |
| 5 | Oklahoma City, OK | $8,135 | $5,923 | 37% | 6.6% |
| 6 | Bridgeport, CT | $9,660 | $7,065 | 37% | 6.5% |
| 7 | Cincinnati, OH | $8,545 | $6,256 | 37% | 6.4% |
| 8 | Riverside, CA | $7,942 | $6,022 | 32% | 5.7% |
| 9 | Birmingham, AL | $7,439 | $5,651 | 32% | 5.7% |
| 10 | Boise City, ID | $8,519 | $6,492 | 31% | 5.6% |
| 11 | New Haven, CT | $9,224 | $7,043 | 31% | 5.5% |
| 12 | Columbia, SC | $9,039 | $6,959 | 30% | 5.4% |
| 13 | Tulsa, OK | $8,724 | $6,744 | 29% | 5.3% |
| 14 | Orlando, FL | $7,894 | $6,123 | 29% | 5.2% |
| 15 | Pittsburgh, PA | $9,046 | $7,056 | 28% | 5.1% |
| 16 | Wilmington, DE | $8,594 | $6,731 | 28% | 5.0% |
| 17 | Kansas City, MO | $8,133 | $6,394 | 27% | 4.9% |
| 18 | Sioux Falls, SD | $8,168 | $6,475 | 26% | 4.8% |
| 19 | Kansas City, KS | $8,586 | $6,841 | 25% | 4.6% |
| 20 | Washington, DC | $9,331 | $7,436 | 25% | 4.6% |
| 21 | Omaha, NE | $7,887 | $6,299 | 25% | 4.6% |
| 22 | Boston, MA | $9,518 | $7,660 | 24% | 4.4% |
| 23 | New York, NY | $10,676 | $8,603 | 24% | 4.4% |
| 24 | Wichita, KS | $7,905 | $6,372 | 24% | 4.4% |
| 25 | Atlanta, GA | $7,895 | $6,367 | 24% | 4.4% |
| 26 | Houston, TX | $8,670 | $6,993 | 24% | 4.4% |
| 27 | San Diego, CA | $8,853 | $7,144 | 24% | 4.4% |
| 28 | Provo, UT | $8,117 | $6,552 | 24% | 4.4% |
| 29 | Alexandria, VA | $8,217 | $6,671 | 23% | 4.3% |
| 30 | Newark, NJ | $9,586 | $7,793 | 23% | 4.2% |
| 31 | Portland, ME | $8,580 | $7,042 | 22% | 4.0% |
| 32 | Miami, FL | $7,497 | $6,159 | 22% | 4.0% |
| 33 | Fargo, ND | $7,803 | $6,436 | 21% | 3.9% |
| 34 | Billings, MT | $8,820 | $7,281 | 21% | 3.9% |
| 35 | Manchester, NH | $8,809 | $7,275 | 21% | 3.9% |
| 36 | Chicago, IL | $8,705 | $7,190 | 21% | 3.9% |
| 37 | Minneapolis, MN | $8,004 | $6,628 | 21% | 3.8% |
| 38 | Hartford, CT | $8,593 | $7,153 | 20% | 3.7% |
| 39 | Las Vegas, NV | $7,084 | $5,906 | 20% | 3.7% |
| 40 | Baltimore, MD | $7,974 | $6,670 | 20% | 3.6% |
| 41 | Cheyenne, WY | $8,479 | $7,097 | 19% | 3.6% |
| 42 | San Francisco, CA | $8,970 | $7,540 | 19% | 3.5% |
| 43 | Charlotte, NC | $8,161 | $6,863 | 19% | 3.5% |
| 44 | Phoenix, AZ | $7,652 | $6,450 | 19% | 3.5% |
| 45 | Little Rock, AR | $7,064 | $5,955 | 19% | 3.5% |
| 46 | Cleveland, OH | $8,828 | $7,450 | 19% | 3.5% |
| 47 | Philadelphia, PA | $9,180 | $7,785 | 18% | 3.4% |
| 48 | Des Moines, IA | $7,236 | $6,164 | 17% | 3.3% |
| 49 | Milwaukee, WI | $8,738 | $7,448 | 17% | 3.2% |
| 50 | Dallas, TX | $8,035 | $6,861 | 17% | 3.2% |
| 51 | Albuquerque, NM | $7,392 | $6,324 | 17% | 3.2% |
| 52 | Virginia Beach, VA | $7,405 | $6,359 | 16% | 3.1% |
| 53 | Burlington, VT | $8,410 | $7,231 | 16% | 3.1% |
| 54 | Indianapolis, IN | $7,967 | $6,878 | 16% | 3.0% |
| 55 | Los Angeles, CA | $8,386 | $7,286 | 15% | 2.9% |
| 56 | Seattle, WA | $9,013 | $7,854 | 15% | 2.8% |
| 57 | Detroit, MI | $8,131 | $7,095 | 15% | 2.8% |
| 58 | Ogden, UT | $7,596 | $6,637 | 14% | 2.7% |
| 59 | Providence, RI | $8,165 | $7,187 | 14% | 2.6% |
| 60 | Portland, OR | $7,944 | $7,007 | 13% | 2.5% |
| 61 | Salt Lake City, UT | $7,988 | $7,089 | 13% | 2.4% |
| 62 | Nashville, TN | $7,370 | $6,643 | 11% | 2.1% |
| 63 | Columbus, OH | $8,343 | $7,581 | 10% | 1.9% |
| 64 | Honolulu, HI | $8,047 | $7,321 | 10% | 1.9% |
| 65 | Denver, CO | $7,895 | $7,192 | 10% | 1.9% |
| 66 | Bethesda, MD | $7,710 | $7,028 | 10% | 1.9% |
| 67 | Anchorage, AK | $10,579 | $9,677 | 9.3% | 1.8% |
| 68 | San Jose, CA | $8,388 | $7,869 | 6.6% | 1.3% |
| 69 | San Antonio, TX | $7,483 | $7,059 | 6.0% | 1.2% |
| 70 | Louisville, KY | $7,101 | $6,800 | 4.4% | 0.9% |
| 71 | Sacramento, CA | $7,698 | $7,413 | 3.8% | 0.8% |
| 72 | Charleston, WV | $8,103 | $7,934 | 2.1% | 0.4% |
| 73 | Memphis, TN | $6,567 | $6,536 | 0.5% | 0.1% |
Related Articles
Methodology
Our study used data from the Medical Expenditure Panel Survey, which is conducted by the U.S. Department of Health & Human Services, Agency for Healthcare Research and Quality. Specifically, to determine the highest insurance premiums for businesses, our study used data from 2018, which was the most recent year available. To determine the growth rate of business costs for health insurance, we used data from the period 2013-2018.
This study examined health insurance premiums for businesses in 73 U.S. cities. The cities were chosen by the Medical Expenditure Panel Survey either because they were major metropolitan areas, or because they were the largest city in their state. The selection of cities covers all 50 U.S. states and the District of Columbia.
To determine the cities with the highest premiums per employee, we created a composite premium per employee based upon the single, employee-plus-one, and family premiums, and multiplied each of the respective premiums by the percentage of employees who choose each type of coverage. The ratio was based upon data from 2018 regarding the distribution of employees who choose each type of plan.
In order to calculate the cities where company costs for health insurance premiums are rising the fastest, we used data on premiums and employee contributions from the period 2013-2018. For each type of coverage including single, employee-plus-one, and family coverage, we calculated the cost to the company by subtracting the average employee contribution from the average premium.
We then used the ratio of each type of coverage to create a composite premium cost per employee for each year. Our study calculated the absolute growth rate over the study period, as well as the compound annual growth rate, and ranked the cities based upon their respective growth rates.
The ratios of coverage that we used were the national averages from 2018. These figures were 55.2% for single coverage, 26.2% for family coverage, and 18.6% for employee-plus-one coverage.
Sources
1. U.S. Department of Health & Human Services, Agency for Healthcare Research and Quality, Medical Expenditure Panel Survey