


The demographics of the United States have been continually changing since the nation’s creation. With waves of immigration over the centuries populating the country with individuals from around the world seeking the American Dream, the United States is an amalgamation of diverse peoples and cultures. Additionally, variations in birth rates among different groups settled in the United States also has an impact on the demographic makeup of the country.
In this analysis, AdvisorSmith examines the U.S. cities that are the most ethnically and racially diverse in the country. We studied data for 607 cities from the U.S. Census Bureau’s American Community Survey to highlight the cities that have the most diversity based on the Census Bureau’s seven major categories for race, along with Hispanic or Latino origin. We used the proportion of each city’s population that identifies with these characteristics in order to develop a Diversity Score, which we used to determine the cities with the most diverse populations.
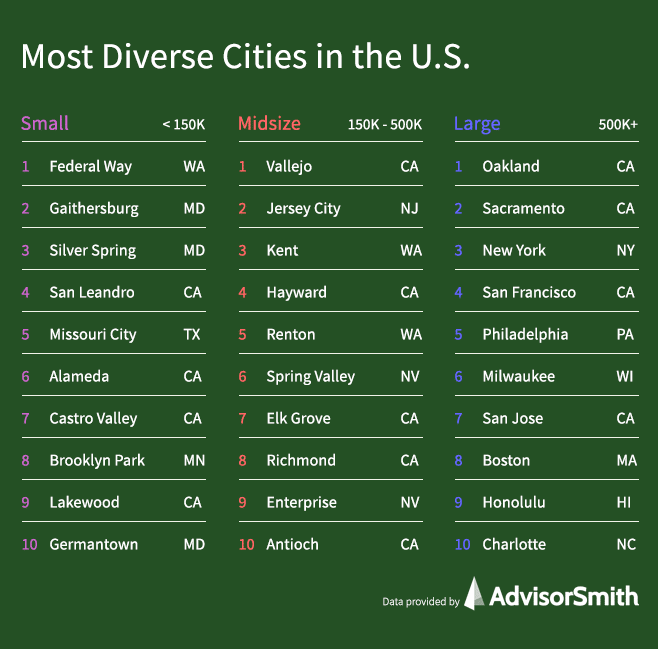
Most Diverse Cities by City Size
These are the most ethnically and racially diverse small (population under 100,000), midsize (population 100,000 to 300,000), and large cities (population over 300,000) in the United States.

Most Diverse Cities in the U.S.
1. Oakland, CA
Located across the San Francisco Bay from San Francisco in Northern California, Oakland was named the most diverse city in the United States in this report. Oakland’s population is 35% White, 23% Black or African American, 15% Asian, 1% Pacific Islander or Native Hawaiian, 1% Native American, 18% Some Other Race, and 7% Multiracial. 26% of Oakland residents identify as Hispanic or Latino.
Oakland has undergone significant cultural and demographic changes over the years. In the early 1900s, Oakland was a major auto manufacturing center, and during World War II, war-related manufacturing attracted laborers from all over the country. The Great Migration brought a significant increase in the African American population in the mid-1900s, and Mexican Americans also migrated to the area from the southwestern states during this time, with many working for the Southern Pacific Railroad in West Oakland. In the second half of the 20th century, as manufacturing died down, suburban development increased. More recently, the housing crisis in the Bay Area has accelerated the gentrification of many Oakland neighborhoods, adding to the changing makeup of the city.
2. Vallejo, CA
Vallejo is a midsize city in the North Bay region of the San Francisco Bay Area, located about 30 miles northeast of San Francisco. Vallejo’s population identifies as 33% White, 20% Black or African American, 26% Asian, 0.6% Pacific Islander, 0.4% Native American, 15% Some Other Race, and 5% Multiracial. 29% of the city’s population identifies as Hispanic or Latino.
Like much of the San Francisco Bay Area, Vallejo has seen significant changes in demographics in the last century. Vallejo was host to Mare Island Naval Shipyard for almost 150 years, and during World War II, Mare Island reached peak capacity for shipbuilding and maintenance, leading to an explosion in Vallejo’s population. In the decades following the war, Vallejo saw a marked increase in Black or African American, Asian, and Hispanic or Latino populations. More recently, the Bay Area’s housing crisis has led to an influx of residents seeking more affordable housing outside of San Francisco and Oakland.
3. Jersey City, NJ
Jersey City is located just across the Hudson River from Lower Manhattan and is the second-most populous city in the state of New Jersey. Jersey City’s population is 34% White, 23% Black or African American, 27% Asian, 1% Native American, 11% Some Other Race, and 4% Multiracial. 29% of Jersey City’s population identifies as Hispanic or Latino.
Jersey City is a major port of entry for immigration in the U.S., in addition to serving as a crucial economic part of the New York City metropolitan area. Over the last two centuries, the makeup of Jersey City has changed drastically. In the early 1800s, Jersey City was connected to the coal mines in Pennsylvania via the Morris Canal, and the city’s growth was catalyzed by passenger rail terminals that were built in the late 1800s connecting passenger traffic from Ellis Island and New York City with the rest of the country. Jersey City later became a center for manufacturing and has more recently become home to a number of financial institutions, as many Wall Street banks relocated operations after the 9/11 terror attacks.
4. Federal Way, WA
Situated between the cities of Seattle and Tacoma, Federal Way is a small city in the Seattle metropolitan area. Federal Way’s population is 47% White, 17% Black or African American, 13% Asian, 3% Pacific Islander, 1.7% Native American, 12% Some Other Race, and 7% Multiracial. 21% of Federal Way’s residents identify as Hispanic or Latino in origin.
Federal Way has a history as a logging town, and Weyerhauser was once a major employer in the city. In the 1970s and 1980s, Federal Way experienced rapid growth, and the city was formally incorporated in 1990.
5. Kent, WA
Neighboring Federal Way to the north is the city of Kent, Washington. In Kent, 48% of the city’s residents identify themselves as White, 14% as Black or African American, 16% as Asian, 3% as Pacific Islander, 0.3% Native American, 11% as Some Other Race, 7% as Multiracial. 16% of the city’s residents identify as Hispanic or Latino in origin.
Kent was the second city (after Seattle) to be incorporated in King County, Washington, having been incorporated in the 1890s. For many years, the city was a large agricultural producer. After World War II, Kent’s population grew rapidly. As Boeing and other aerospace companies began building in Kent in the 1960s, Kent’s population continued to grow and diversify. Today, Kent’s economy is driven by companies such as REI, Amazon, and Boeing, with manufacturing and distribution being large components of the city’s economy.
Top 200 Most Diverse U.S. Cities
In the table below, we list the top 200 U.S. cities with the most ethnic and racial diversity. We include the city’s rank, Diversity Score, and size. We also list the percentage of city residents that identify as White, Black or African American, Native American or Alaska Native, Asian, Native Hawaiian or Pacific Islander, Some Other Race, or Multiracial. Additionally, the percentage of city residents who identify with Hispanic or Latino origin is also listed.
| Rank | City | State | City Size | Diversity Score | White (%) | Black or African American (%) | Native American or Alaska Native (%) | Asian (%) | Native Hawaiian or Pacific Islander (%) | Some Other Race (%) | Multiracial (%) | Hispanic or Latino Origin (%) |
|---|---|---|---|---|---|---|---|---|---|---|---|---|
| 1 | Oakland | CA | Large | 75.6 | 35.1% | 23.2% | 0.9% | 15.3% | 0.8% | 17.8% | 7.0% | 26.5% |
| 2 | Vallejo | CA | Midsize | 74.5 | 33.0% | 19.9% | 0.4% | 25.8% | 0.6% | 15.2% | 5.0% | 29.0% |
| 3 | Jersey City | NJ | Midsize | 73.6 | 34.3% | 22.8% | 0.9% | 26.7% | 0.0% | 11.1% | 4.2% | 28.6% |
| 4 | Federal Way | WA | Small | 72.9 | 47.2% | 16.6% | 1.7% | 12.7% | 2.5% | 11.7% | 7.5% | 21.1% |
| 5 | Kent | WA | Midsize | 72.7 | 47.9% | 13.9% | 0.4% | 16.3% | 2.8% | 11.5% | 7.2% | 16.4% |
| 6 | Gaithersburg | MD | Small | 72.5 | 44.2% | 19.0% | 0.8% | 21.0% | 0.0% | 9.4% | 5.5% | 23.2% |
| 7 | Silver Spring | MD | Small | 72.4 | 41.1% | 31.4% | 0.0% | 10.4% | 0.0% | 12.7% | 4.4% | 18.7% |
| 8 | Sacramento | CA | Large | 72.1 | 44.3% | 13.3% | 0.5% | 19.5% | 2.0% | 12.2% | 8.2% | 29.2% |
| 9 | New York | NY | Large | 71.6 | 42.2% | 24.3% | 0.5% | 14.2% | 0.1% | 14.8% | 4.0% | 29.2% |
| 10 | Hayward | CA | Midsize | 71.3 | 27.7% | 9.0% | 1.1% | 28.6% | 1.8% | 23.9% | 7.8% | 37.8% |
| 11 | Renton | WA | Midsize | 71.2 | 47.2% | 9.3% | 0.6% | 26.4% | 1.7% | 8.4% | 6.3% | 15.8% |
| 12 | Spring Valley | NV | Midsize | 71.0 | 48.3% | 14.1% | 0.2% | 17.2% | 0.4% | 12.7% | 7.0% | 24.6% |
| 13 | San Leandro | CA | Small | 70.8 | 39.5% | 10.6% | 0.3% | 33.7% | 0.8% | 9.9% | 5.2% | 29.0% |
| 14 | Elk Grove | CA | Midsize | 70.5 | 47.1% | 11.8% | 1.1% | 27.9% | 2.2% | 2.6% | 7.3% | 18.1% |
| 15 | Missouri City | TX | Small | 70.1 | 36.5% | 40.1% | 0.0% | 17.2% | 0.0% | 1.8% | 4.4% | 15.5% |
| 16 | Richmond | CA | Midsize | 69.9 | 32.2% | 16.5% | 0.2% | 19.9% | 1.0% | 25.5% | 4.6% | 39.7% |
| 17 | Enterprise | NV | Midsize | 69.8 | 50.4% | 12.8% | 0.9% | 22.2% | 0.2% | 6.7% | 6.9% | 17.0% |
| 18 | Antioch | CA | Midsize | 69.7 | 41.9% | 19.9% | 0.9% | 13.3% | 0.4% | 12.9% | 10.8% | 37.3% |
| 19 | Alameda | CA | Small | 69.7 | 48.1% | 7.5% | 0.1% | 28.0% | 0.5% | 5.6% | 10.2% | 12.9% |
| 20 | Castro Valley | CA | Small | 69.5 | 45.8% | 7.3% | 0.5% | 32.7% | 0.2% | 4.1% | 9.4% | 15.9% |
| 21 | Brooklyn Park | MN | Small | 69.4 | 42.1% | 33.7% | 0.0% | 17.3% | 0.1% | 2.5% | 4.4% | 6.9% |
| 22 | Lakewood | CA | Small | 69.4 | 45.9% | 8.6% | 0.5% | 19.7% | 1.3% | 17.7% | 6.3% | 33.4% |
| 23 | Germantown | MD | Small | 69.3 | 50.5% | 18.1% | 0.2% | 17.6% | 0.0% | 5.1% | 8.5% | 23.4% |
| 24 | Rockville | MD | Small | 69.3 | 50.8% | 9.9% | 0.2% | 23.3% | 0.0% | 9.3% | 6.5% | 15.3% |
| 25 | San Francisco | CA | Large | 69.1 | 45.4% | 5.2% | 0.3% | 34.3% | 0.2% | 8.1% | 6.5% | 15.2% |
| 26 | Philadelphia | PA | Large | 68.8 | 39.4% | 41.5% | 0.3% | 7.4% | 0.0% | 7.7% | 3.7% | 15.2% |
| 27 | New Haven | CT | Midsize | 68.5 | 43.8% | 35.1% | 0.6% | 5.0% | 0.0% | 10.4% | 5.1% | 27.2% |
| 28 | Union City | CA | Small | 68.5 | 18.7% | 4.4% | 0.4% | 51.0% | 0.8% | 19.0% | 5.8% | 25.2% |
| 29 | Milwaukee | WI | Large | 68.5 | 43.2% | 38.0% | 0.5% | 4.3% | 0.0% | 9.9% | 4.1% | 20.2% |
| 30 | Bolingbrook | IL | Small | 68.4 | 51.4% | 14.3% | 0.5% | 9.3% | 0.2% | 16.3% | 8.1% | 29.2% |
| 31 | San Jose | CA | Large | 68.3 | 40.0% | 3.0% | 0.6% | 35.8% | 0.5% | 14.5% | 5.6% | 32.4% |
| 32 | Pasadena | CA | Midsize | 68.3 | 45.0% | 9.0% | 0.3% | 19.2% | 0.1% | 20.1% | 6.3% | 36.1% |
| 33 | Carson | CA | Small | 68.3 | 28.9% | 24.8% | 0.5% | 19.0% | 4.6% | 18.2% | 3.9% | 44.2% |
| 34 | South San Francisco | CA | Small | 68.2 | 32.7% | 1.7% | 0.3% | 43.4% | 0.5% | 14.4% | 7.0% | 31.1% |
| 35 | Buffalo | NY | Midsize | 68.1 | 46.1% | 35.1% | 0.4% | 6.5% | 0.0% | 6.9% | 5.0% | 12.9% |
| 36 | Boston | MA | Large | 67.7 | 52.5% | 24.5% | 0.3% | 9.5% | 0.0% | 7.3% | 5.8% | 20.0% |
| 37 | Paradise | NV | Midsize | 67.7 | 48.3% | 12.6% | 1.1% | 10.5% | 0.7% | 20.6% | 6.2% | 35.4% |
| 38 | San Mateo | CA | Midsize | 67.5 | 52.2% | 2.2% | 0.4% | 26.3% | 2.6% | 8.4% | 7.8% | 18.4% |
| 39 | Berkeley | CA | Midsize | 67.5 | 52.7% | 8.1% | 0.6% | 24.5% | 0.6% | 5.5% | 8.0% | 12.3% |
| 40 | Torrance | CA | Midsize | 67.4 | 46.8% | 2.4% | 0.7% | 35.7% | 0.2% | 8.0% | 6.2% | 19.9% |
| 41 | Honolulu | HI | Large | 67.4 | 16.8% | 2.0% | 0.1% | 52.2% | 7.8% | 0.9% | 20.3% | 8.0% |
| 42 | Pittsburg | CA | Small | 67.2 | 37.1% | 17.4% | 1.7% | 16.6% | 0.1% | 21.0% | 6.1% | 43.7% |
| 43 | Charlotte | NC | Large | 67.0 | 47.3% | 35.7% | 0.5% | 7.1% | 0.0% | 6.8% | 2.6% | 14.5% |
| 44 | High Point | NC | Midsize | 67.0 | 48.9% | 32.5% | 1.1% | 8.5% | 0.0% | 4.9% | 4.0% | 10.5% |
| 45 | Dale City | VA | Small | 66.6 | 50.8% | 25.5% | 1.2% | 9.8% | 0.0% | 7.1% | 5.6% | 31.8% |
| 46 | Brockton | MA | Small | 66.0 | 35.3% | 48.1% | 0.1% | 2.1% | 0.0% | 10.1% | 4.4% | 10.9% |
| 47 | Fairfield | CA | Midsize | 66.0 | 55.2% | 14.3% | 0.8% | 17.3% | 0.4% | 3.7% | 8.3% | 28.1% |
| 48 | Chino Hills | CA | Small | 65.9 | 43.9% | 5.3% | 1.2% | 40.8% | 0.0% | 3.9% | 4.9% | 27.2% |
| 49 | Rochester | NY | Midsize | 65.8 | 47.2% | 38.5% | 1.0% | 3.1% | 0.0% | 5.1% | 5.0% | 20.5% |
| 50 | Chicago | IL | Large | 65.8 | 51.4% | 29.5% | 0.3% | 6.7% | 0.0% | 9.2% | 3.0% | 28.7% |
| 51 | Schenectady | NY | Small | 65.4 | 56.4% | 19.8% | 2.1% | 7.4% | 0.3% | 5.4% | 8.6% | 10.3% |
| 52 | New Rochelle | NY | Small | 65.3 | 53.2% | 18.9% | 0.3% | 7.0% | 0.0% | 18.5% | 2.1% | 32.4% |
| 53 | Skokie | IL | Small | 65.2 | 51.7% | 8.0% | 0.0% | 30.0% | 1.0% | 2.1% | 7.1% | 7.5% |
| 54 | Bridgeport | CT | Midsize | 65.2 | 34.1% | 38.1% | 0.5% | 3.9% | 0.0% | 19.2% | 4.2% | 41.4% |
| 55 | Fayetteville | NC | Midsize | 65.1 | 43.6% | 42.9% | 1.2% | 3.4% | 0.4% | 2.7% | 5.7% | 12.2% |
| 56 | Santa Clara | CA | Midsize | 65.0 | 45.0% | 1.9% | 0.1% | 42.2% | 0.3% | 6.0% | 4.4% | 18.3% |
| 57 | Garden Grove | CA | Midsize | 65.0 | 38.4% | 1.0% | 0.5% | 39.9% | 2.3% | 15.5% | 2.4% | 38.0% |
| 58 | Alhambra | CA | Small | 64.9 | 23.0% | 2.2% | 0.4% | 46.2% | 0.0% | 23.8% | 4.5% | 39.0% |
| 59 | Stockton | CA | Large | 64.8 | 46.9% | 12.0% | 0.5% | 22.3% | 0.6% | 5.6% | 12.1% | 42.2% |
| 60 | Lawton | OK | Small | 64.7 | 57.9% | 18.0% | 3.4% | 2.3% | 1.0% | 4.0% | 13.6% | 14.8% |
| 61 | Long Beach | CA | Large | 64.6 | 48.8% | 13.4% | 0.9% | 13.1% | 0.6% | 19.1% | 4.1% | 41.3% |
| 62 | Rancho Cordova | CA | Small | 64.5 | 59.3% | 7.9% | 1.9% | 15.1% | 0.2% | 8.8% | 6.9% | 22.0% |
| 63 | Auburn | WA | Small | 64.5 | 59.7% | 7.4% | 1.4% | 12.9% | 1.5% | 8.7% | 8.5% | 17.9% |
| 64 | Mountain View | CA | Small | 64.5 | 52.5% | 1.8% | 0.5% | 33.2% | 0.0% | 7.6% | 4.4% | 18.5% |
| 65 | Killeen | TX | Midsize | 64.5 | 43.8% | 43.5% | 1.1% | 3.1% | 0.8% | 2.1% | 5.5% | 27.4% |
| 66 | Kansas City | KS | Midsize | 64.4 | 55.9% | 22.1% | 0.4% | 5.0% | 0.9% | 11.6% | 4.1% | 30.3% |
| 67 | St. Paul | MN | Large | 64.4 | 56.4% | 14.7% | 1.0% | 19.4% | 0.0% | 2.8% | 5.6% | 8.5% |
| 68 | Johns Creek | GA | Small | 64.2 | 53.4% | 13.2% | 1.3% | 27.4% | 0.1% | 1.9% | 2.7% | 6.5% |
| 69 | Irving | TX | Midsize | 64.1 | 44.1% | 14.6% | 0.4% | 19.8% | 0.0% | 18.7% | 2.2% | 44.4% |
| 70 | Washington | DC | Large | 64.1 | 42.2% | 45.5% | 0.3% | 3.9% | 0.1% | 4.4% | 3.6% | 11.3% |
| 71 | Centreville | VA | Small | 64.1 | 55.5% | 7.0% | 0.3% | 28.1% | 0.2% | 4.3% | 4.5% | 14.7% |
| 72 | Durham | NC | Midsize | 63.9 | 49.8% | 37.9% | 0.4% | 5.4% | 0.0% | 3.3% | 3.2% | 14.3% |
| 73 | Arlington | TX | Large | 63.9 | 56.9% | 23.2% | 0.7% | 6.9% | 0.0% | 8.4% | 3.9% | 28.3% |
| 74 | Hartford | CT | Midsize | 63.9 | 28.7% | 38.0% | 0.8% | 2.3% | 0.3% | 22.6% | 7.2% | 45.4% |
| 75 | Norfolk | VA | Midsize | 63.8 | 46.7% | 40.4% | 0.3% | 3.8% | 0.1% | 3.4% | 5.3% | 8.4% |
| 76 | San Ramon | CA | Small | 63.5 | 40.3% | 1.6% | 0.0% | 47.2% | 1.7% | 2.3% | 7.0% | 8.5% |
| 77 | Cleveland | OH | Large | 63.5 | 41.2% | 47.4% | 0.5% | 3.0% | 0.1% | 2.8% | 5.0% | 12.3% |
| 78 | Youngstown | OH | Small | 63.5 | 49.2% | 38.7% | 0.3% | 0.6% | 0.0% | 2.8% | 8.4% | 12.5% |
| 79 | Syracuse | NY | Midsize | 63.4 | 53.1% | 32.7% | 1.6% | 5.9% | 0.0% | 2.1% | 4.6% | 9.8% |
| 80 | Daly City | CA | Midsize | 63.4 | 21.1% | 2.4% | 0.2% | 58.8% | 0.8% | 10.7% | 6.0% | 23.5% |
| 81 | Newark | NJ | Midsize | 63.2 | 26.5% | 49.4% | 0.1% | 2.1% | 0.0% | 19.3% | 2.6% | 39.2% |
| 82 | Columbia | MD | Midsize | 63.1 | 55.9% | 26.3% | 0.5% | 12.2% | 0.0% | 1.1% | 4.1% | 9.8% |
| 83 | Yonkers | NY | Midsize | 63.0 | 52.0% | 20.5% | 0.7% | 4.7% | 0.0% | 19.3% | 2.8% | 39.5% |
| 84 | Sunnyvale | CA | Midsize | 63.0 | 38.3% | 1.7% | 0.3% | 50.7% | 0.0% | 3.9% | 5.2% | 14.2% |
| 85 | Danbury | CT | Small | 63.0 | 56.0% | 12.7% | 0.7% | 4.2% | 0.0% | 22.3% | 4.2% | 34.7% |
| 86 | Greensboro | NC | Midsize | 62.9 | 47.9% | 40.5% | 0.5% | 5.0% | 0.0% | 3.1% | 3.0% | 8.7% |
| 87 | Miramar | FL | Midsize | 62.9 | 37.1% | 49.5% | 0.2% | 8.2% | 0.0% | 2.0% | 2.9% | 33.1% |
| 88 | Fremont | CA | Midsize | 62.5 | 23.8% | 3.6% | 0.5% | 58.6% | 1.0% | 7.7% | 4.8% | 12.3% |
| 89 | Las Vegas | NV | Large | 62.5 | 58.9% | 11.4% | 1.5% | 7.4% | 0.6% | 14.9% | 5.3% | 34.6% |
| 90 | Sunrise | FL | Small | 62.2 | 52.7% | 32.9% | 0.1% | 5.3% | 0.3% | 3.8% | 4.9% | 35.1% |
| 91 | Aurora | CO | Large | 62.2 | 60.7% | 17.6% | 1.1% | 6.2% | 0.4% | 7.8% | 6.2% | 29.2% |
| 92 | Westminster | CA | Small | 62.2 | 29.3% | 0.6% | 0.2% | 57.1% | 0.2% | 9.8% | 2.7% | 22.1% |
| 93 | Lowell | MA | Midsize | 62.1 | 60.2% | 10.4% | 1.2% | 21.7% | 0.0% | 3.0% | 3.6% | 18.5% |
| 94 | Albany | NY | Small | 62.1 | 54.3% | 32.3% | 0.0% | 6.1% | 0.0% | 1.5% | 5.8% | 8.6% |
| 95 | Newport News | VA | Midsize | 62.1 | 47.6% | 42.2% | 0.1% | 3.6% | 0.2% | 2.2% | 4.1% | 9.2% |
| 96 | Pearland | TX | Midsize | 62.0 | 60.0% | 20.2% | 0.2% | 15.1% | 0.0% | 2.8% | 1.7% | 22.9% |
| 97 | West Covina | CA | Midsize | 62.0 | 37.2% | 4.0% | 0.9% | 33.1% | 1.2% | 18.2% | 5.3% | 48.1% |
| 98 | North Charleston | SC | Midsize | 61.9 | 46.8% | 43.8% | 0.5% | 2.4% | 0.0% | 1.9% | 4.6% | 10.7% |
| 99 | Buena Park | CA | Small | 61.9 | 51.4% | 3.2% | 0.5% | 34.9% | 0.3% | 6.6% | 3.1% | 36.2% |
| 100 | Pawtucket | RI | Small | 61.9 | 59.8% | 20.9% | 0.1% | 1.1% | 0.1% | 14.9% | 3.1% | 25.4% |
| 101 | Rancho Cucamonga | CA | Midsize | 61.8 | 56.5% | 10.8% | 0.3% | 11.0% | 0.0% | 13.2% | 8.1% | 40.4% |
| 102 | Beaumont | TX | Midsize | 61.7 | 45.3% | 46.8% | 0.1% | 4.2% | 0.0% | 2.1% | 1.5% | 17.5% |
| 103 | Columbus | GA | Midsize | 61.7 | 42.9% | 46.9% | 0.1% | 2.2% | 0.1% | 1.9% | 5.9% | 7.7% |
| 104 | Boynton Beach | FL | Small | 61.7 | 53.6% | 36.3% | 0.2% | 3.4% | 0.0% | 2.6% | 3.9% | 13.6% |
| 105 | West Valley City | UT | Midsize | 61.6 | 54.0% | 2.4% | 1.1% | 5.4% | 3.9% | 27.8% | 5.3% | 39.4% |
| 106 | North Las Vegas | NV | Midsize | 61.6 | 52.8% | 20.0% | 0.6% | 5.1% | 1.5% | 14.6% | 5.3% | 43.4% |
| 107 | Raleigh | NC | Large | 61.6 | 57.6% | 28.1% | 0.2% | 4.9% | 0.0% | 4.8% | 4.4% | 10.7% |
| 108 | Trenton | NJ | Small | 61.5 | 36.7% | 47.6% | 0.7% | 1.6% | 0.0% | 11.6% | 1.7% | 40.0% |
| 109 | Sugar Land | TX | Midsize | 61.4 | 54.7% | 5.7% | 0.6% | 35.0% | 0.0% | 1.5% | 2.5% | 14.1% |
| 110 | Irvine | CA | Midsize | 61.4 | 48.8% | 1.0% | 0.4% | 42.7% | 0.1% | 2.1% | 4.8% | 12.5% |
| 111 | Concord | CA | Midsize | 61.4 | 61.9% | 3.7% | 1.1% | 10.9% | 0.1% | 12.7% | 9.7% | 30.6% |
| 112 | Orlando | FL | Midsize | 61.3 | 58.5% | 26.2% | 0.1% | 3.6% | 0.1% | 7.4% | 4.1% | 31.7% |
| 113 | Anchorage | AK | Midsize | 61.2 | 62.3% | 5.7% | 7.6% | 9.7% | 2.1% | 1.8% | 10.8% | 9.3% |
| 114 | Tracy | CA | Small | 61.0 | 57.4% | 4.5% | 0.6% | 18.0% | 0.4% | 8.7% | 10.4% | 40.1% |
| 115 | Schaumburg | IL | Small | 61.0 | 59.8% | 5.8% | 2.5% | 24.4% | 0.0% | 5.7% | 1.9% | 10.9% |
| 116 | Fullerton | CA | Midsize | 60.9 | 57.6% | 2.3% | 0.9% | 24.5% | 0.3% | 10.3% | 4.2% | 36.8% |
| 117 | New Bedford | MA | Small | 60.8 | 59.4% | 6.2% | 0.1% | 1.3% | 0.0% | 28.2% | 4.8% | 25.4% |
| 118 | Winston-Salem | NC | Midsize | 60.8 | 55.9% | 34.8% | 0.1% | 2.7% | 0.5% | 2.6% | 3.4% | 15.9% |
| 119 | Hawthorne | CA | Small | 60.7 | 40.9% | 28.4% | 1.4% | 8.7% | 0.4% | 15.4% | 4.7% | 50.2% |
| 120 | Hammond | IN | Small | 60.7 | 49.8% | 18.1% | 0.4% | 0.4% | 0.0% | 28.9% | 2.3% | 42.9% |
| 121 | Fort Smith | AR | Small | 60.6 | 63.6% | 9.9% | 1.2% | 5.6% | 0.1% | 14.6% | 5.1% | 19.7% |
| 122 | Fort Myers | FL | Small | 60.6 | 61.5% | 22.8% | 0.0% | 2.6% | 0.2% | 10.8% | 2.1% | 22.6% |
| 123 | Lodi | CA | Small | 60.6 | 57.7% | 1.3% | 0.3% | 13.6% | 1.3% | 6.1% | 19.8% | 39.4% |
| 124 | Portsmouth | VA | Small | 60.6 | 39.8% | 50.0% | 1.6% | 1.5% | 0.0% | 2.2% | 4.9% | 4.7% |
| 125 | Inglewood | CA | Midsize | 60.4 | 27.1% | 38.8% | 1.4% | 3.5% | 0.7% | 23.3% | 5.3% | 50.6% |
| 126 | Arden-Arcade | CA | Midsize | 60.4 | 64.4% | 8.9% | 0.8% | 6.6% | 0.4% | 11.8% | 7.1% | 22.4% |
| 127 | Little Rock | AR | Midsize | 60.4 | 49.1% | 42.6% | 0.7% | 3.2% | 0.1% | 2.3% | 2.1% | 8.2% |
| 128 | Redwood City | CA | Small | 60.3 | 58.8% | 2.0% | 1.0% | 13.4% | 0.7% | 18.2% | 5.9% | 39.1% |
| 129 | Fort Worth | TX | Large | 60.2 | 60.8% | 19.0% | 0.7% | 4.8% | 0.2% | 11.5% | 3.1% | 35.5% |
| 130 | Vacaville | CA | Midsize | 60.0 | 65.0% | 11.1% | 0.5% | 7.0% | 3.2% | 4.9% | 8.3% | 20.4% |
| 131 | Jacksonville | FL | Large | 59.9 | 58.1% | 30.7% | 0.4% | 4.8% | 0.0% | 2.4% | 3.7% | 10.4% |
| 132 | Ellicott City | MD | Small | 59.8 | 57.1% | 9.8% | 0.0% | 28.6% | 0.1% | 2.4% | 2.0% | 4.6% |
| 133 | Columbus | OH | Large | 59.8 | 57.6% | 29.2% | 0.3% | 6.2% | 0.0% | 1.8% | 4.8% | 6.0% |
| 134 | Pleasanton | CA | Small | 59.8 | 56.3% | 1.7% | 0.5% | 34.5% | 0.0% | 1.7% | 5.3% | 11.5% |
| 135 | Houston | TX | Large | 59.7 | 53.8% | 22.5% | 0.4% | 7.3% | 0.1% | 13.8% | 2.2% | 44.9% |
| 136 | Bellevue | WA | Midsize | 59.7 | 53.2% | 2.9% | 0.1% | 37.3% | 0.0% | 1.8% | 4.7% | 6.3% |
| 137 | Daytona Beach | FL | Small | 59.7 | 57.1% | 32.6% | 0.0% | 3.0% | 0.2% | 4.8% | 2.4% | 9.6% |
| 138 | Redmond | WA | Small | 59.7 | 56.9% | 2.1% | 0.6% | 34.2% | 0.0% | 2.6% | 3.7% | 12.4% |
| 139 | Hampton | VA | Midsize | 59.6 | 41.0% | 50.5% | 0.2% | 2.0% | 0.2% | 1.5% | 4.7% | 6.0% |
| 140 | Waterbury | CT | Midsize | 59.6 | 60.8% | 21.9% | 0.5% | 2.1% | 0.0% | 10.7% | 3.9% | 35.4% |
| 141 | Plantation | FL | Small | 59.6 | 62.5% | 24.3% | 0.2% | 4.4% | 0.0% | 4.4% | 4.1% | 25.6% |
| 142 | Upland | CA | Small | 59.4 | 61.5% | 5.4% | 1.8% | 13.7% | 0.1% | 11.8% | 5.7% | 38.9% |
| 143 | Lansing | MI | Midsize | 59.4 | 62.2% | 22.8% | 0.4% | 3.4% | 0.0% | 2.0% | 9.0% | 13.9% |
| 144 | Alexandria | VA | Midsize | 59.4 | 62.9% | 22.8% | 0.0% | 5.7% | 0.1% | 3.2% | 5.4% | 16.7% |
| 145 | Indianapolis | IN | Large | 59.4 | 59.1% | 29.5% | 0.2% | 3.7% | 0.1% | 4.2% | 3.1% | 10.2% |
| 146 | Tampa | FL | Large | 59.3 | 62.7% | 24.1% | 0.3% | 3.8% | 0.0% | 3.9% | 5.1% | 27.0% |
| 147 | Savannah | GA | Midsize | 59.3 | 41.5% | 50.6% | 0.2% | 2.8% | 0.5% | 1.7% | 2.7% | 6.3% |
| 148 | Bayonne | NJ | Small | 59.3 | 58.9% | 11.8% | 0.0% | 10.5% | 0.0% | 16.9% | 1.8% | 41.5% |
| 149 | South Bend | IN | Midsize | 59.3 | 61.5% | 26.5% | 0.4% | 1.8% | 0.0% | 5.5% | 4.2% | 15.6% |
| 150 | Huntsville | AL | Midsize | 59.3 | 57.5% | 31.1% | 0.7% | 3.1% | 0.0% | 3.5% | 4.1% | 6.7% |
| 151 | Lake Forest | CA | Small | 59.0 | 64.2% | 3.8% | 0.2% | 20.1% | 0.4% | 4.3% | 6.9% | 18.1% |
| 152 | Providence | RI | Midsize | 59.0 | 59.5% | 17.5% | 0.4% | 7.1% | 0.0% | 11.0% | 4.4% | 41.9% |
| 153 | Atlanta | GA | Large | 58.9 | 40.9% | 51.0% | 0.2% | 4.0% | 0.0% | 1.3% | 2.7% | 4.6% |
| 154 | Tallahassee | FL | Midsize | 58.8 | 55.4% | 35.6% | 0.3% | 5.1% | 0.1% | 0.9% | 2.6% | 7.0% |
| 155 | Suffolk | VA | Small | 58.8 | 51.0% | 40.9% | 0.2% | 2.1% | 0.0% | 1.3% | 4.5% | 4.7% |
| 156 | West Palm Beach | FL | Midsize | 58.8 | 59.4% | 33.2% | 0.0% | 1.8% | 0.0% | 2.5% | 3.1% | 27.0% |
| 157 | Pompano Beach | FL | Midsize | 58.8 | 57.3% | 36.8% | 0.2% | 1.3% | 0.0% | 1.8% | 2.5% | 19.6% |
| 158 | San Diego | CA | Large | 58.7 | 64.9% | 6.8% | 0.4% | 16.9% | 0.4% | 5.2% | 5.4% | 30.1% |
| 159 | St. Louis | MO | Large | 58.6 | 47.1% | 45.4% | 0.2% | 3.6% | 0.1% | 0.9% | 2.7% | 4.1% |
| 160 | Clovis | CA | Midsize | 58.6 | 65.8% | 5.0% | 1.6% | 10.2% | 0.0% | 9.8% | 7.8% | 30.8% |
| 161 | Champaign | IL | Small | 58.5 | 61.1% | 19.4% | 0.0% | 16.0% | 0.0% | 1.7% | 1.8% | 6.0% |
| 162 | Los Angeles | CA | Large | 58.5 | 51.9% | 8.7% | 0.8% | 12.1% | 0.2% | 22.5% | 3.9% | 48.9% |
| 163 | Richmond | VA | Midsize | 58.5 | 47.2% | 46.6% | 0.1% | 2.4% | 0.0% | 0.8% | 2.9% | 7.1% |
| 164 | Minneapolis | MN | Large | 58.3 | 63.7% | 19.4% | 1.8% | 6.3% | 0.0% | 4.2% | 4.6% | 9.6% |
| 165 | Stamford | CT | Midsize | 58.3 | 66.4% | 10.1% | 0.3% | 9.2% | 0.0% | 10.4% | 3.5% | 26.5% |
| 166 | Tulsa | OK | Large | 58.3 | 65.8% | 15.9% | 4.5% | 3.0% | 0.0% | 3.3% | 7.5% | 16.7% |
| 167 | Gainesville | FL | Midsize | 58.2 | 62.9% | 24.3% | 0.4% | 6.9% | 0.1% | 1.1% | 4.3% | 13.1% |
| 168 | Cincinnati | OH | Large | 58.2 | 51.4% | 40.7% | 0.1% | 2.3% | 0.0% | 1.4% | 4.1% | 3.6% |
| 169 | Palatine | IL | Small | 58.1 | 66.4% | 2.9% | 0.7% | 12.5% | 0.0% | 12.4% | 5.1% | 22.2% |
| 170 | Kansas City | MO | Large | 58.1 | 61.1% | 28.4% | 0.4% | 2.5% | 0.1% | 3.3% | 4.2% | 10.7% |
| 171 | Columbia | SC | Midsize | 58.0 | 51.6% | 41.3% | 0.3% | 2.2% | 0.2% | 0.8% | 3.6% | 4.9% |
| 172 | Jackson | TN | Small | 58.0 | 45.7% | 47.9% | 0.1% | 1.5% | 0.0% | 3.9% | 0.8% | 5.2% |
| 173 | Springdale | AR | Small | 58.0 | 63.5% | 3.1% | 1.9% | 2.2% | 6.5% | 20.1% | 2.7% | 36.9% |
| 174 | Yuba City | CA | Small | 57.9 | 66.0% | 2.2% | 0.9% | 16.7% | 1.9% | 4.9% | 7.5% | 30.3% |
| 175 | Dayton | OH | Midsize | 57.9 | 53.2% | 39.3% | 0.6% | 1.2% | 0.0% | 1.8% | 3.8% | 4.8% |
| 176 | Greenville | NC | Small | 57.8 | 54.6% | 37.6% | 0.7% | 3.0% | 0.0% | 1.4% | 2.7% | 4.9% |
| 177 | Mount Vernon | NY | Small | 57.8 | 19.8% | 65.2% | 0.1% | 1.0% | 0.0% | 10.2% | 3.8% | 19.2% |
| 178 | Fort Lauderdale | FL | Midsize | 57.8 | 61.3% | 31.7% | 0.4% | 1.8% | 0.2% | 2.6% | 2.0% | 19.4% |
| 179 | Lynn | MA | Small | 57.8 | 52.8% | 16.3% | 0.1% | 5.1% | 0.0% | 21.1% | 4.7% | 49.2% |
| 180 | Plano | TX | Midsize | 57.7 | 64.0% | 7.6% | 0.5% | 23.2% | 0.0% | 1.6% | 3.0% | 14.8% |
| 181 | Rock Hill | SC | Small | 57.7 | 56.7% | 36.8% | 0.3% | 1.2% | 0.0% | 2.5% | 2.5% | 9.9% |
| 182 | Lancaster | CA | Midsize | 57.7 | 59.7% | 20.3% | 1.0% | 4.0% | 0.1% | 10.9% | 4.0% | 43.7% |
| 183 | Tustin | CA | Small | 57.7 | 47.8% | 2.7% | 0.1% | 19.3% | 0.1% | 27.0% | 3.1% | 50.5% |
| 184 | Tacoma | WA | Midsize | 57.6 | 65.9% | 9.4% | 1.8% | 9.4% | 1.3% | 2.0% | 10.1% | 11.2% |
| 185 | Richardson | TX | Midsize | 57.6 | 66.2% | 9.9% | 1.0% | 16.5% | 0.1% | 3.8% | 2.4% | 18.7% |
| 186 | Toledo | OH | Midsize | 57.6 | 61.2% | 27.6% | 0.4% | 1.0% | 0.1% | 2.8% | 6.8% | 9.0% |
| 187 | Bellflower | CA | Small | 57.6 | 31.5% | 12.6% | 0.3% | 13.0% | 1.6% | 36.4% | 4.5% | 55.1% |
| 188 | Peoria | IL | Midsize | 57.5 | 61.2% | 25.8% | 0.4% | 6.5% | 0.0% | 1.4% | 4.7% | 6.0% |
| 189 | Chino | CA | Small | 57.5 | 55.1% | 6.1% | 0.5% | 17.1% | 0.2% | 15.3% | 5.6% | 48.9% |
| 190 | Garland | TX | Midsize | 57.5 | 61.3% | 14.7% | 1.1% | 12.4% | 0.0% | 8.0% | 2.5% | 43.2% |
| 191 | Farmington Hills | MI | Small | 57.4 | 61.2% | 20.2% | 0.7% | 15.2% | 0.2% | 0.1% | 2.4% | 3.3% |
| 192 | Concord | NC | Small | 57.4 | 63.7% | 23.8% | 0.0% | 5.6% | 0.1% | 3.7% | 3.0% | 12.2% |
| 193 | Victorville | CA | Midsize | 57.4 | 57.4% | 23.5% | 1.7% | 4.8% | 0.4% | 6.6% | 5.7% | 46.4% |
| 194 | Oklahoma City | OK | Large | 57.3 | 67.4% | 14.0% | 3.2% | 5.1% | 0.1% | 4.7% | 5.4% | 19.7% |
| 195 | Palo Alto | CA | Small | 57.3 | 56.6% | 1.9% | 0.1% | 34.9% | 0.0% | 1.0% | 5.4% | 4.8% |
| 196 | Santa Rosa | CA | Midsize | 57.2 | 63.9% | 1.4% | 1.4% | 5.3% | 0.1% | 22.9% | 5.0% | 36.0% |
| 197 | Clarksville | TN | Midsize | 57.1 | 62.9% | 25.9% | 1.0% | 3.1% | 0.3% | 2.6% | 4.1% | 10.7% |
| 198 | Framingham | MA | Small | 57.1 | 67.2% | 7.7% | 0.0% | 8.7% | 0.0% | 14.5% | 2.0% | 19.6% |
| 199 | Gulfport | MS | Small | 57.0 | 52.4% | 41.7% | 0.3% | 1.8% | 0.0% | 0.8% | 3.1% | 4.9% |
| 200 | Frisco | TX | Midsize | 57.0 | 64.5% | 9.7% | 0.5% | 20.8% | 0.0% | 1.7% | 2.8% | 11.0% |
Most Prosperous Diverse Cities in the United States
Below is a list of the most prosperous diverse cities in the United States. Cities in this list had a Diversity Score in the top 20% of cities in this study, while also having a median household income of $60,000 or more, which is above the national median household income.
| City | State | Median Household Income (2018) |
|---|---|---|
| Anchorage | AK | $83,648 |
| San Ramon | CA | $175,974 |
| Sunnyvale | CA | $150,450 |
| Mountain View | CA | $150,405 |
| Fremont | CA | $136,718 |
| San Mateo | CA | $131,150 |
| Santa Clara | CA | $127,245 |
| Union City | CA | $123,780 |
| Redwood City | CA | $121,152 |
| Castro Valley | CA | $116,325 |
| Alameda | CA | $114,750 |
| San Jose | CA | $113,036 |
| San Francisco | CA | $112,376 |
| Chino Hills | CA | $103,552 |
| South San Francisco | CA | $102,365 |
| Irvine | CA | $101,667 |
| Tracy | CA | $98,630 |
| Torrance | CA | $96,492 |
| Lakewood | CA | $94,290 |
| Rancho Cucamonga | CA | $91,983 |
| Elk Grove | CA | $91,820 |
| Concord | CA | $91,185 |
| Vacaville | CA | $90,673 |
| Carson | CA | $85,776 |
| Daly City | CA | $85,370 |
| Buena Park | CA | $83,953 |
| West Covina | CA | $82,474 |
| San Leandro | CA | $81,722 |
| Fairfield | CA | $81,652 |
| Berkeley | CA | $81,362 |
| Pittsburg | CA | $81,355 |
| Hayward | CA | $80,134 |
| Pasadena | CA | $77,549 |
| Vallejo | CA | $77,543 |
| Oakland | CA | $76,469 |
| Fullerton | CA | $74,712 |
| Garden Grove | CA | $73,212 |
| Richmond | CA | $72,270 |
| Antioch | CA | $71,466 |
| Sacramento | CA | $65,046 |
| Rancho Cordova | CA | $63,732 |
| Westminster | CA | $62,618 |
| Hawthorne | CA | $62,478 |
| Long Beach | CA | $61,610 |
| Aurora | CO | $63,128 |
| Danbury | CT | $66,820 |
| Washington | DC | $85,203 |
| Miramar | FL | $68,293 |
| Johns Creek | GA | $121,848 |
| Honolulu | HI | $71,247 |
| Schaumburg | IL | $84,146 |
| Bolingbrook | IL | $82,721 |
| Skokie | IL | $67,487 |
| Rockville | MD | $114,044 |
| Columbia | MD | $103,246 |
| Germantown | MD | $91,824 |
| Silver Spring | MD | $81,992 |
| Gaithersburg | MD | $76,982 |
| Boston | MA | $71,834 |
| Brockton | MA | $63,043 |
| Brooklyn Park | MN | $70,214 |
| Enterprise | NV | $81,778 |
| Jersey City | NJ | $72,561 |
| New Rochelle | NY | $86,606 |
| New York | NY | $63,799 |
| Yonkers | NY | $60,436 |
| Raleigh | NC | $65,695 |
| Charlotte | NC | $60,764 |
| Sugar Land | TX | $110,495 |
| Missouri City | TX | $91,099 |
| Pearland | TX | $90,223 |
| Irving | TX | $67,237 |
| Arlington | TX | $63,091 |
| West Valley City | UT | $64,335 |
| Centreville | VA | $115,701 |
| Dale City | VA | $99,554 |
| Renton | WA | $78,023 |
| Kent | WA | $70,278 |
| Auburn | WA | $67,342 |
| Federal Way | WA | $66,653 |
Methodology
This study examined ethnic and racial diversity in 607 cities around the country using data from the American Community Survey from the U.S. Census Bureau. The Census Bureau collects data on the following categories of race:
- White
- Black or African American
- Native American or Alaska Native
- Asian
- Native Hawaiian or Pacific Islander
- Some Other Race
- Two or More Races (Multiracial)
Additionally, the Census Bureau collects information about Hispanic or Latino origin separately from race data.
To conduct this study, AdvisorSmith created a Diversity Score based upon the Census Bureau’s race categories as well as Hispanic or Latino origin. We used a modified, weighted version of the Simpson index, which is a measure of concentration where individuals are assigned different types.
Our Diversity Score calculated the Simpson index for the Census Bureau’s categories of race for each city. We weighted this index by the proportion of the city’s population that was not Hispanic or Latino. We also applied the Simpson index to the proportion of the population that was Hispanic or Latino in each city, and we combined the results of the two calculations to produce a Diversity Score which measures ethnic and racial diversity.
We then ranked the cities based upon their Diversity Score to find the most diverse cities in the United States. We also categorized the cities by population size, with small cities having populations under 100,000, midsize cities having populations of 100,000 to 300,000, and large cities having populations of 300,000 or more. We ranked the cities based upon their Diversity Scores within city size categories.
Sources
1. U.S. Census Bureau, American Community Survey