


The average profitability of the property and casualty insurance industry was 7% over the past five years. This profitability measure is across all lines of property and casualty insurance during the five-year period from 2014-2019. In 2019, the property and casualty insurance industry had approximately $687.5 billion in direct written premiums.
In this analysis, AdvisorSmith examined 19 lines of property and casualty insurance to determine the most and least profitable types of P&C insurance over the past five years as measured by return on net worth. We also studied the levels of insurance profitability in all 50 states and the District of Columbia.
Most and Least Profitable Types of Insurance
Over the past five years, the average profitability of different lines of insurance varied markedly based upon the type of insurance. The average profitability of the 19 lines of insurance ranged from as low as 1% of net worth up to a maximum of 30.5% of net worth. These profitability figures are influenced by structural factors as well as cyclical economic conditions.
| Rank | Line | Average Profitability % (2014-2019) | 2014 | 2015 | 2016 | 2017 | 2018 | 2019 | Written Premiums (2019, in millions) |
|---|---|---|---|---|---|---|---|---|---|
| 1 | Mortgage Guaranty | 30.5 | 16.3 | 18.5 | 22.1 | 26.1 | 46.3 | 53.8 | $5,898 |
| 2 | Inland Marine | 20.2 | 19.7 | 18.6 | 19.2 | 14.7 | 26 | 23.2 | $25,238 |
| 3 | Fire | 13.6 | 19.9 | 22.3 | 16.1 | 3.9 | 4.3 | 15.2 | $13,266 |
| 4 | Warranty | 12.7 | 11.3 | 11.4 | 13.6 | 13.9 | 14.6 | 11.1 | $2,783 |
| 5 | Workers Compensation | 9.8 | 7.5 | 8.4 | 8.2 | 9.5 | 13 | 12.2 | $55,872 |
| 6 | Farmowners Multiple Peril | 8 | 6.1 | 13.5 | 11.4 | -0.9 | 8.1 | 9.5 | $4,507 |
| 7 | Homeowners Multiple Peril | 7.1 | 13 | 13.1 | 11 | -2.3 | -1.9 | 9.8 | $101,303 |
| 8 | Private Passenger Auto Physical | 7 | 5.8 | 5.1 | 2.3 | 5.5 | 12.3 | 10.8 | $101,188 |
| 9 | Medical Professional Liability | 6.8 | 9.3 | 7.8 | 4.7 | 6.7 | 8.3 | 4 | $9,608 |
| 10 | Commercial Multiple Peril | 5.7 | 8.5 | 10 | 6.7 | 0.4 | 2.9 | 5.8 | $43,023 |
| 11 | Commercial Auto Physical | 5.3 | 3.3 | 4.7 | 3.1 | 1.4 | 8 | 11.2 | $10,271 |
| 12 | Products Liability | 4.9 | 4.6 | 4.4 | 4.9 | 7.5 | 2 | 6.1 | $3,907 |
| 13 | Private Passenger Auto Total | 4.4 | 4.3 | 2.7 | 0.7 | 3.7 | 7.5 | 7.2 | $251,559 |
| 14 | Allied Lines | 4.1 | 16.5 | 20.7 | 11.2 | -33.6 | 2 | 7.5 | $27,705 |
| 15 | Financial Guaranty | 3.6 | 11.1 | 10 | 3.7 | -4.8 | 5.5 | -3.8 | $541 |
| 16 | Private Passenger Auto Liability | 3.3 | 3.7 | 1.8 | 0 | 2.9 | 5.6 | 5.8 | $150,371 |
| 17 | Commercial Auto Total | 1.7 | 3.1 | 2 | 0.7 | 1.4 | 1.4 | 1.5 | $43,037 |
| 18 | Accident and Health | 1.7 | 1.7 | 1 | -0.1 | 1 | 3.5 | 2.8 | $6,635 |
| 19 | Commercial Auto Liability | 1 | 3 | 1.5 | 0.2 | 1.4 | 0.2 | -0.3 | $32,766 |
| Total All Lines | 7 | 8.4 | 7.9 | 5.8 | 3.9 | 7.3 | 8.6 | $687,525 |
The most profitable line of P&C insurance over the past five years was mortgage guaranty insurance. This line of insurance is relatively small, accounting for about $6 billion in written premiums in 2019, but profits in the line have been steadily rising, buoyed by rising home prices, low mortgage rates, and low rates of default.
The least profitable line of insurance over the past five years was commercial auto liability, with average profitability of only 1%. Underwriting losses in commercial auto liability have been higher than most other lines of insurance, leading to chronically low profitability in the line.

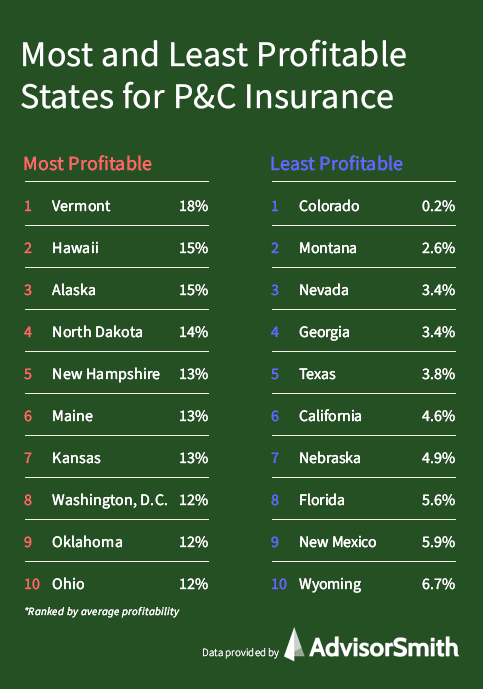
Most Profitable States for P&C Insurance Companies
The profitability of insurance varies widely by state, with the range of profitability being as low as 0.2%, up to a high of 17.7%. The most profitable states were states with relatively small populations and small insurance markets. The small size of these markets limits the number of competitors that are interested in offering products in these markets, which leads to higher pricing and profitability.
The top five states for insurance profitability were:
- Vermont, with average profitability of 17.7%
- Hawaii, with average profitability of 14.7%
- Alaska, with average profitability of 14.7%
- North Dakota, with average profitability of 14.0%
- New Hampshire, with average profitability of 13.0%
| Rank | State | Average Profitability % (2014-2019) | 2014 | 2015 | 2016 | 2017 | 2018 | 2019 | Written Premiums (2019, in millions) | |
|---|---|---|---|---|---|---|---|---|---|---|
| 1 | Vermont | 17.7 | 14.2 | 15.4 | 17 | 18.7 | 21 | 19.8 | $1,489 | |
| 2 | Hawaii | 14.7 | 15.6 | 14.5 | 14.9 | 9.3 | 17.9 | 16.2 | $2,660 | |
| 3 | Alaska | 14.7 | 19.4 | 16.3 | 13 | 10.3 | 11.1 | 18 | $1,641 | |
| 4 | North Dakota | 14.0 | 12.8 | 22.3 | 4.3 | 17.7 | 23.9 | 2.7 | $2,573 | |
| 5 | New Hampshire | 13.0 | 12.2 | 11 | 12.9 | 10.6 | 14.5 | 16.6 | $2,551 | |
| 6 | Maine | 12.6 | 9.3 | 11.4 | 12.8 | 11.7 | 16.2 | 14.3 | $2,434 | |
| 7 | Kansas | 12.6 | 10.3 | 14 | 12.9 | 11.6 | 15 | 11.5 | $6,883 | |
| 8 | District of Columbia | 12.4 | 16.1 | 12.6 | 3.4 | 7.8 | 13.9 | 20.5 | $2,001 | |
| 9 | Oklahoma | 12.2 | 13 | 7.9 | 10.2 | 12.3 | 16.6 | 13.3 | $8,489 | |
| 10 | Ohio | 12.1 | 12.6 | 11.3 | 10.8 | 12.5 | 16.6 | 8.6 | $17,479 | |
| 11 | Indiana | 10.7 | 9.9 | 10 | 8 | 9.8 | 15.4 | 11.3 | $11,824 | |
| 12 | Tennessee | 10.6 | 10.6 | 9.4 | 4.6 | 8.2 | 15.4 | 15.4 | $12,356 | |
| 13 | Massachusetts | 10.3 | 10.6 | 3 | 10.1 | 12.3 | 12.4 | 13.5 | $15,968 | |
| 14 | West Virginia | 10.3 | 12.8 | 11.8 | 5 | 11 | 9.2 | 12.1 | $3,133 | |
| 15 | Virginia | 10.1 | 11.5 | 10.8 | 6.7 | 9 | 9.8 | 13 | $14,561 | |
| 16 | Oregon | 10.1 | 11.9 | 9.1 | 7.4 | 7.3 | 15.6 | 9.4 | $7,568 | |
| 17 | Wisconsin | 10.0 | 7.5 | 11.7 | 9.5 | 9.9 | 11.1 | 10.3 | $11,049 | |
| 18 | Delaware | 10.0 | 5.6 | 7.7 | 9.2 | 9.3 | 15.3 | 12.6 | $2,884 | |
| 19 | Connecticut | 9.9 | 9.6 | 8.4 | 9.9 | 10.4 | 9.5 | 11.6 | $9,020 | |
| 20 | Utah | 9.9 | 11.9 | 9.5 | 6.6 | 10.3 | 11.3 | 9.8 | $5,244 | |
| 21 | Mississippi | 9.9 | 7.6 | 10.4 | 7.9 | 9.4 | 13.2 | 10.7 | $5,497 | |
| 22 | Minnesota | 9.2 | 8.1 | 11.2 | 11.4 | 7.4 | 13.7 | 3.3 | $12,214 | |
| 23 | South Dakota | 9.0 | 9.5 | 14.7 | 15.6 | 11.5 | 13.9 | -11 | $2,526 | |
| 24 | Alabama | 8.8 | 9.4 | 10.1 | 6 | 6.6 | 7.6 | 12.9 | $9,275 | |
| 25 | Rhode Island | 8.5 | 9.8 | 0.9 | 8.3 | 11.3 | 8.7 | 12.1 | $2,573 | |
| 26 | Illinois | 8.4 | 8.2 | 8.3 | 8.5 | 8.7 | 11.1 | 5.8 | $26,230 | |
| 27 | Idaho | 8.3 | 9.5 | 8.7 | 9.2 | 3.6 | 7.3 | 11.7 | $3,113 | |
| 28 | Washington | 8.3 | 8.5 | 5.7 | 7 | 7.5 | 11.2 | 9.9 | $13,386 | |
| 29 | Missouri | 8.3 | 9 | 7.1 | 6.2 | 5.9 | 12.5 | 8.8 | $12,388 | |
| 30 | North Carolina | 8.1 | 12.7 | 10.9 | 6.4 | 10.6 | -3.1 | 11 | $16,978 | |
| 31 | Iowa | 8.0 | -5.3 | 13 | 13 | 10.1 | 3.5 | 13.8 | $6,713 | |
| 32 | Kentucky | 8.0 | 8.7 | 5.1 | 6 | 7.8 | 10.5 | 9.8 | $7,953 | |
| 33 | Arizona | 7.9 | 6.9 | 7.8 | 4.9 | 7.4 | 9.1 | 11.3 | $12,108 | |
| 34 | New Jersey | 7.6 | 7.4 | 6.1 | 6.8 | 8.6 | 8.4 | 8.1 | $22,592 | |
| 35 | Pennsylvania | 7.5 | 5.1 | 7.1 | 6.9 | 9.8 | 8.9 | 7.3 | $25,799 | |
| 36 | Arkansas | 7.5 | 9.9 | 5.8 | 1.4 | 11.3 | 8.7 | 7.6 | $5,619 | |
| 37 | Maryland | 7.4 | 8.4 | 6.2 | 6.7 | 8 | 6.3 | 8.6 | $12,530 | |
| 38 | New York | 7.1 | 7.9 | 6.1 | 6.1 | 7.7 | 7.9 | 7 | $49,006 | |
| 39 | Michigan | 6.7 | 3.4 | 7.1 | 5.5 | 6.9 | 6.8 | 10.7 | $20,477 | |
| 40 | South Carolina | 6.7 | 6.8 | 4.9 | 0.7 | 6.1 | 11.4 | 10.5 | $10,468 | |
| 41 | Louisiana | 6.7 | 10.9 | 9.3 | -8.7 | 9.4 | 11 | 8.4 | $12,230 | |
| 42 | Wyoming | 6.7 | 10.1 | 15.3 | 5.3 | 10 | 0 | -0.5 | $1,261 | |
| 43 | New Mexico | 5.9 | 9.5 | 5.3 | 3.8 | 4.7 | 3.9 | 8.2 | $3,671 | |
| 44 | Florida | 5.6 | 13.9 | 12.1 | 8.9 | -3.4 | -1.5 | 3.5 | $55,288 | |
| 45 | Nebraska | 4.9 | -10.3 | 13.9 | 4.1 | 3.6 | 15.3 | 2.5 | $5,131 | |
| 46 | California | 4.6 | 7.5 | 6.1 | 5.2 | -1.9 | -0.2 | 10.9 | $82,478 | |
| 47 | Texas | 3.8 | 10.1 | 6.4 | -1.2 | -10.4 | 12.7 | 5.1 | $60,458 | |
| 48 | Georgia | 3.4 | 4.8 | 4.1 | 0.8 | 2.4 | 2.9 | 5.4 | $22,393 | |
| 49 | Nevada | 3.4 | 7.4 | 3.3 | 1.1 | 4.1 | -1.6 | 6 | $6,073 | |
| 50 | Montana | 2.6 | -0.6 | 6.9 | -1.1 | 7.2 | 10.5 | -7.2 | $2,574 | |
| 51 | Colorado | 0.2 | -0.2 | 6.3 | -0.4 | -1.3 | -10.2 | 6.7 | $13,843 |
Least Profitable States for P&C Insurance Companies
The least profitable states for insurance companies were a mix of small states along with the largest states in the country, including California, Texas, and Florida in the top 10. Large states had more competitive insurance markets, which leads to more competitive pricing, driving down profitability. The small states that were not profitable tended to have high loss ratios, leading to lower profitability.
The five least profitable states for P&C insurance were:
- Colorado, with average profitability of 0.2%
- Montana, with average profitability of 2.6%
- Nevada, with average profitability of 3.4%
- Georgia, with average profitability of 3.4%
- Texas, with average profitability of 3.8%
| Rank | State | Average Profitability % (2014-2019) | 2014 | 2015 | 2016 | 2017 | 2018 | 2019 | Written Premiums (2019, in millions) | |
|---|---|---|---|---|---|---|---|---|---|---|
| 1 | Colorado | 0.2 | -0.2 | 6.3 | -0.4 | -1.3 | -10.2 | 6.7 | $13,843 | |
| 2 | Montana | 2.6 | -0.6 | 6.9 | -1.1 | 7.2 | 10.5 | -7.2 | $2,574 | |
| 3 | Nevada | 3.4 | 7.4 | 3.3 | 1.1 | 4.1 | -1.6 | 6 | $6,073 | |
| 4 | Georgia | 3.4 | 4.8 | 4.1 | 0.8 | 2.4 | 2.9 | 5.4 | $22,393 | |
| 5 | Texas | 3.8 | 10.1 | 6.4 | -1.2 | -10.4 | 12.7 | 5.1 | $60,458 | |
| 6 | California | 4.6 | 7.5 | 6.1 | 5.2 | -1.9 | -0.2 | 10.9 | $82,478 | |
| 7 | Nebraska | 4.9 | -10.3 | 13.9 | 4.1 | 3.6 | 15.3 | 2.5 | $5,131 | |
| 8 | Florida | 5.6 | 13.9 | 12.1 | 8.9 | -3.4 | -1.5 | 3.5 | $55,288 | |
| 9 | New Mexico | 5.9 | 9.5 | 5.3 | 3.8 | 4.7 | 3.9 | 8.2 | $3,671 | |
| 10 | Wyoming | 6.7 | 10.1 | 15.3 | 5.3 | 10 | 0 | -0.5 | $1,261 | |
| 11 | Louisiana | 6.7 | 10.9 | 9.3 | -8.7 | 9.4 | 11 | 8.4 | $12,230 | |
| 12 | South Carolina | 6.7 | 6.8 | 4.9 | 0.7 | 6.1 | 11.4 | 10.5 | $10,468 | |
| 13 | Michigan | 6.7 | 3.4 | 7.1 | 5.5 | 6.9 | 6.8 | 10.7 | $20,477 | |
| 14 | New York | 7.1 | 7.9 | 6.1 | 6.1 | 7.7 | 7.9 | 7 | $49,006 | |
| 15 | Maryland | 7.4 | 8.4 | 6.2 | 6.7 | 8 | 6.3 | 8.6 | $12,530 | |
| 16 | Arkansas | 7.5 | 9.9 | 5.8 | 1.4 | 11.3 | 8.7 | 7.6 | $5,619 | |
| 17 | Pennsylvania | 7.5 | 5.1 | 7.1 | 6.9 | 9.8 | 8.9 | 7.3 | $25,799 | |
| 18 | New Jersey | 7.6 | 7.4 | 6.1 | 6.8 | 8.6 | 8.4 | 8.1 | $22,592 | |
| 19 | Arizona | 7.9 | 6.9 | 7.8 | 4.9 | 7.4 | 9.1 | 11.3 | $12,108 | |
| 20 | Kentucky | 8.0 | 8.7 | 5.1 | 6 | 7.8 | 10.5 | 9.8 | $7,953 | |
| 21 | Iowa | 8.0 | -5.3 | 13 | 13 | 10.1 | 3.5 | 13.8 | $6,713 | |
| 22 | North Carolina | 8.1 | 12.7 | 10.9 | 6.4 | 10.6 | -3.1 | 11 | $16,978 | |
| 23 | Missouri | 8.3 | 9 | 7.1 | 6.2 | 5.9 | 12.5 | 8.8 | $12,388 | |
| 24 | Washington | 8.3 | 8.5 | 5.7 | 7 | 7.5 | 11.2 | 9.9 | $13,386 | |
| 25 | Idaho | 8.3 | 9.5 | 8.7 | 9.2 | 3.6 | 7.3 | 11.7 | $3,113 | |
| 26 | Illinois | 8.4 | 8.2 | 8.3 | 8.5 | 8.7 | 11.1 | 5.8 | $26,230 | |
| 27 | Rhode Island | 8.5 | 9.8 | 0.9 | 8.3 | 11.3 | 8.7 | 12.1 | $2,573 | |
| 28 | Alabama | 8.8 | 9.4 | 10.1 | 6 | 6.6 | 7.6 | 12.9 | $9,275 | |
| 29 | South Dakota | 9.0 | 9.5 | 14.7 | 15.6 | 11.5 | 13.9 | -11 | $2,526 | |
| 30 | Minnesota | 9.2 | 8.1 | 11.2 | 11.4 | 7.4 | 13.7 | 3.3 | $12,214 | |
| 31 | Mississippi | 9.9 | 7.6 | 10.4 | 7.9 | 9.4 | 13.2 | 10.7 | $5,497 | |
| 32 | Utah | 9.9 | 11.9 | 9.5 | 6.6 | 10.3 | 11.3 | 9.8 | $5,244 | |
| 33 | Connecticut | 9.9 | 9.6 | 8.4 | 9.9 | 10.4 | 9.5 | 11.6 | $9,020 | |
| 34 | Delaware | 10.0 | 5.6 | 7.7 | 9.2 | 9.3 | 15.3 | 12.6 | $2,884 | |
| 35 | Wisconsin | 10.0 | 7.5 | 11.7 | 9.5 | 9.9 | 11.1 | 10.3 | $11,049 | |
| 36 | Oregon | 10.1 | 11.9 | 9.1 | 7.4 | 7.3 | 15.6 | 9.4 | $7,568 | |
| 37 | Virginia | 10.1 | 11.5 | 10.8 | 6.7 | 9 | 9.8 | 13 | $14,561 | |
| 38 | West Virginia | 10.3 | 12.8 | 11.8 | 5 | 11 | 9.2 | 12.1 | $3,133 | |
| 39 | Massachusetts | 10.3 | 10.6 | 3 | 10.1 | 12.3 | 12.4 | 13.5 | $15,968 | |
| 40 | Tennessee | 10.6 | 10.6 | 9.4 | 4.6 | 8.2 | 15.4 | 15.4 | $12,356 | |
| 41 | Indiana | 10.7 | 9.9 | 10 | 8 | 9.8 | 15.4 | 11.3 | $11,824 | |
| 42 | Ohio | 12.1 | 12.6 | 11.3 | 10.8 | 12.5 | 16.6 | 8.6 | $17,479 | |
| 43 | Oklahoma | 12.2 | 13 | 7.9 | 10.2 | 12.3 | 16.6 | 13.3 | $8,489 | |
| 44 | District of Columbia | 12.4 | 16.1 | 12.6 | 3.4 | 7.8 | 13.9 | 20.5 | $2,001 | |
| 45 | Kansas | 12.6 | 10.3 | 14 | 12.9 | 11.6 | 15 | 11.5 | $6,883 | |
| 46 | Maine | 12.6 | 9.3 | 11.4 | 12.8 | 11.7 | 16.2 | 14.3 | $2,434 | |
| 47 | New Hampshire | 13.0 | 12.2 | 11 | 12.9 | 10.6 | 14.5 | 16.6 | $2,551 | |
| 48 | North Dakota | 14.0 | 12.8 | 22.3 | 4.3 | 17.7 | 23.9 | 2.7 | $2,573 | |
| 49 | Alaska | 14.7 | 19.4 | 16.3 | 13 | 10.3 | 11.1 | 18 | $1,641 | |
| 50 | Hawaii | 14.7 | 15.6 | 14.5 | 14.9 | 9.3 | 17.9 | 16.2 | $2,660 | |
| 51 | Vermont | 17.7 | 14.2 | 15.4 | 17 | 18.7 | 21 | 19.8 | $1,489 |
How is insurance profitability measured?
For-profit insurance companies are businesses, and like all businesses, profitability is an important consideration for the owners and shareholders in the business. Additionally, the ability of insurance companies to earn profits provides security for policyholders because they can rest assured that their insurance company has the financial resources to pay for any claims they might have.
Unlike many businesses, insurance companies’ main product is a promise to pay, rather than a tangible good or service. In order to start and maintain an insurance company, an insurer needs to raise funds that can be used to satisfy potential claims, which is commonly called “capital.” Insurance companies have a “net worth,” which consists of the capital raised by the insurance company plus earned premiums and gains from investments minus underwriting losses and dividends to shareholders.
The profitability of insurance is measured relative to the net worth of each insurance company, expressed as a percentage. For example, if an insurance company has $10 million in net worth in a given year, and the company earns $1 million from a combination of earned premiums and investment gains, the insurance company’s profitability measured as a return on net worth would be 10%.
What determines insurance profitability?
The profitability of insurance varies widely based upon the type of insurance, the geography, the level of competition, and many other factors. The ability of insurers to make profits can also vary from year to year. Some of the major factors, among many, that affect the profitability of insurance companies and lines of insurance include:
- Insurance pricing. The pricing of insurance policies relative to the risk posed for policies is a major factor in the profitability of various lines of insurance. Pricing is influenced by a variety of factors, which include the availability of capital in a given insurance market, the amount of competition in each insurance market, and the skill of insurance companies in accurately underwriting and evaluating risks of loss.
- Insurance losses. While insurance companies make their best effort to price risk appropriately, there is a random component of risks that can cause losses, which vary based upon the type of insurance. When insurance companies experience unexpected losses, it can reduce profitability for insurers.
- Administrative expenses. The management of insurance companies, which includes management, financial, technology, and other expenses, is a factor in determining insurance profitability. More efficiently run insurance companies can deliver higher profitability to their shareholders.
- Selling expenses. Many insurance sales are made by insurance agents and brokers who earn commissions that are a percentage of the premiums written by that agent. These selling expenses reduce the profits of insurance companies.
- Taxes, licenses, and fees. Insurance companies are required to be licensed by the states in which they operate and are required to pay taxes and fees in the jurisdictions where they sell insurance. These taxes, licenses, and fees can vary by both line of insurance as well as by state.
- Investment gains and losses. When insurance companies receive premiums from their policyholders, they invest those premiums into financial assets that are intended to match the obligations of the insurer to pay losses. These financial assets usually generate investment profits and gains for insurance companies, although in some cases they can also generate losses.
Expert Perspective


Rob Hoyt
Moore Chair and Professor of Risk Management & Insurance
Terry College of Business, University of Georgia
What accounts for the differences in profitability among different types of property and casualty insurance?
Profitability in insurance comes from two main sources, underwriting returns and investment returns. The main driver of underwriting returns is the level of losses relative to premiums. For most property and casualty lines of insurance, premiums are set to generate a relatively modest underwriting return.
Investment returns in the insurance business stem from the fact that premiums are collected at the beginning of the coverage period while losses are realized over the coverage period and may not be fully paid out until multiple years after the end of the coverage period. So, the impact of investment returns is different across different lines of insurance.
In the language of insurance, some lines are “short-tailed,” losses are realized and paid relatively quickly, and other lines are “long-tailed,” losses “develop” over a relatively extended period. This is what is referred to as “loss development.” As a result, investment returns are a more important part of the profitability equation for long-tailed lines than for short-tailed lines because the insurer holds the funds for a longer period of time.
The differences in profitability across lines of insurance will be influenced by differences in loss trends (higher catastrophe losses affecting property insurance lines vs. higher litigation patterns impacting on liability insurance lines). On the other hand, improvements or declines in investment returns will have a bigger impact on long-tailed lines than on short-tailed lines.
Finally, like any business, some lines of insurance are more volatile than others so that on average, returns will be higher to compensate for that higher level of risk.
What are the major factors determining insurance profitability?
I covered the two critical ones in [the last question], but additionally, the ability to manage expenses effectively, like in most businesses, is critical to overall profitability in insurance. Digital strategies and the broader adoption of technology in underwriting and claims have been important in insurance to determining how profitable an insurer can be.
How do state insurance regulations, tort law, or judicial systems affect the profitability of insurers across states?
A great deal of academic research suggests that these are probably the most important determinants of differences in insurance prices, insurance availability, and the profitability of insurers across states. All three impact on losses, and as noted [before], losses are one of the key components of insurer profitability.
For example, in some of my own research, we showed that one of the most important reforms to tort law in reducing insurance costs was caps on non-economic damages. It is important to note that while a more stable and predictable legal and regulatory environment in a state will reduce costs to insurers, it will also cause insurers to more aggressively seek to do business in that state which leads to reduced premiums and more available coverage options for businesses and individuals.
Methodology
To determine the most and least profitable types of property & casualty insurance, AdvisorSmith examined data published by the National Association of Insurance Commissioners (NAIC) on profitability of various lines of insurance by state. We examined data published for each of the past five years, which covers the calendar years from 2014 through 2019.
Our analysis studied the average profitability of 19 lines of property and casualty insurance for direct insurance business as reported by the NAIC. Some of the insurance lines out of the 19 lines consisted of multiple lines of insurance that were also included separately in the study. For example, “Private Passenger Auto Total” includes both “Private Passenger Auto Liability” and “Private Passenger Auto Physical.” To determine the average profitability, we took the average return on net worth across the five-year period for each line. We then ranked the 19 lines by their average profitability over the study period.
We also examined the profitability of all insurance lines across all 50 states and the District of Columbia. To determine the profitability, we calculated the return on net worth across all lines for each of the states and then ranked the states based upon their average profitability over the five-year study period.
Sources
- National Association of Insurance Commissioners, Profitability by Line by State, 2014-2019