


Diversity in the U.S. labor force is one of the strengths of the American economy, fostering innovation and problem solving by providing a multitude of perspectives as companies create products and services to serve their customers. Many American companies seek to have workplace diversity so that their workforce can have a deeper perspective on the problems their customers face. In this analysis, AdvisorSmith examined gender and ethnoracial diversity in 72 of the highest-paying professions in the United States.
Using data from the Bureau of Labor Statistics, we identified 72 of the highest-paying professions in the country, which we defined as professions where the average annual wage was $80,000 or more. We then examined gender and ethnoracial diversity in each of these professions among men and women, and workers identifying as White, Black or African American, Asian, and Hispanic or Latino.

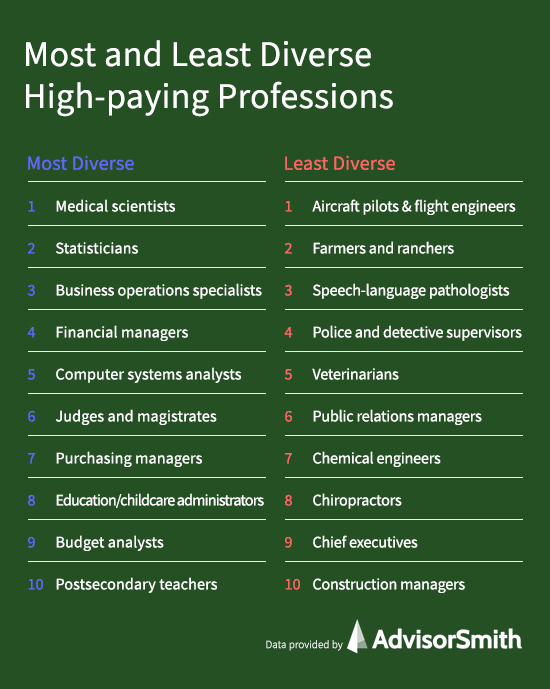
Our study ranked the top and bottom 20 high-paying occupations based upon their gender and ethnoracial diversity. The professions included in our study accounted for approximately 28 million workers in the U.S. Among highly-paid workers, the workforce was 36.6% female, 63.4% male, 79.1% White, 7.2% Black or African American, 11.4% Asian, and 8.7% Hispanic or Latino. The composition of the overall labor force including jobs at all pay levels was 47% female, 53% male, 77.7% White, 12.3% Black or African American, 6.5% Asian, and 17.6% Hispanic or Latino.
Most Diverse High Paying Professions
1. Medical Scientists
Medical scientists conduct research focused on improving human health, generally working in science labs or offices. Most medical scientists have doctorate degrees in biology or life sciences.
Employment: 170,000
Average Annual Salary: $97,650
Women (%): 51.8
White (%): 64.1
Black or African American (%): 7.3
Asian (%): 27.8
Hispanic or Latino (%): 8.8
2. Statisticians
Statisticians are responsible for analyzing numerical data to understand trends and patterns in business, government, and sciences.
Employment: 101,000
Average Annual Salary: $95,680
Women (%): 52.4
White (%): 69.6
Black or African American (%): 8.2
Asian (%): 21.1
Hispanic or Latino (%): 7.7
3. Business Operations Specialists
Business operations specialists perform a wide range of business functions such as business continuity planning, sustainability analysis, and other roles to help business operations function smoothly.
Employment: 269,000
Average Annual Salary: $80,220
Women (%): 57.7
White (%): 75.8
Black or African American (%): 10.3
Asian (%): 10.9
Hispanic or Latino (%): 10.5
| Rank | Profession | Total employed | Average Salary | Women (%) | White (%) | Black or African American (%) | Asian (%) | Hispanic or Latino (%) | Diversity Score |
|---|---|---|---|---|---|---|---|---|---|
| 1 | Medical scientists | 170 | $97,650 | 51.8 | 64.1 | 7.3 | 27.8 | 8.8 | 72.8 |
| 2 | Statisticians | 101 | $95,680 | 52.4 | 69.6 | 8.2 | 21.1 | 7.7 | 68.5 |
| 3 | Business operations specialists | 269 | $80,220 | 57.7 | 75.8 | 10.3 | 10.9 | 10.5 | 68.4 |
| 4 | Financial managers | 1,194 | $147,530 | 53.5 | 80.2 | 8.5 | 9.4 | 11.4 | 66.9 |
| 5 | Computer systems analysts | 663 | $96,160 | 40.1 | 67.8 | 9.7 | 20.3 | 8.3 | 64.3 |
| 6 | Judges, magistrates, and other judicial workers | 70 | $113,470 | 52.5 | 81.5 | 13.4 | 4.8 | 8.6 | 64.0 |
| 7 | Purchasing managers | 227 | $128,400 | 42.8 | 75.1 | 14.4 | 5.9 | 10.0 | 63.7 |
| 8 | Education and childcare administrators | 958 | $98,270 | 67.7 | 78.6 | 15.3 | 3.3 | 11.8 | 61.6 |
| 9 | Budget analysts | 51 | $80,300 | 60.4 | 64.6 | 19.3 | 12.2 | 3.6 | 60.7 |
| 10 | Postsecondary teachers | 1,386 | $90,830 | 47.4 | 75.3 | 7.0 | 15.1 | 8.3 | 60.7 |
| 11 | Medical and health services managers | 677 | $115,160 | 69.7 | 79.0 | 12.7 | 5.7 | 11.8 | 59.4 |
| 12 | Computer hardware engineers | 77 | $123,030 | 22.8 | 54.3 | 5.7 | 38.4 | 10.2 | 58.9 |
| 13 | Management analysts | 950 | $95,560 | 42.1 | 76.1 | 7.5 | 13.7 | 8.6 | 58.0 |
| 14 | Information security analysts | 125 | $104,210 | 17.1 | 74.6 | 16.6 | 7.6 | 12.9 | 56.9 |
| 15 | Chemists and materials scientists | 97 | $85,360 | 42.5 | 75.7 | 7.0 | 13.7 | 8.2 | 56.5 |
| 16 | Computer network architects | 106 | $115,110 | 9.2 | 76.1 | 13.1 | 10.3 | 14.1 | 56.1 |
| 17 | Physical scientists | 298 | $112,070 | 43.7 | 68.3 | 3.4 | 25.7 | 7.1 | 56.1 |
| 18 | Pharmacists | 341 | $125,510 | 60.4 | 64.5 | 10.5 | 22.0 | 2.7 | 56.1 |
| 19 | Administrative services and facilities managers | 184 | $106,550 | 42.0 | 83.9 | 10.5 | 3.2 | 10.9 | 55.6 |
| 20 | Biological scientists | 104 | $89,100 | 47.7 | 81.0 | 3.4 | 14.4 | 8.7 | 55.0 |
Least Diverse High Paying Professions
1. Aircraft pilots and flight engineers
Aircraft pilots and flight engineers are responsible for flying aircraft, helicopters, and other aerial vehicles to transport passengers and cargo.
Employment: 141,000
Average Annual Salary: $152,610
Women (%): 7.5
White (%): 93.7
Black or African American (%): 2.6
Asian (%): 3.4
Hispanic or Latino (%): 2.2
2. Farmers, ranchers, and other agricultural manager
Farmers, ranchers, and other agricultural managers are responsible for the management of farms that produce fruits and vegetables, livestock, and dairy products.
Employment: 962,000
Average Annual Salary: $80,360
Women (%): 24.5
White (%): 96.9
Black or African American (%): 0.9
Asian (%): 1.0
Hispanic or Latino (%): 5.7
3. Speech-language pathologists
Speech-language pathologists are professionals who assist adults and children with communication and swallowing disorders.
Employment: 180,000
Average Annual Salary: $82,000
Women (%): 95.8
White (%): 93.7
Black or African American (%): 3.9
Asian (%): 2.2
Hispanic or Latino (%): 6.7
| Rank | Profession | Total employed | Average Salary | Women (%) | White (%) | Black or African American (%) | Asian (%) | Hispanic or Latino (%) | Diversity Score |
|---|---|---|---|---|---|---|---|---|---|
| 1 | Aircraft pilots and flight engineers | 141 | $152,610 | 7.5 | 93.7 | 2.6 | 3.4 | 2.2 | 6.3 |
| 2 | Farmers, ranchers, and other agricultural managers | 962 | $80,360 | 24.5 | 96.6 | 0.9 | 1.0 | 5.7 | 13.9 |
| 3 | Speech-language pathologists | 180 | $82,000 | 95.8 | 93.7 | 3.9 | 2.2 | 6.7 | 17.2 |
| 4 | First-line supervisors of police and detectives | 83 | $94,950 | 9.9 | 89.2 | 7.6 | 0.4 | 5.6 | 18.2 |
| 5 | Veterinarians | 104 | $104,820 | 68.3 | 89.8 | - | 6.1 | 1.6 | 18.4 |
| 6 | Public relations and fundraising managers | 73 | $132,630 | 71.4 | 89.8 | 8.0 | 0.4 | 1.4 | 23.2 |
| 7 | Chemical engineers | 87 | $117,090 | 14.4 | 75.6 | 4.0 | 17.1 | 2.4 | 24.4 |
| 8 | Chiropractors | 61 | $85,010 | 28.0 | 86.1 | 2.8 | 5.3 | 6.4 | 25.2 |
| 9 | Chief executives | 1,602 | $193,850 | 27.6 | 88.8 | 4.1 | 5.8 | 6.2 | 27.3 |
| 10 | Construction managers | 994 | $105,000 | 10.0 | 90.9 | 3.5 | 2.5 | 13.9 | 30.8 |
| 11 | Architectural and engineering managers | 154 | $152,930 | 11.7 | 81.5 | 6.0 | 11.8 | 6.7 | 30.8 |
| 12 | Mechanical engineers | 351 | $93,540 | 6.6 | 80.4 | 5.1 | 11.6 | 8.4 | 32.6 |
| 13 | Lawyers | 1,240 | $145,300 | 36.4 | 86.6 | 5.9 | 5.7 | 5.8 | 33.8 |
| 14 | Civil engineers | 475 | $94,360 | 13.9 | 80.3 | 5.9 | 12.2 | 8.4 | 35.3 |
| 15 | Nurse practitioners | 225 | $111,840 | 87.8 | 76.6 | 12.2 | 9.9 | 2.6 | 35.4 |
| 16 | Industrial engineers, including health and safety | 245 | $92,830 | 24.3 | 80.7 | 7.9 | 9.4 | 5.9 | 35.5 |
| 17 | Industrial production managers | 274 | $115,110 | 22.4 | 87.2 | 5.4 | 5.5 | 10.9 | 36.2 |
| 18 | Aerospace engineers | 134 | $119,220 | 13.8 | 78.0 | 6.5 | 14.5 | 7.3 | 36.6 |
| 19 | Psychologists | 234 | $88,770 | 79.7 | 89.9 | 5.8 | 3.5 | 10.3 | 37.3 |
| 20 | Architects | 208 | $87,060 | 24.5 | 82.6 | 6.3 | 8.8 | 8.5 | 37.6 |
Methodology
In this study, AdvisorSmith examined professions with high average salaries for gender and ethnoracial diversity. We used data from the U.S. Bureau of Labor Statistics on average nationwide wages for over 800 professions. Additionally, we used a second data set from the Bureau of Labor Statistics that provided the gender and ethnoracial composition of employees working in over 500 professions. We used this data to identify high-paying professions and also to calculate a diversity score for each high-paying profession that takes into account gender and ethnoracial diversity. We then ranked the top and bottom 20 professions by their diversity score.
We defined high-paying professions as those in which the average annual wage was at least $80,000. We chose this cutoff because it is approximately 50% higher than the national average wage of $53,490. We identified 72 professions which met this criteria.
Next, we conducted an analysis of gender and ethnoracial diversity within each profession. To measure gender diversity, we measured the extent to which there was a balance between workers identifying as men and women within each profession. We also measured the diversity of four ethnoracial groups: workers identifying as White, Black or African American, Asian, and Hispanic or Latino. We used these diversity measures to create a composite diversity score for each profession.
Sources
- U.S. Bureau of Labor Statistics, Occupational Employment Statistics, May 2019 National Occupational Employment and Wage Estimates
- U.S. Bureau of Labor Statistics, Labor Force Statistics from the Current Population Survey, Employed persons by detailed occupation, sex, race, and Hispanic or Latino ethnicity