


Housing affordability is an important issue for renters in the United States, and there is wide variability in the affordability of housing throughout the country. In this study, AdvisorSmith examined the least and most affordable counties for renters using data from the U.S. Census Bureau and the U.S. Department of Housing and Urban Development. We ranked the counties by affordability and also segmented our analysis by county population size.
To determine housing affordability, we used the median household income in each county. Our study also used the average household size to create a weighted median rent that was used to calculate the percentage of household income that is spent on rent. We then ranked the counties by the ratio of rent-to-income in 827 U.S. counties.
Besides simply considering the cost of rent, our housing affordability calculation also takes into account the ability of households to earn income that households can use to pay their rent. For the most affordable places, our study highlights counties where it is possible to earn a high salary yet also benefit from low rental costs. Additionally, for the least affordable places, the use of median income shows where households spend a high proportion of their income on rent.
Among the counties, the rent-to-income ratio ranged from as low as 10.9% of household income in Oldham County, KY up to as high as 64.5% of income in the Bronx, NY. The most affordable midsize and large counties tended to be affluent suburbs of large cities in Midwestern states and Pennsylvania. Many of the least affordable small and midsize counties were areas in California, New York City, South Florida, Boston, and Hawaii.
Most Affordable Places for Renters in America by County Size
AdvisorSmith’s study segmented the most affordable counties for renters into small (population under 150,000), midsize (population 150,000 to 500,000), and large counties (population above 500,000) in order to compare places with similar characteristics. Along with the counties themselves, we also list a significant city in each county, and the county’s metro area, if applicable.


Most Affordable Counties For Renters (Small Counties)
| Rank | County Name | Significant City | Metro Area |
|---|---|---|---|
| 1 | Oldham County, KY | La Grange | Louisville |
| 2 | Cole County, MO | Jefferson City | Jefferson City |
| 3 | Geauga County, OH | Chardon | Cleveland |
| 4 | Dallas County, IA | Waukee | Des Moines |
| 5 | Ozaukee County, WI | Mequon | Milwaukee |
| 6 | Jackson County, GA | Jefferson | Atlanta |
| 7 | Hancock County, OH | Findlay | *** |
| 8 | Burleigh County, ND | Bismarck | Bismarck |
| 9 | Wood County, OH | Bowling Green | Toledo |
| 10 | Manitowoc County, WI | Manitowoc | *** |
Most Affordable Counties For Renters (Midsize Counties)
| Rank | County Name | Significant City | Metro Area |
|---|---|---|---|
| 1 | Hamilton County, IN | Carmel | Indianapolis |
| 2 | Warren County, OH | Mason | Cincinnati |
| 3 | Waukesha County, WI | Waukesha | Milwaukee |
| 4 | Delaware County, OH | Delaware | Columbus |
| 5 | Greene County, OH | Beavercreek | Dayton |
| 6 | Williamson County, TN | Franklin | Nashville |
| 7 | St. Charles County, MO | O'Fallon | St. Louis |
| 8 | Medina County, OH | Brunswick | Cleveland |
| 9 | Linn County, IA | Cedar Rapids | Cedar Rapids |
| 10 | Sangamon County, IL | Springfield | Springfield |
Most Affordable Counties For Renters (Large Counties)
| Rank | County Name | Significant City | Metro Area |
|---|---|---|---|
| 1 | Johnson County, KS | Overland Park | Kansas City |
| 2 | Oakland County, MI | Troy | Detroit |
| 3 | Chester County, PA | West Chester | Philadelphia |
| 4 | St. Louis County, MO | Florissant | St. Louis |
| 5 | Summit County, OH | Akron | Akron |
| 6 | Montgomery County, PA | Lower Merion Township | Philadelphia |
| 7 | Montgomery County, OH | Dayton | Dayton |
| 8 | Hamilton County, OH | Cincinnati | Cincinnati |
| 9 | Allegheny County, PA | Pittsburgh | Pittsburgh |
| 10 | Fort Bend County, TX | Sugar Land | Houston |
Top 3 Most Affordable Counties for Renters
1. Oldham County, KY
As a suburb of the Louisville metropolitan area, Oldham County is located to the northeast of the city of Louisville along the Ohio River. Oldham County is a small county with approximately 65,000 inhabitants, and the largest city in the county is La Grange. The county is the wealthiest county in the state of Kentucky on a per capita basis.
Oldham County has a median household income of $102,033, and an average of 2.97 people per household. Renters in the county pay a weighted median rent of just $923.93, which means that households in the county spend just 10.9% of their income on rent, making Oldham County the most affordable county in the nation for renters.
2. Hamilton County, IN
Hamilton County, Indiana is a part of the Indianapolis metropolitan area, located just north of the city of Indianapolis. Historically, the county was an agricultural area, but in recent years the county has trended towards suburban development. With a population of approximately 309,000, Hamilton County is a midsize county whose largest city is Carmel. The city of Carmel is an affluent suburb of Indianapolis with a well-educated, high-earning population.
The median household income in Hamilton County is $100,209, with the average household having 2.67 members. The weighted median rent in the county is $948.93, and the rent-to-income ratio is only 11.4%.
3. Cole County, MO
Located in the center of the state of Missouri roughly halfway between St. Louis and Kansas City is Cole County, Missouri. The county’s largest city is Jefferson City, MO, which is just south of the Missouri River. With a population of roughly 76,000, Cole County is a small county, and the third most affordable in the nation. Jefferson City is named after President Thomas Jefferson and was chosen as the capital of the state of Missouri in 1821. Additionally, Jefferson City plays host to the historically black university Lincoln University.
In Cole County, the median household income is $63,568, with an average household size of 2.44 people per household. The weighted median rent for the county is $622.32, and residents of the county spend just 11.7% of their income on rent.
Least Affordable Places for Renters in America by County Size
Our study also ranked the least affordable counties in the country, breaking them down by county size.
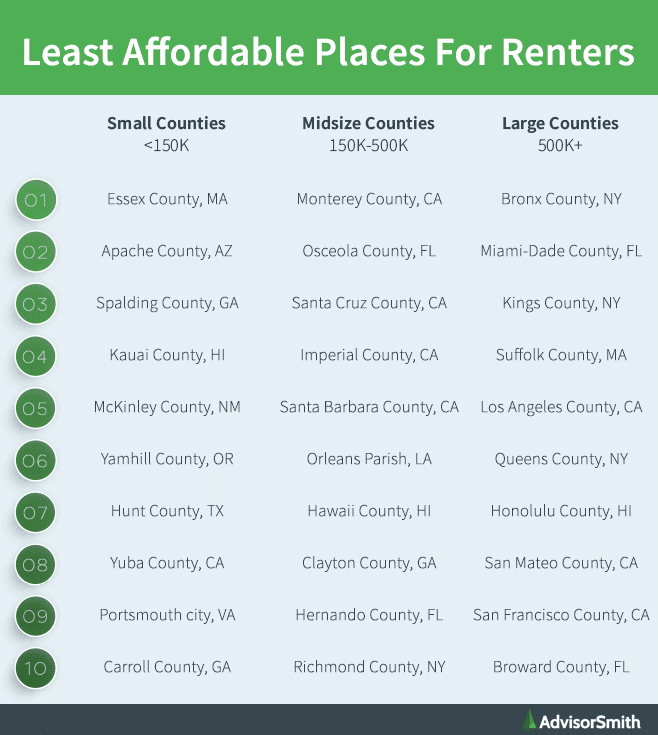
Least Affordable Counties For Renters (Small Counties)
| Rank | County Name | Significant City | Metro Area |
|---|---|---|---|
| 1 | Essex County, MA | Lynn | Boston |
| 2 | Apache County, AZ | Eager | *** |
| 3 | Spalding County, GA | Griffin | Atlanta |
| 4 | Kauai County, HI | Kapa'a | *** |
| 5 | McKinley County, NM | Gallup | *** |
| 6 | Yamhill County, OR | McMinnville | Portland |
| 7 | Hunt County, TX | Greenville | Dallas |
| 8 | Yuba County, CA | Marysville | Sacramento |
| 9 | Portsmouth city, VA | Portsmouth | Norfolk |
| 10 | Carroll County, GA | Carrollton | Atlanta |
Least Affordable Counties For Renters (Midsize Counties)
| Rank | County Name | Significant City | Metro Area |
|---|---|---|---|
| 1 | Monterey County, CA | Salinas | Salinas |
| 2 | Osceola County, FL | Kissimmee | Orlando |
| 3 | Santa Cruz County, CA | Santa Cruz | Santa Cruz |
| 4 | Imperial County, CA | El Centro | El Centro |
| 5 | Santa Barbara County, CA | Santa Barbara | Santa Barbara |
| 6 | Orleans Parish, LA | New Orleans | New Orleans |
| 7 | Hawaii County, HI | Hilo | *** |
| 8 | Clayton County, GA | Forest Park | Atlanta |
| 9 | Hernando County, FL | Spring Hill | Tampa |
| 10 | Richmond County, NY | Staten Island | New York City |
Least Affordable Counties For Renters (Large Counties)
| Rank | County Name | Significant City | Metro Area |
|---|---|---|---|
| 1 | Bronx County, NY | The Bronx | New York City |
| 2 | Miami-Dade County, FL | Miami | Miami |
| 3 | Kings County, NY | Brooklyn | New York City |
| 4 | Suffolk County, MA | Boston | Boston |
| 5 | Los Angeles County, CA | Los Angeles | Los Angeles |
| 6 | Queens County, NY | Queens | New York City |
| 7 | Honolulu County, HI | Honolulu | Honolulu |
| 8 | San Mateo County, CA | Daly City, Redwood City | San Francisco |
| 9 | San Francisco County, CA | San Francisco | San Francisco |
| 10 | Broward County, FL | Fort Lauderdale | Fort Lauderdale |
Top 3 Least Affordable Counties for Renters
1. Bronx County, NY
The New York City borough of The Bronx, which is coterminous with Bronx County, New York, is the least affordable county in the country for renters. With a population of almost 1.5 million, the Bronx is the only New York City borough that is mostly located on the mainland United States, just north of the borough of Manhattan.
The Bronx was historically important due to its location between Manhattan and New England. Originally part of Westchester County, the Bronx was consolidated into the City of New York in the late 1800s. The Bronx is also host to the New York Yankees, with Yankee Stadium being located in the borough.
As the least affordable county in the country, residents of the Bronx earn a median household income of $38,467, and have an average of 2.74 occupants per household. Meanwhile, residents of the county pay a weighted median rent of $2,066.66, with a country-leading rent burden of 64.5% of median income.
2. Miami-Dade County, FL
Miami-Dade County, Florida is located in the southeast portion of the state of Florida and contains the cities of Miami, Miami Beach, and Hialeah. With a population of over 2.7 million people, Miami-Dade County is the most populous county in Florida.
The city of Miami is the largest city in Miami-Dade County, with a series of land booms starting in the 1920s and continuing into the present. Today, the Miami metropolitan area is the largest area by population in the southeastern U.S. Miami is a global center for music, fashion, and finance, with many multinational companies locating their Latin American headquarters in the city.
In terms of housing affordability, Miami-Dade County residents have a median household income of $52,205, with an average household size of 3.03. The weighted median rent is $1764.40 per month, with residents shouldering a rent burden of 40.6% of income.
3. Kings County, NY
Kings County, New York is coterminous with the New York City borough Brooklyn. The borough has the highest population of the boroughs in New York City, with a population of roughly 2.5 million, which would rank 4th in population nationwide if it were a city (after New York City, Los Angeles, and Chicago). Brooklyn is located on the far western end of Long Island and is connected to Manhattan by various bridges and tunnels.
Brooklyn has a long history that dates back to Dutch settlements in the mid 1600s, with an independent city being established in the early 1800s. Brooklyn was an independent city until it was consolidated into the City of New York in 1898. Today, Brooklyn continues to play host to numerous ethnic and immigrant neighborhoods. Brooklyn is also known worldwide as a cultural center for music, hub of independent manufacturing, and the home to the NBA team, the Brooklyn Nets.
Kings County has a median household income of $61,220, and the average household has 2.62 inhabitants. The weighted median rent in Kings County is $2035.58 per month, which means that residents of the county spend 40% of their income on rent.
Top 50 Most Affordable Counties for Renters
The most affordable counties for renters in the country are listed below. The table also includes county-level data on median income, average number of household occupants, weighted monthly rent, and the percentage of income spent on rent, as well as county size by population. To qualify for the top 50 most affordable counties, a county’s residents would have to spend less than 14.5% of their income on rent.
| Rank | County Name | County Size | Median Income | Average Household Size | Weighted Monthly Rent | Rent-to-Income Ratio |
|---|---|---|---|---|---|---|
| 1 | Oldham County, KY | Small | $102,033 | 2.97 | $923.93 | 10.9% |
| 2 | Hamilton County, IN | Midsize | $100,209 | 2.67 | $948.93 | 11.4% |
| 3 | Cole County, MO | Small | $63,568 | 2.44 | $622.32 | 11.7% |
| 4 | Warren County, OH | Midsize | $86,473 | 2.68 | $859.64 | 11.9% |
| 5 | Geauga County, OH | Small | $82,784 | 2.63 | $847.10 | 12.3% |
| 6 | Waukesha County, WI | Midsize | $86,968 | 2.51 | $891.70 | 12.3% |
| 7 | Delaware County, OH | Midsize | $99,881 | 2.87 | $1,035.44 | 12.4% |
| 8 | Dallas County, IA | Small | $83,990 | 2.52 | $871.12 | 12.4% |
| 9 | Greene County, OH | Midsize | $67,680 | 2.4 | $712.20 | 12.6% |
| 10 | Ozaukee County, WI | Small | $81,104 | 2.4 | $873.00 | 12.9% |
| 11 | Williamson County, TN | Midsize | $110,700 | 2.87 | $1,198.04 | 13.0% |
| 12 | St. Charles County, MO | Midsize | $81,663 | 2.61 | $885.59 | 13.0% |
| 13 | Medina County, OH | Midsize | $75,786 | 2.52 | $828.40 | 13.1% |
| 14 | Jackson County, GA | Small | $73,150 | 2.94 | $802.30 | 13.2% |
| 15 | Linn County, IA | Midsize | $64,103 | 2.41 | $706.18 | 13.2% |
| 16 | Hancock County, OH | Small | $60,788 | 2.34 | $677.92 | 13.4% |
| 17 | Burleigh County, ND | Small | $71,172 | 2.26 | $795.56 | 13.4% |
| 18 | Johnson County, KS | Large | $86,746 | 2.56 | $971.12 | 13.4% |
| 19 | Wood County, OH | Small | $63,695 | 2.45 | $713.70 | 13.4% |
| 20 | Manitowoc County, WI | Small | $54,393 | 2.21 | $611.22 | 13.5% |
| 21 | Boone County, KY | Small | $77,429 | 2.74 | $873.02 | 13.5% |
| 22 | Marathon County, WI | Small | $62,890 | 2.38 | $723.58 | 13.8% |
| 23 | Sangamon County, IL | Midsize | $61,997 | 2.3 | $713.90 | 13.8% |
| 24 | Roanoke County, VA | Small | $68,595 | 2.41 | $790.08 | 13.8% |
| 25 | Ascension Parish, LA | Small | $79,495 | 2.74 | $920.30 | 13.9% |
| 26 | Oakland County, MI | Large | $80,193 | 2.48 | $931.92 | 13.9% |
| 27 | Sheboygan County, WI | Small | $60,896 | 2.43 | $709.62 | 14.0% |
| 28 | Howard County, IN | Small | $55,868 | 2.31 | $653.15 | 14.0% |
| 29 | Boone County, IN | Small | $81,145 | 2.67 | $948.93 | 14.0% |
| 30 | Shiawassee County, MI | Small | $54,456 | 2.39 | $637.20 | 14.0% |
| 31 | Washington County, RI | Small | $89,847 | 2.51 | $1,054.39 | 14.1% |
| 32 | St. Francois County, MO | Small | $46,796 | 2.32 | $549.56 | 14.1% |
| 33 | Outagamie County, WI | Midsize | $64,759 | 2.47 | $760.53 | 14.1% |
| 34 | Wood County, WI | Small | $55,273 | 2.24 | $650.08 | 14.1% |
| 35 | Forsyth County, GA | Midsize | $104,687 | 2.9 | $1,232.80 | 14.1% |
| 36 | Tazewell County, IL | Small | $60,857 | 2.4 | $718.80 | 14.2% |
| 37 | Benton County, AR | Midsize | $67,164 | 2.69 | $794.03 | 14.2% |
| 38 | Dubuque County, IA | Small | $60,225 | 2.41 | $712.00 | 14.2% |
| 39 | Lincoln County, NC | Small | $63,782 | 2.42 | $754.58 | 14.2% |
| 40 | Wayne County, OH | Small | $59,111 | 2.54 | $700.58 | 14.2% |
| 41 | Livingston County, MI | Midsize | $82,884 | 2.61 | $982.59 | 14.2% |
| 42 | McLean County, IL | Midsize | $66,256 | 2.49 | $788.08 | 14.3% |
| 43 | Hanover County, VA | Small | $91,309 | 2.64 | $1,086.32 | 14.3% |
| 44 | Hendricks County, IN | Midsize | $80,582 | 2.73 | $959.67 | 14.3% |
| 45 | Washington County, WI | Small | $73,435 | 2.43 | $878.10 | 14.3% |
| 46 | Madison County, AL | Midsize | $63,111 | 2.34 | $755.88 | 14.4% |
| 47 | Surry County, NC | Small | $48,398 | 2.43 | $581.51 | 14.4% |
| 48 | Saratoga County, NY | Midsize | $83,765 | 2.4 | $1,007.60 | 14.4% |
| 49 | Dodge County, WI | Small | $63,077 | 2.38 | $758.86 | 14.4% |
| 50 | Platte County, MO | Small | $80,468 | 2.55 | $969.35 | 14.5% |
Top 50 Least Affordable Counties for Renters
Below, we list the top 50 least affordable United States counties for renters, including information about the median income, average household size, weighted monthly rent, and the rent-to-income ratio. Counties with a rent-to-income ratio of 28.2% or higher were among the top 50 least affordable counties.
| Rank | County Name | County Size | Median Income | Average Household Size | Weighted Monthly Rent | Rent-to-Income Ratio |
|---|---|---|---|---|---|---|
| 1 | Bronx County, NY | Large | $38,467 | 2.74 | $2,066.66 | 64.5% |
| 2 | Miami-Dade County, FL | Large | $52,205 | 3.03 | $1,764.40 | 40.6% |
| 3 | Kings County, NY | Large | $61,220 | 2.62 | $2,035.58 | 39.9% |
| 4 | Monterey County, CA | Midsize | $70,681 | 3.31 | $2,231.84 | 37.9% |
| 5 | Suffolk County, MA | Large | $69,985 | 2.41 | $2,186.35 | 37.5% |
| 6 | Osceola County, FL | Midsize | $50,546 | 3.57 | $1,578.69 | 37.5% |
| 7 | Los Angeles County, CA | Large | $68,093 | 2.99 | $2,108.25 | 37.2% |
| 8 | Queens County, NY | Large | $69,320 | 2.86 | $2,097.74 | 36.3% |
| 9 | Essex County, MA | Small | $76,604 | 2.62 | $2,277.70 | 35.7% |
| 10 | Santa Cruz County, CA | Midsize | $86,941 | 2.75 | $2,540.25 | 35.1% |
| 11 | Imperial County, CA | Midsize | $48,984 | 4.11 | $1,429.00 | 35.0% |
| 12 | Honolulu County, HI | Large | $84,423 | 3.06 | $2,376.50 | 33.8% |
| 13 | Santa Barbara County, CA | Midsize | $77,472 | 2.92 | $2,158.96 | 33.4% |
| 14 | San Mateo County, CA | Large | $124,425 | 2.93 | $3,431.92 | 33.1% |
| 15 | Apache County, AZ | Small | $30,207 | 3.22 | $832.28 | 33.1% |
| 16 | San Francisco County, CA | Large | $112,376 | 2.38 | $3,077.72 | 32.9% |
| 17 | Spalding County, GA | Small | $42,920 | 2.52 | $1,175.04 | 32.9% |
| 18 | Broward County, FL | Large | $57,278 | 2.78 | $1,561.54 | 32.7% |
| 19 | Orleans Parish, LA | Midsize | $38,423 | 2.41 | $1,039.21 | 32.5% |
| 20 | Hawaii County, HI | Midsize | $57,571 | 2.77 | $1,552.92 | 32.4% |
| 21 | Kauai County, HI | Small | $80,921 | 3.14 | $2,176.90 | 32.3% |
| 22 | Orange County, CA | Large | $89,759 | 3.02 | $2,413.06 | 32.3% |
| 23 | Clayton County, GA | Midsize | $46,646 | 2.95 | $1,240.40 | 31.9% |
| 24 | San Diego County, CA | Large | $79,079 | 2.87 | $2,096.13 | 31.8% |
| 25 | Philadelphia County, PA | Large | $46,116 | 2.52 | $1,210.60 | 31.5% |
| 26 | Baltimore city, MD | Large | $51,000 | 2.44 | $1,323.92 | 31.2% |
| 27 | Ventura County, CA | Large | $84,566 | 3.08 | $2,173.48 | 30.8% |
| 28 | Hernando County, FL | Midsize | $45,977 | 2.48 | $1,166.16 | 30.4% |
| 29 | Richmond County, NY | Midsize | $82,166 | 2.8 | $2,082.20 | 30.4% |
| 30 | Rockland County, NY | Midsize | $89,812 | 3.21 | $2,253.70 | 30.1% |
| 31 | McKinley County, NM | Small | $34,080 | 3.34 | $853.10 | 30.0% |
| 32 | Yamhill County, OR | Small | $60,893 | 2.73 | $1,518.41 | 29.9% |
| 33 | Hunt County, TX | Small | $55,248 | 2.74 | $1,373.34 | 29.8% |
| 34 | San Bernardino County, CA | Large | $63,857 | 3.33 | $1,572.53 | 29.6% |
| 35 | Santa Clara County, CA | Large | $126,606 | 2.95 | $3,109.95 | 29.5% |
| 36 | Palm Beach County, FL | Large | $61,691 | 2.65 | $1,514.30 | 29.5% |
| 37 | Marin County, CA | Midsize | $126,373 | 2.4 | $3,090.60 | 29.3% |
| 38 | Yuba County, CA | Small | $46,574 | 2.93 | $1,134.94 | 29.2% |
| 39 | Snohomish County, WA | Large | $87,440 | 2.68 | $2,120.44 | 29.1% |
| 40 | Madera County, CA | Midsize | $56,305 | 3.35 | $1,363.90 | 29.1% |
| 41 | Adams County, CO | Midsize | $70,743 | 3.02 | $1,712.96 | 29.1% |
| 42 | Lake County, FL | Midsize | $52,096 | 2.59 | $1,260.23 | 29.0% |
| 43 | Maui County, HI | Midsize | $82,885 | 3.11 | $1,993.78 | 28.9% |
| 44 | Portsmouth city, VA | Small | $47,919 | 2.62 | $1,150.04 | 28.8% |
| 45 | Cumberland County, NJ | Midsize | $52,795 | 2.76 | $1,264.44 | 28.7% |
| 46 | Cameron County, TX | Midsize | $38,378 | 3.37 | $915.90 | 28.6% |
| 47 | Contra Costa County, CA | Large | $101,618 | 2.88 | $2,424.64 | 28.6% |
| 48 | Essex County, NJ | Large | $63,368 | 2.68 | $1,506.80 | 28.5% |
| 49 | Hidalgo County, TX | Large | $39,165 | 3.61 | $927.86 | 28.4% |
| 50 | Carroll County, GA | Small | $51,545 | 2.78 | $1,214.56 | 28.3% |
Methodology
This study examined data from the U.S. Department of Housing and Urban Development Office of Policy Development and Research 50th Percentile Rent Estimates, which provides an estimate of the median rent cost for studios, 1-, 2-, 3-, and 4-bedroom housing units in counties across the country. We also used data from the U.S. Census Bureau American Community Survey which estimates the median household income and average household size for each of 827 counties. The counties considered in this study had a minimum population of 30,000 people.
We used the average household size to determine a weighted rent cost for each of the counties based upon a ratio of bedrooms to household occupants. Our study compared the ratio of weighted annual rent to the median income in each county and ranked the counties to find the most and least affordable counties in the country. Additionally, we sorted the counties into small, midsize, and large counties based upon population and ranked the least and most affordable counties by county size.
Sources
[1] US HUD 50th Percentile Rent Estimates
[2] US Census Bureau American Community Survey