


This study examined data at the metropolitan statistical area level for 592 cities. To determine the affordability of home purchases, we used average home price data for each city for homes with one to five bedrooms. We used census data to determine the distribution of households in homes of different sizes for each city and combined this data with the home price data to create a weighted average housing price for each city.
Additionally, our study considered the purchasing power available to households as measured by median household income. This factor for each city provides insight into the ability of home buyers to earn income that will allow them to afford their homes. Our study calculated the price-to-income ratio, which is the average cost of a home as a multiple of the median household income in a city.
The price-to-income ratios in this study ranged from as low as 1.2 in the nation’s most affordable city, Flint, Michigan, up to as high as 16.7 in Palo Alto, California, the nation’s most expensive city. Nationwide, the average price-to-income ratio was 5.0. The top five least affordable cities were all in California, with Palo Alto, Newport Beach, Santa Monica, Santa Barbara, and Berkeley leading the way. The most affordable homes were mainly found in small and midsize midwestern cities, with a sprinkling of southern cities as well.
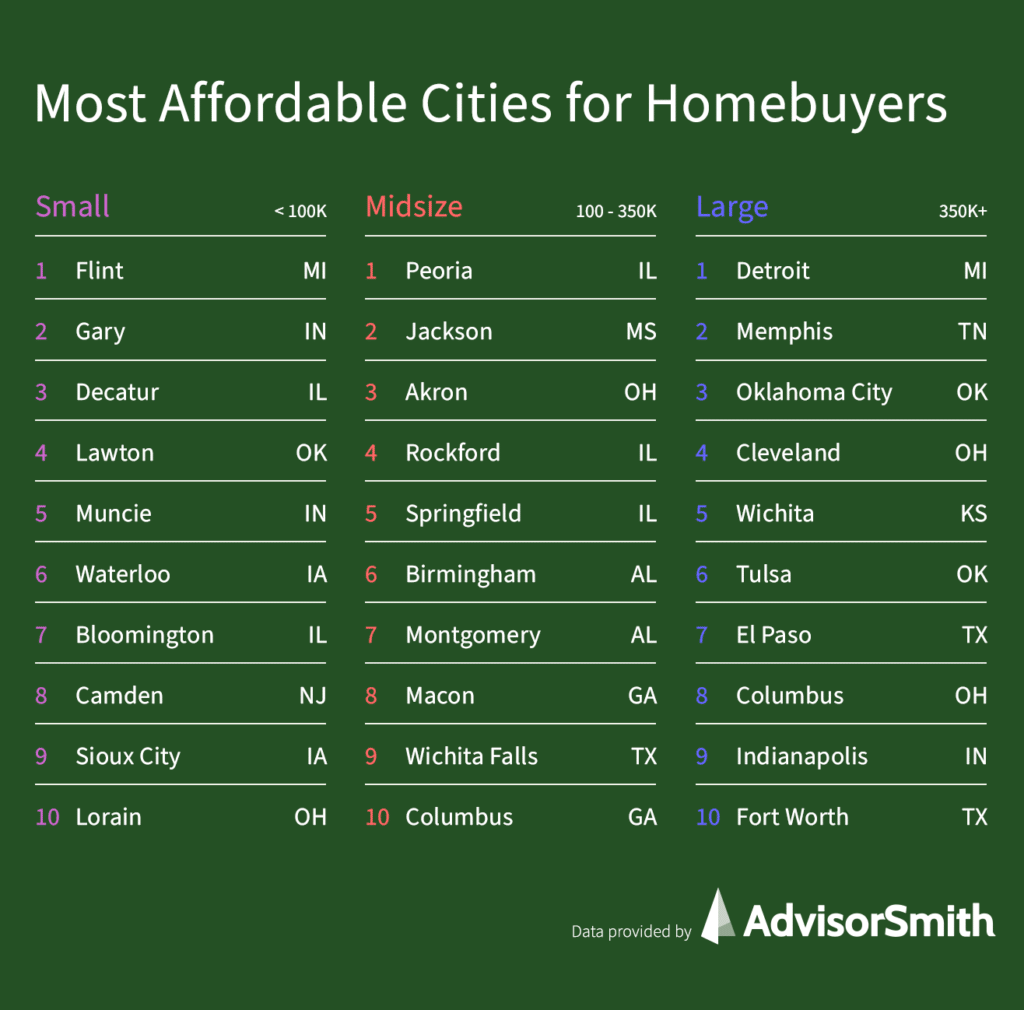
Most Affordable Cities for Homebuyers by City Size
AdvisorSmith examined the most affordable cities in the country for homebuyers segmented by city size. We segmented the cities into small (population less than 100,000), midsize (population 100,000 to 350,000), and large (population above 350,000) cities to provide a comparison of cities with more similar characteristics.

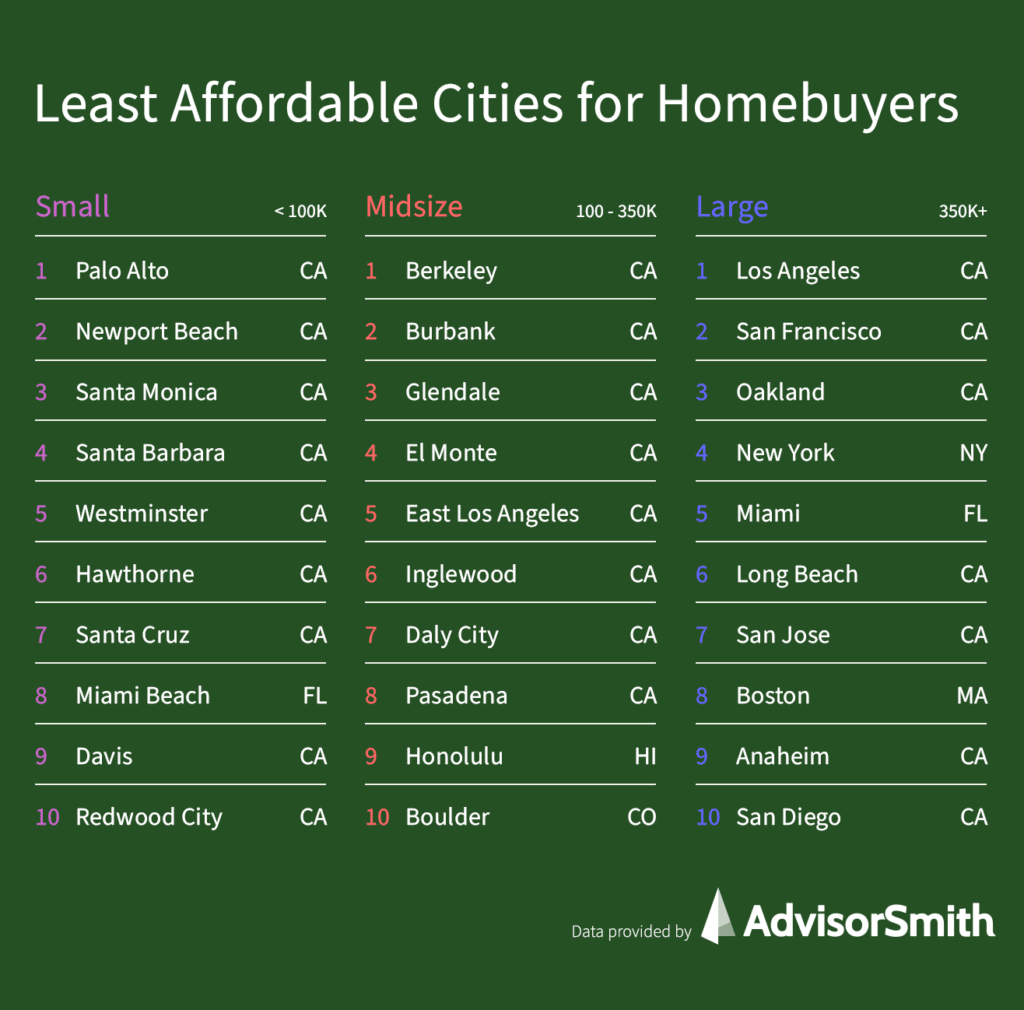
Least Affordable Cities for Homebuyers by City Size
In addition to the most affordable cities, we also found the least affordable cities in the country by city size.
Top 50 Most Affordable Cities for Homebuyers
Ranked below are the 50 most affordable cities for homebuyers, along with data on each city’s weighted average home price, median household income, and the price-to-income ratio. To qualify for the top 50 most affordable cities for homebuyers, the price-to-income ratio for homes was 2.8 or less, meaning that the average house costs 2.8 times the median household income or less in the city.
The vast majority of the most affordable cities were small and midsize cities, while only four large cities made the top 50: Detroit, Michigan (#9); Memphis, TN (#36); Oklahoma City, OK (#46); and Cleveland, OH (#48);. Over 60% of the most affordable cities were located in the Midwest.
| Rank | City | City Size | Weighted Home Price | Median Household Income | Price-to-Income Ratio |
|---|---|---|---|---|---|
| 1 | Flint, MI | S | $37,145 | $32,236 | 1.2 |
| 2 | Gary, IN | S | $51,032 | $31,341 | 1.6 |
| 3 | Decatur, IL | S | $72,616 | $41,440 | 1.8 |
| 4 | Peoria, IL | M | $93,935 | $53,360 | 1.8 |
| 5 | Lawton, OK | S | $86,597 | $46,886 | 1.8 |
| 6 | Jackson, MS | M | $76,018 | $38,972 | 2.0 |
| 7 | Akron, OH | M | $85,565 | $41,013 | 2.1 |
| 8 | Rockford, IL | M | $98,730 | $46,803 | 2.1 |
| 9 | Detroit, MI | L | $72,579 | $33,965 | 2.1 |
| 10 | Muncie, IN | S | $82,573 | $37,109 | 2.2 |
| 11 | Springfield, IL | M | $121,692 | $54,484 | 2.2 |
| 12 | Waterloo, IA | S | $115,983 | $51,847 | 2.2 |
| 13 | Birmingham, AL | M | $82,815 | $36,753 | 2.3 |
| 14 | Montgomery, AL | M | $115,129 | $51,074 | 2.3 |
| 15 | Macon, GA | M | $97,212 | $42,140 | 2.3 |
| 16 | Wichita Falls, TX | M | $115,240 | $48,861 | 2.4 |
| 17 | Bloomington, IL | S | $160,658 | $67,874 | 2.4 |
| 18 | Camden, NJ | S | $78,824 | $33,120 | 2.4 |
| 19 | Columbus, GA | M | $111,917 | $46,934 | 2.4 |
| 20 | League City, TX | M | $277,245 | $115,650 | 2.4 |
| 21 | Shreveport, LA | M | $108,548 | $45,013 | 2.4 |
| 22 | Dayton, OH | M | $81,050 | $33,116 | 2.4 |
| 23 | Topeka, KS | M | $124,744 | $50,761 | 2.5 |
| 24 | Sioux City, IA | S | $133,374 | $53,424 | 2.5 |
| 25 | Davenport, IA | M | $145,481 | $57,374 | 2.5 |
| 26 | Lorain, OH | S | $91,837 | $36,162 | 2.5 |
| 27 | Albany, GA | S | $80,148 | $31,397 | 2.6 |
| 28 | Victoria, TX | S | $143,690 | $55,968 | 2.6 |
| 29 | Broken Arrow, OK | M | $192,120 | $74,290 | 2.6 |
| 30 | Joliet, IL | M | $184,922 | $71,284 | 2.6 |
| 31 | Bolingbrook, IL | S | $245,034 | $94,198 | 2.6 |
| 32 | Waukegan, IL | S | $140,746 | $54,030 | 2.6 |
| 33 | St. Joseph, MO | S | $114,183 | $43,614 | 2.6 |
| 34 | Sugar Land, TX | M | $334,283 | $127,598 | 2.6 |
| 35 | Warner Robins, GA | S | $136,967 | $51,289 | 2.7 |
| 36 | Memphis, TN | L | $117,132 | $43,794 | 2.7 |
| 37 | Parma, OH | S | $154,259 | $57,376 | 2.7 |
| 38 | Mission, TX | S | $147,449 | $54,793 | 2.7 |
| 39 | Scranton, PA | S | $111,305 | $41,169 | 2.7 |
| 40 | Oshkosh, WI | S | $148,558 | $54,925 | 2.7 |
| 41 | Ankeny, IA | S | $258,071 | $94,862 | 2.7 |
| 42 | Pearland, TX | M | $290,652 | $106,757 | 2.7 |
| 43 | Schaumburg, IL | S | $237,312 | $87,156 | 2.7 |
| 44 | Westland, MI | S | $148,112 | $54,303 | 2.7 |
| 45 | Hammond, IN | S | $132,060 | $48,333 | 2.7 |
| 46 | Oklahoma City, OK | L | $152,006 | $55,492 | 2.7 |
| 47 | Noblesville, IN | S | $274,272 | $100,051 | 2.7 |
| 48 | Cleveland, OH | L | $88,059 | $32,053 | 2.7 |
| 49 | Lee's Summit, MO | S | $294,719 | $106,912 | 2.8 |
| 50 | Augusta, GA | M | $124,985 | $44,914 | 2.8 |
Top 50 Least Affordable Cities for Homebuyers
In the table below, our study ranks the top 50 least affordable cities for homebuyers in the United States. The data below includes each city’s weighted average home price, the median household income, as well as the price-to-income ratio. Cities that had a price-to-income ratio above 8.3 were included in the top 50 least affordable cities. This ratio indicates that the average house costs 8.3 times the median household income in the city.
Over 80% of the top 50 most unaffordable cities in the nation were located in California, and the state also dominated the top ten, taking all top ten positions. Palo Alto, California was the nation’s most unaffordable city, with a price-to-income ratio of 16.7, and other major cities in California were also among the most unaffordable, including Los Angeles (#11), and San Francisco (#15).
| Rank | City | City Size | Weighted Home Price | Median Household Income | Price-to-Income Ratio |
|---|---|---|---|---|---|
| 1 | Palo Alto, CA | S | $2,672,011 | $160,360 | 16.7 |
| 2 | Newport Beach, CA | S | $2,094,913 | $128,294 | 16.3 |
| 3 | Santa Monica, CA | S | $1,427,568 | $92,490 | 15.4 |
| 4 | Santa Barbara, CA | S | $1,120,096 | $73,974 | 15.1 |
| 5 | Berkeley, CA | M | $1,316,133 | $95,360 | 13.8 |
| 6 | Westminster, CA | S | $730,912 | $56,378 | 13 |
| 7 | Burbank, CA | M | $894,218 | $73,613 | 12.1 |
| 8 | Glendale, CA | M | $806,728 | $68,392 | 11.8 |
| 9 | Hawthorne, CA | S | $705,328 | $60,361 | 11.7 |
| 10 | Santa Cruz, CA | S | $1,048,842 | $90,855 | 11.5 |
| 11 | Los Angeles, CA | L | $759,627 | $67,418 | 11.3 |
| 12 | Miami Beach, FL | S | $586,352 | $52,816 | 11.1 |
| 13 | Davis, CA | S | $667,584 | $60,619 | 11 |
| 14 | Redwood City, CA | S | $1,491,650 | $138,913 | 10.7 |
| 15 | San Francisco, CA | L | $1,324,018 | $123,859 | 10.7 |
| 16 | El Monte, CA | M | $536,462 | $50,829 | 10.6 |
| 17 | Oakland, CA | L | $858,768 | $82,018 | 10.5 |
| 18 | Redondo Beach, CA | S | $1,136,770 | $109,019 | 10.4 |
| 19 | East Los Angeles, CA | M | $541,900 | $53,194 | 10.2 |
| 20 | Inglewood, CA | M | $605,235 | $61,780 | 9.8 |
| 21 | Daly City, CA | M | $995,493 | $101,834 | 9.8 |
| 22 | Pasadena, CA | M | $896,899 | $92,053 | 9.7 |
| 23 | Mountain View, CA | S | $1,438,309 | $147,915 | 9.7 |
| 24 | Honolulu, HI | M | $708,578 | $72,943 | 9.7 |
| 25 | New York, NY | L | $672,886 | $69,407 | 9.7 |
| 26 | Boulder, CO | M | $724,914 | $74,900 | 9.7 |
| 27 | Alameda, CA | S | $1,050,811 | $109,545 | 9.6 |
| 28 | Alhambra, CA | S | $710,028 | $74,132 | 9.6 |
| 29 | Richmond, CA | M | $677,078 | $72,130 | 9.4 |
| 30 | South Gate, CA | S | $504,117 | $53,736 | 9.4 |
| 31 | Lynwood, CA | S | $502,512 | $53,966 | 9.3 |
| 32 | Sunnyvale, CA | M | $1,410,468 | $151,475 | 9.3 |
| 33 | Miami, FL | L | $394,544 | $42,966 | 9.2 |
| 34 | Costa Mesa, CA | M | $843,361 | $91,857 | 9.2 |
| 35 | Escondido, CA | M | $532,233 | $58,157 | 9.2 |
| 36 | San Mateo, CA | M | $1,352,197 | $149,312 | 9.1 |
| 37 | Long Beach, CA | L | $604,569 | $67,804 | 8.9 |
| 38 | San Jose, CA | L | $1,028,295 | $115,893 | 8.9 |
| 39 | South San Francisco, CA | S | $1,066,422 | $120,573 | 8.8 |
| 40 | Garden Grove, CA | M | $635,999 | $72,240 | 8.8 |
| 41 | New Rochelle, NY | S | $646,600 | $74,508 | 8.7 |
| 42 | Florence-Graham, CA | S | $452,312 | $52,152 | 8.7 |
| 43 | Napa, CA | S | $758,472 | $88,310 | 8.6 |
| 44 | Mount Vernon, NY | S | $507,503 | $59,289 | 8.6 |
| 45 | Yonkers, NY | M | $554,308 | $64,916 | 8.5 |
| 46 | Torrance, CA | M | $851,933 | $100,107 | 8.5 |
| 47 | San Clemente, CA | S | $1,083,844 | $127,650 | 8.5 |
| 48 | Walnut Creek, CA | S | $1,012,663 | $120,238 | 8.4 |
| 49 | Boston, MA | L | $664,740 | $79,018 | 8.4 |
| 50 | Huntington Beach, CA | M | $853,841 | $102,423 | 8.3 |
Methodology
This study examined housing price data from Zillow’s Home Value Index, as well as household income, household composition, and population data from the U.S. Census Bureau’s American Community Survey. Data was collected at the city level in this study. Data from Zillow was current as of the end of April 2021, while data from the American Community Survey was from the survey’s 2018 data release. The American Community Survey data includes cities with populations of approximately 65,000 or more residents.
For each city in the study, we determined the number of households (including both households that rent or own their residences) living in 1-, 2-, 3-, 4-, and 5-plus bedroom residences. For simplicity, 0-bedroom residences were considered 1-bedroom residences and included in the 1-bedroom total. For each city, we determined the percentage of households living in each of the five possible configurations.
From the Zillow Home Value Index data, we determined the average cost of 1-, 2-, 3-, 4- and 5-plus bedroom homes in each city. To calculate the average weighted home price for each city, we multiplied the percentage of households living in 1-bedroom homes by the average price for 1-bedroom homes in the city and did the same for 2-, 3-, 4-, and 5-plus bedrooms. We summed together these 5-bedroom configurations to calculate the average weighted home price for each city.
To determine housing affordability, we used median household income data from the American Community Survey for each city. We divided the weighted average home price for each city by the city’s median household income to calculate the price-to-income ratio for each city. The higher this ratio, the less affordable a city is for homebuyers.
We divided the cities into three size categories: small, midsize, and large based on the population of the city, with small cities having populations under 100,000, midsize cities having populations from 100,000 to 350,000, and large cities having populations over 350,000. We then ranked the cities by size and affordability to determine the most and least affordable cities of small, midsize, and large sizes.
Sources
- Zillow Home Value Index (Data Provided by Zillow Group)
- U.S. Census Bureau, American Community Survey