


Approximately one third of American households are occupied by renters. A critical issue for renters is the ability to afford housing. With real estate markets varying widely around the country, there is a wide range when it comes to affordability for renters. AdvisorSmith examined data from the U.S. Census Bureau and the latest rental price data to find the most and least affordable cities for renters nationwide among 500 U.S. cities.
AdvisorSmith’s study calculated rental affordability by examining the ratio of weighted median rent in each city compared with the median household income in each city. This study considers the earning potential of households in each city. It highlights cities with high earning residents and low rental costs, while also highlighting cities where residents must spend a high proportion of their household income on rent.
Among the 500 cities studied, the average rent-to-income ratio was 25.7%. This ratio ranged from as low as 13.1% in Decatur, Georgia, to as high as 49.9% of income in Miami, Florida. Our study also found the most and least affordable cities based on city size.
Least Affordable Cities for Renters by City Size
Our rental analysis segmented cities based on their city size. Large cities were those with over 300,000 residents. Midsize cities had between 100,000 and 300,000 residents, while small cities had under 100,000 residents.

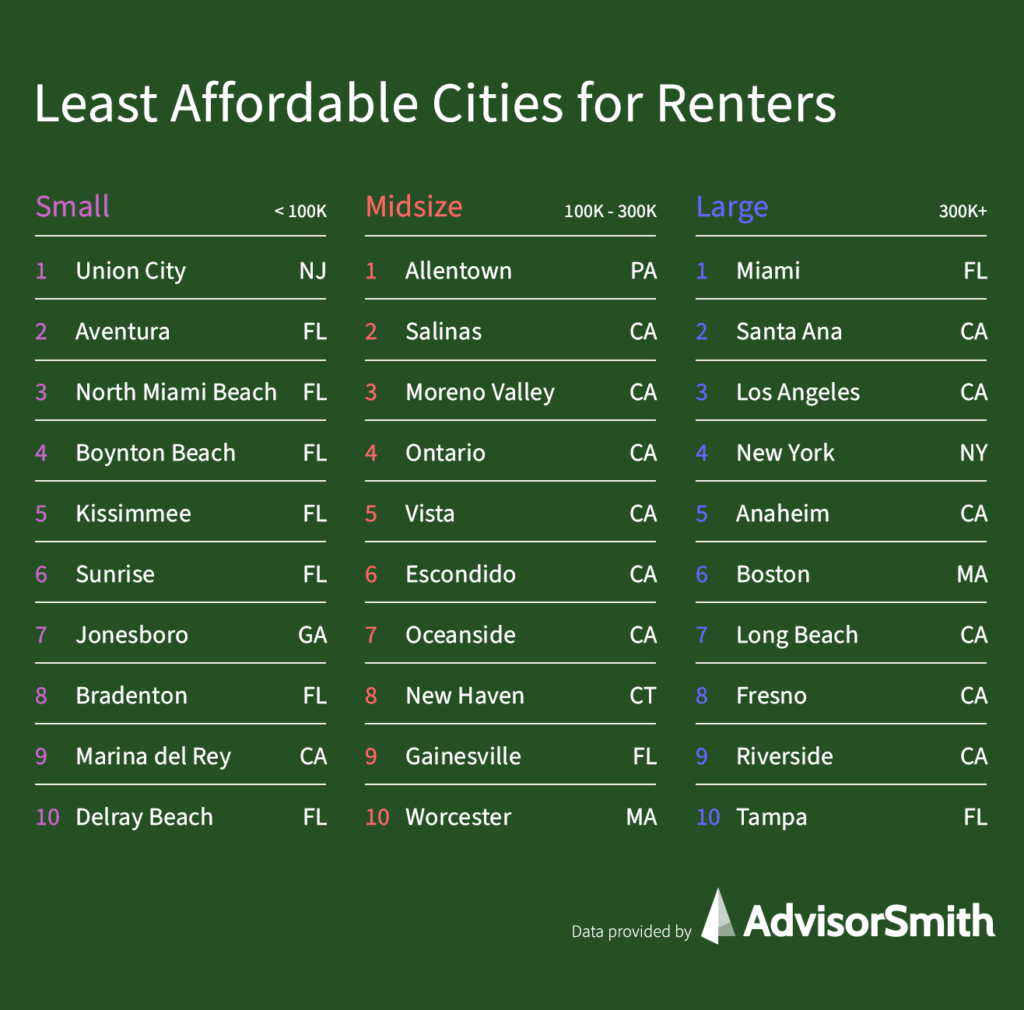
Least Affordable Large Cities for Renters
Some of the nation’s largest cities were among the least affordable for renters. These included Miami, Los Angeles, New York, and Boston in the top 10. Numerous cities in California were among the most unaffordable, with 6 of the top 10 least affordable being in California. Among large cities, the average rent-to-income ratio was 27.1%.
| Rank | City | Median Household Income | Rental Households | Weighted Rent | Rent-Income Ratio |
|---|---|---|---|---|---|
| 1 | Miami, FL | $39,049 | 124,366 | $1,624 | 49.9% |
| 2 | Santa Ana, CA | $66,145 | 41,309 | $2,082 | 37.8% |
| 3 | Los Angeles, CA | $62,142 | 874,365 | $1,883 | 36.4% |
| 4 | New York, NY | $63,998 | 2,132,397 | $1,938 | 36.3% |
| 5 | Anaheim, CA | $71,763 | 56,042 | $2,161 | 36.1% |
| 6 | Boston, MA | $71,115 | 175,116 | $2,025 | 34.2% |
| 7 | Long Beach, CA | $63,017 | 100,354 | $1,757 | 33.4% |
| 8 | Fresno, CA | $50,432 | 89,850 | $1,406 | 33.4% |
| 9 | Riverside, CA | $69,045 | 41,766 | $1,877 | 32.6% |
| 10 | Tampa, FL | $53,833 | 78,335 | $1,443 | 32.2% |
| 11 | Honolulu, HI | $71,465 | 71,283 | $1,892 | 31.8% |
| 12 | Detroit, MI | $30,894 | 139,136 | $806 | 31.3% |
| 13 | San Diego, CA | $79,673 | 269,936 | $2,044 | 30.8% |
| 14 | Mesa, AZ | $58,181 | 70,436 | $1,456 | 30.0% |
| 15 | Oakland, CA | $73,692 | 96,242 | $1,836 | 29.9% |
| 16 | Memphis, TN | $41,228 | 134,371 | $1,024 | 29.8% |
| 17 | Tucson, AZ | $43,425 | 104,975 | $1,069 | 29.6% |
| 18 | Philadelphia, PA | $45,927 | 282,465 | $1,124 | 29.4% |
| 19 | New Orleans, LA | $41,604 | 79,579 | $1,017 | 29.3% |
| 20 | Aurora, CO | $65,100 | 52,156 | $1,583 | 29.2% |
| 21 | Sacramento, CA | $62,335 | 95,508 | $1,496 | 28.8% |
| 22 | Baltimore, MD | $50,379 | 125,529 | $1,170 | 27.9% |
| 23 | Chicago, IL | $58,247 | 586,828 | $1,334 | 27.5% |
| 24 | Cleveland, OH | $30,907 | 99,649 | $703 | 27.3% |
| 25 | Jacksonville, FL | $54,701 | 149,000 | $1,242 | 27.2% |
Least Affordable Midsize Cities for Renters
Among midsize cities, California also took six of the top 10 places. Among midsize cities, the average rent-to-income ratio was 26.2%.
| Rank | City | Median Household Income | Rental Households | Weighted Rent | Rent-Income Ratio |
|---|---|---|---|---|---|
| 1 | Allentown, PA | $41,167 | 24,990 | $1,477 | 43.0% |
| 2 | Salinas, CA | $61,527 | 22,516 | $2,050 | 40.0% |
| 3 | Moreno Valley, CA | $66,134 | 19,510 | $2,198 | 39.9% |
| 4 | Ontario, CA | $65,046 | 23,507 | $2,154 | 39.7% |
| 5 | Vista, CA | $72,125 | 15,337 | $2,285 | 38.0% |
| 6 | Escondido, CA | $64,038 | 22,990 | $2,010 | 37.7% |
| 7 | Oceanside, CA | $72,697 | 26,105 | $2,263 | 37.4% |
| 8 | New Haven, CT | $42,222 | 35,420 | $1,299 | 36.9% |
| 9 | Gainesville, FL | $37,264 | 30,010 | $1,117 | 36.0% |
| 10 | Worcester, MA | $48,139 | 42,042 | $1,440 | 35.9% |
| 11 | Clearwater, FL | $48,691 | 19,757 | $1,446 | 35.6% |
| 12 | Pompano Beach, FL | $49,518 | 19,458 | $1,450 | 35.1% |
| 13 | Port St. Lucie, FL | $60,587 | 15,021 | $1,765 | 34.9% |
| 14 | West Palm Beach, FL | $54,334 | 21,236 | $1,569 | 34.6% |
| 15 | Newark, NJ | $35,199 | 77,942 | $1,009 | 34.4% |
| 16 | West Covina, CA | $82,938 | 11,397 | $2,367 | 34.3% |
| 17 | Hartford, CT | $36,278 | 35,494 | $1,018 | 33.7% |
| 18 | Orlando, FL | $51,757 | 72,395 | $1,436 | 33.3% |
| 19 | Burbank, CA | $75,827 | 24,301 | $2,094 | 33.1% |
| 20 | North Charleston, SC | $45,510 | 23,107 | $1,254 | 33.1% |
| 21 | Irvine, CA | $105,126 | 52,264 | $2,890 | 33.0% |
| 22 | Costa Mesa, CA | $84,138 | 25,279 | $2,301 | 32.8% |
| 23 | Fullerton, CA | $79,978 | 21,898 | $2,165 | 32.5% |
| 24 | Rochester, NY | $35,590 | 54,908 | $951 | 32.1% |
| 25 | Knoxville, TN | $40,341 | 43,837 | $1,074 | 31.9% |
| 26 | Brandon, FL | $61,120 | 20,234 | $1,620 | 31.8% |
| 27 | Rancho Cucamonga, CA | $90,953 | 21,764 | $2,405 | 31.7% |
| 28 | Yonkers, NY | $63,849 | 40,333 | $1,682 | 31.6% |
| 29 | Glendale, CA | $66,130 | 50,076 | $1,724 | 31.3% |
| 30 | Tallahassee, FL | $45,734 | 45,567 | $1,187 | 31.1% |
| 31 | Santa Clarita, CA | $99,666 | 20,681 | $2,578 | 31.0% |
| 32 | Chula Vista, CA | $81,272 | 32,595 | $2,098 | 31.0% |
| 33 | Jersey City, NJ | $70,752 | 73,185 | $1,811 | 30.7% |
| 34 | Birmingham, AL | $37,375 | 50,093 | $954 | 30.6% |
| 35 | Corona, CA | $83,752 | 17,559 | $2,132 | 30.6% |
| 36 | Everett, WA | $60,759 | 23,508 | $1,542 | 30.5% |
| 37 | Tempe, AZ | $57,994 | 43,380 | $1,469 | 30.4% |
| 38 | Richmond, VA | $47,250 | 51,807 | $1,192 | 30.3% |
| 39 | Lowell, MA | $56,878 | 22,741 | $1,433 | 30.2% |
| 40 | Pembroke Pines, FL | $68,745 | 16,647 | $1,721 | 30.0% |
| 41 | Savannah, GA | $43,307 | 29,758 | $1,082 | 30.0% |
| 42 | Lakeland, FL | $47,511 | 18,333 | $1,184 | 29.9% |
| 43 | Orange, CA | $91,793 | 18,136 | $2,287 | 29.9% |
| 44 | Santa Rosa, CA | $75,630 | 30,498 | $1,882 | 29.9% |
| 45 | Pasadena, CA | $83,068 | 32,046 | $2,066 | 29.8% |
| 46 | Gresham, OR | $54,084 | 18,382 | $1,340 | 29.7% |
| 47 | Boulder, CO | $69,520 | 21,753 | $1,719 | 29.7% |
| 48 | Paradise, NV | $48,312 | 55,178 | $1,186 | 29.5% |
| 49 | Miramar, FL | $70,669 | 12,622 | $1,735 | 29.5% |
| 50 | Columbia, SC | $47,286 | 25,470 | $1,155 | 29.3% |
Least Affordable Small Cities for Renters
Small cities in Florida topped the list of least affordable small cities for renters, taking seven of the top 10 places. The rent-to-income ratio in small cities was 25% on average.
| Rank | City | Median Household Income | Rental Households | Weighted Rent | Rent-Income Ratio |
|---|---|---|---|---|---|
| 1 | Union City, NJ | $48,992 | 19,410 | $1,853 | 45.4% |
| 2 | Aventura, FL | $63,892 | 6,285 | $2,351 | 44.2% |
| 3 | North Miami Beach, FL | $43,788 | 6,760 | $1,569 | 43.0% |
| 4 | Boynton Beach, FL | $57,563 | 11,767 | $1,932 | 40.3% |
| 5 | Kissimmee, FL | $40,826 | 13,018 | $1,360 | 40.0% |
| 6 | Sunrise, FL | $54,744 | 11,136 | $1,785 | 39.1% |
| 7 | Jonesboro, GA | $34,418 | 688 | $1,110 | 38.7% |
| 8 | Bradenton, FL | $46,776 | 9,218 | $1,509 | 38.7% |
| 9 | Marina del Rey, CA | $118,162 | 5,221 | $3,775 | 38.3% |
| 10 | Delray Beach, FL | $60,746 | 10,895 | $1,922 | 38.0% |
| 11 | Palm Harbor, FL | $59,557 | 7,170 | $1,863 | 37.5% |
| 12 | Largo, FL | $44,323 | 15,334 | $1,373 | 37.2% |
| 13 | West New York, NJ | $56,436 | 15,593 | $1,722 | 36.6% |
| 14 | La Mesa, CA | $66,051 | 13,616 | $2,010 | 36.5% |
| 15 | Tustin, CA | $84,697 | 12,938 | $2,573 | 36.5% |
| 16 | Coconut Creek, FL | $62,973 | 8,125 | $1,907 | 36.3% |
| 17 | Town 'n' Country, FL | $54,444 | 13,672 | $1,641 | 36.2% |
| 18 | San Marcos, TX | $40,370 | 16,281 | $1,213 | 36.1% |
| 19 | Citrus Heights, CA | $62,276 | 14,723 | $1,845 | 35.6% |
| 20 | Doral, FL | $77,493 | 9,305 | $2,263 | 35.1% |
| 21 | San Marcos, CA | $78,797 | 11,234 | $2,264 | 34.5% |
| 22 | Daytona Beach, FL | $35,893 | 16,374 | $1,026 | 34.3% |
| 23 | Upland, CA | $72,782 | 12,163 | $1,993 | 32.9% |
| 24 | Chino Hills, CA | $106,347 | 6,344 | $2,882 | 32.5% |
| 25 | Spokane Valley, WA | $51,961 | 17,402 | $1,402 | 32.4% |
| 26 | Lakewood, WA | $51,972 | 13,985 | $1,389 | 32.1% |
| 27 | Boca Raton, FL | $83,114 | 11,945 | $2,208 | 31.9% |
| 28 | Avondale, AZ | $61,825 | 11,724 | $1,638 | 31.8% |
| 29 | Melbourne, FL | $48,673 | 13,725 | $1,288 | 31.8% |
| 30 | Sarasota, FL | $53,669 | 10,364 | $1,420 | 31.8% |
| 31 | Calabasas, CA | $125,814 | 2,640 | $3,329 | 31.8% |
| 32 | Palm Beach Gardens, FL | $87,969 | 6,307 | $2,325 | 31.7% |
| 33 | Glendale, CO | $56,557 | 2,750 | $1,492 | 31.7% |
| 34 | Sanford, FL | $47,217 | 11,039 | $1,238 | 31.5% |
| 35 | Laguna Niguel, CA | $108,537 | 7,845 | $2,839 | 31.4% |
| 36 | Federal Way, WA | $67,347 | 15,567 | $1,759 | 31.3% |
| 37 | Wellington, FL | $92,586 | 4,982 | $2,416 | 31.3% |
| 38 | Plantation, FL | $74,903 | 12,240 | $1,945 | 31.2% |
| 39 | West Hollywood, CA | $74,044 | 18,902 | $1,916 | 31.0% |
| 40 | Asheville, NC | $49,930 | 21,135 | $1,289 | 31.0% |
| 41 | Marietta, GA | $57,452 | 14,250 | $1,475 | 30.8% |
| 42 | Northglenn, CO | $66,300 | 6,191 | $1,700 | 30.8% |
| 43 | Harrisburg, PA | $39,685 | 13,221 | $1,016 | 30.7% |
| 44 | Norristown, PA | $48,414 | 8,021 | $1,223 | 30.3% |
| 45 | Bloomington, IN | $37,077 | 19,762 | $937 | 30.3% |
| 46 | Quincy, MA | $77,562 | 22,174 | $1,957 | 30.3% |
| 47 | Bend, OR | $65,662 | 15,341 | $1,655 | 30.2% |
| 48 | Humble, TX | $41,845 | 3,680 | $1,047 | 30.0% |
| 49 | Altamonte Springs, FL | $52,888 | 11,855 | $1,321 | 30.0% |
| 50 | North Druid Hills, GA | $66,660 | 5,325 | $1,662 | 29.9% |
Most Affordable Cities for Renters by City Size
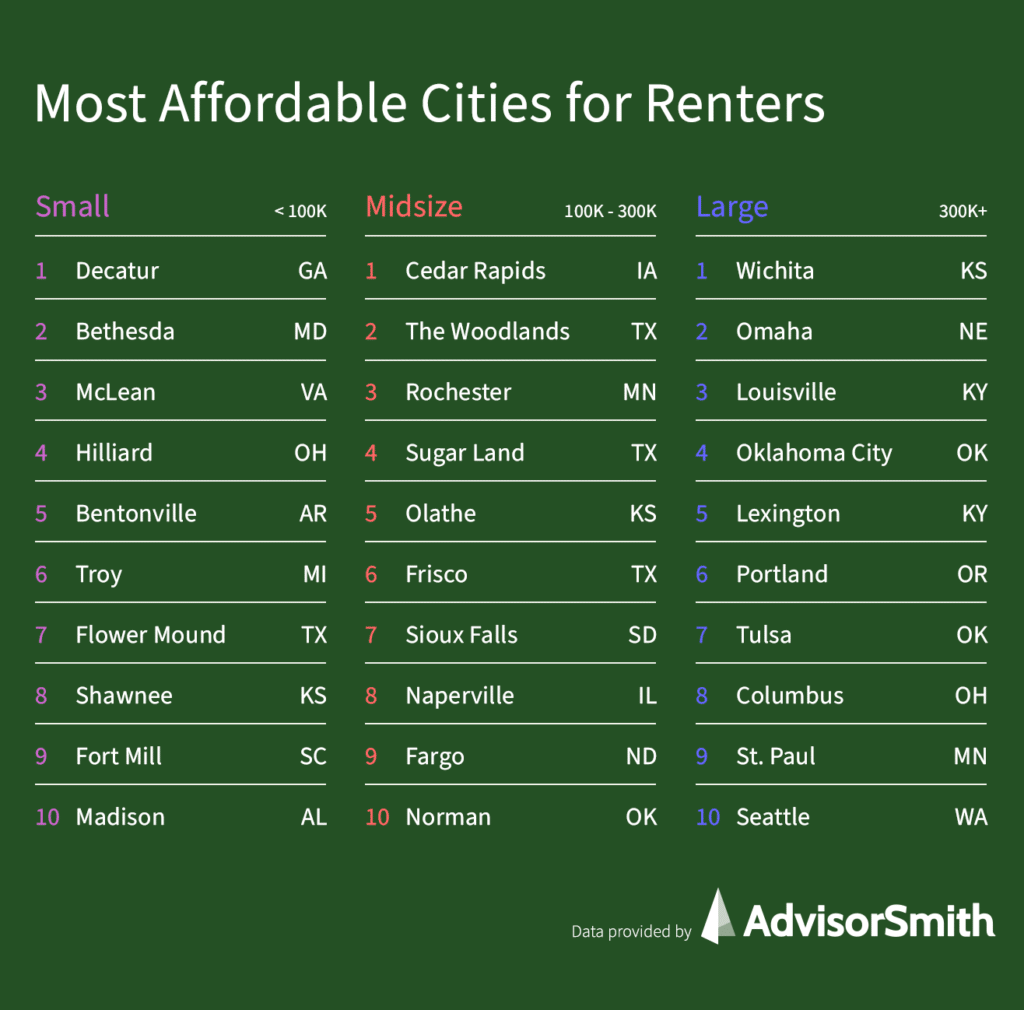
Most Affordable Large Cities for Renters
Large cities in the center of the country topped the list of most affordable large cities for renters. These included cities in Kansas, Nebraska, Kentucky, Oklahoma, Ohio, and Minnesota. These cities generally featured slightly above-average household incomes, with lower-than-average rents.
| Rank | City | Median Household Income | Rental Households | Weighted Rent | Rent-Income Ratio |
|---|---|---|---|---|---|
| 1 | Wichita, KS | $52,620 | 63,194 | $765 | 17.4% |
| 2 | Omaha, NE | $60,092 | 77,321 | $970 | 19.4% |
| 3 | Louisville, KY | $53,436 | 99,013 | $916 | 20.6% |
| 4 | Oklahoma City, OK | $55,557 | 99,755 | $1,002 | 21.7% |
| 5 | Lexington, KY | $57,291 | 59,136 | $1,035 | 21.7% |
| 6 | Portland, OR | $71,005 | 125,266 | $1,292 | 21.8% |
| 7 | Tulsa, OK | $47,650 | 80,810 | $876 | 22.1% |
| 8 | Columbus, OH | $53,745 | 197,315 | $991 | 22.1% |
| 9 | St. Paul, MN | $57,876 | 56,226 | $1,069 | 22.2% |
| 10 | Seattle, WA | $92,263 | 180,114 | $1,743 | 22.7% |
| 11 | Fort Worth, TX | $62,187 | 126,740 | $1,175 | 22.7% |
| 12 | Kansas City, MO | $54,194 | 95,036 | $1,046 | 23.2% |
| 13 | Cincinnati, OH | $40,640 | 85,483 | $791 | 23.3% |
| 14 | Minneapolis, MN | $62,583 | 93,373 | $1,244 | 23.8% |
| 15 | Albuquerque, NM | $52,911 | 90,295 | $1,052 | 23.9% |
| 16 | Raleigh, NC | $67,266 | 88,903 | $1,339 | 23.9% |
| 17 | San Jose, CA | $109,593 | 140,514 | $2,194 | 24.0% |
| 18 | Indianapolis, IN | $47,873 | 158,507 | $961 | 24.1% |
| 19 | Bakersfield, CA | $63,139 | 47,945 | $1,273 | 24.2% |
| 20 | Colorado Springs, CO | $64,712 | 74,320 | $1,316 | 24.4% |
| 21 | Charlotte, NC | $62,817 | 155,595 | $1,286 | 24.6% |
| 22 | Washington, DC | $86,420 | 166,019 | $1,779 | 24.7% |
| 23 | Houston, TX | $52,338 | 495,281 | $1,078 | 24.7% |
| 24 | El Paso, TX | $47,568 | 93,322 | $980 | 24.7% |
| 25 | Corpus Christi, TX | $56,333 | 50,616 | $1,163 | 24.8% |
Most Affordable Midsize Cities for Renters
Affordable midsize cities were split between cities with very high incomes and moderate housing costs, and cities with moderate incomes and very low housing costs. Examples of the former include The Woodlands, Sugar Land, Frisco, and Naperville, while examples of the latter include Cedar Rapids and Sioux Falls.
| Rank | City | Median Household Income | Rental Households | Weighted Rent | Rent-Income Ratio |
|---|---|---|---|---|---|
| 1 | Cedar Rapids, IA | $58,511 | 17,002 | $660 | 13.5% |
| 2 | The Woodlands, TX | $122,634 | 12,155 | $1,433 | 14.0% |
| 3 | Rochester, MN | $73,106 | 15,166 | $918 | 15.1% |
| 4 | Sugar Land, TX | $121,274 | 7,319 | $1,542 | 15.3% |
| 5 | Olathe, KS | $90,435 | 13,379 | $1,166 | 15.5% |
| 6 | Frisco, TX | $127,055 | 17,101 | $1,642 | 15.5% |
| 7 | Sioux Falls, SD | $59,912 | 28,459 | $809 | 16.2% |
| 8 | Naperville, IL | $125,926 | 12,686 | $1,757 | 16.7% |
| 9 | Fargo, ND | $55,551 | 30,751 | $778 | 16.8% |
| 10 | Norman, OK | $58,119 | 22,625 | $822 | 17.0% |
| 11 | Cary, NC | $104,669 | 19,854 | $1,506 | 17.3% |
| 12 | League City, TX | $109,073 | 8,669 | $1,581 | 17.4% |
| 13 | Overland Park, KS | $86,487 | 28,573 | $1,290 | 17.9% |
| 14 | Anchorage, AK | $84,928 | 41,200 | $1,309 | 18.5% |
| 15 | Pearland, TX | $104,504 | 9,998 | $1,636 | 18.8% |
| 16 | Amarillo, TX | $52,725 | 30,167 | $827 | 18.8% |
| 17 | Lincoln, NE | $57,746 | 48,850 | $911 | 18.9% |
| 18 | Little Rock, AR | $51,485 | 36,632 | $819 | 19.1% |
| 19 | Des Moines, IA | $53,525 | 34,265 | $854 | 19.1% |
| 20 | Columbia, MO | $51,276 | 25,335 | $819 | 19.2% |
| 21 | Fort Wayne, IN | $49,411 | 40,583 | $790 | 19.2% |
| 22 | Arvada, CO | $84,717 | 12,315 | $1,395 | 19.8% |
| 23 | Plano, TX | $95,602 | 43,296 | $1,576 | 19.8% |
| 24 | McKinney, TX | $93,354 | 21,389 | $1,557 | 20.0% |
| 25 | Columbia, MD | $108,352 | 13,949 | $1,835 | 20.3% |
| 26 | Lubbock, TX | $50,453 | 46,551 | $874 | 20.8% |
| 27 | Topeka, KS | $47,999 | 23,518 | $834 | 20.8% |
| 28 | Aurora, IL | $71,749 | 22,572 | $1,247 | 20.9% |
| 29 | Arlington, VA | $120,071 | 61,280 | $2,111 | 21.1% |
| 30 | Sunnyvale, CA | $140,631 | 30,642 | $2,479 | 21.2% |
| 31 | Highlands Ranch, CO | $125,454 | 7,507 | $2,240 | 21.4% |
| 32 | Alexandria, VA | $100,939 | 40,045 | $1,834 | 21.8% |
| 33 | McAllen, TX | $46,804 | 17,895 | $850 | 21.8% |
| 34 | Gilbert, AZ | $96,857 | 20,393 | $1,769 | 21.9% |
| 35 | Centennial, CO | $109,324 | 7,103 | $1,999 | 21.9% |
| 36 | Huntsville, AL | $55,305 | 36,827 | $1,012 | 22.0% |
| 37 | Carrollton, TX | $78,306 | 19,891 | $1,435 | 22.0% |
| 38 | Scottsdale, AZ | $88,213 | 38,963 | $1,636 | 22.3% |
| 39 | Richardson, TX | $85,678 | 17,672 | $1,602 | 22.4% |
| 40 | Greeley, CO | $57,586 | 14,770 | $1,081 | 22.5% |
| 41 | Sandy Springs, GA | $78,613 | 24,530 | $1,482 | 22.6% |
| 42 | Clarksville, TN | $53,604 | 26,427 | $1,012 | 22.7% |
| 43 | Madison, WI | $65,332 | 58,449 | $1,242 | 22.8% |
| 44 | Round Rock, TX | $82,676 | 15,568 | $1,581 | 22.9% |
| 45 | Elk Grove, CA | $93,780 | 13,334 | $1,805 | 23.1% |
| 46 | Salt Lake City, UT | $60,676 | 41,147 | $1,169 | 23.1% |
| 47 | Pasadena, TX | $55,039 | 22,313 | $1,063 | 23.2% |
| 48 | Lansing, MI | $41,674 | 24,200 | $811 | 23.4% |
| 49 | Denton, TX | $60,018 | 23,940 | $1,170 | 23.4% |
| 50 | Bellevue, WA | $120,456 | 26,687 | $2,362 | 23.5% |
Most Affordable Small Cities for Renters
Many of the top 10 most affordable small cities for renters are cities with very high household incomes and moderate rental costs. All of the top 10 most affordable small cities had median household incomes exceeding $80,000 per year.
| Rank | City | Median Household Income | Rental Households | Weighted Rent | Rent-Income Ratio |
|---|---|---|---|---|---|
| 1 | Decatur, GA | $106,088 | 2,989 | $1,161 | 13.1% |
| 2 | Bethesda, MD | $164,142 | 8,750 | $1,874 | 13.7% |
| 3 | McLean, VA | $207,184 | 2,180 | $2,448 | 14.2% |
| 4 | Hilliard, OH | $96,959 | 4,060 | $1,184 | 14.6% |
| 5 | Bentonville, AR | $80,392 | 8,343 | $1,032 | 15.4% |
| 6 | Troy, MI | $101,882 | 8,331 | $1,317 | 15.5% |
| 7 | Flower Mound, TX | $137,285 | 3,560 | $1,807 | 15.8% |
| 8 | Shawnee, KS | $87,120 | 6,615 | $1,164 | 16.0% |
| 9 | Fort Mill, SC | $91,061 | 1,451 | $1,221 | 16.1% |
| 10 | Madison, AL | $99,188 | 5,481 | $1,347 | 16.3% |
| 11 | Carmel, IN | $112,765 | 9,003 | $1,542 | 16.4% |
| 12 | St. Charles, MO | $68,486 | 10,009 | $942 | 16.5% |
| 13 | Coppell, TX | $122,340 | 4,362 | $1,702 | 16.7% |
| 14 | Ellicott City, MD | $131,534 | 6,700 | $1,850 | 16.9% |
| 15 | Minot, ND | $66,194 | 9,090 | $934 | 16.9% |
| 16 | Rowlett, TX | $101,085 | 2,974 | $1,437 | 17.1% |
| 17 | Eagan, MN | $90,515 | 7,940 | $1,302 | 17.3% |
| 18 | Farmington Hills, MI | $83,268 | 12,706 | $1,206 | 17.4% |
| 19 | Lawton, OK | $47,779 | 18,169 | $695 | 17.4% |
| 20 | Lenexa, KS | $87,102 | 8,472 | $1,268 | 17.5% |
| 21 | Allen, TX | $105,925 | 8,687 | $1,546 | 17.5% |
| 22 | Ashburn, VA | $132,331 | 4,878 | $1,934 | 17.5% |
| 23 | Katy, TX | $83,091 | 1,306 | $1,221 | 17.6% |
| 24 | Greer, SC | $61,744 | 4,344 | $934 | 18.1% |
| 25 | Eden Prairie, MN | $111,981 | 6,685 | $1,698 | 18.2% |
| 26 | West Des Moines, IA | $76,368 | 11,220 | $1,161 | 18.2% |
| 27 | Apple Valley, MN | $89,251 | 4,438 | $1,359 | 18.3% |
| 28 | Hoover, AL | $89,452 | 9,854 | $1,364 | 18.3% |
| 29 | Reston, VA | $120,396 | 9,900 | $1,844 | 18.4% |
| 30 | Plymouth, MN | $105,958 | 8,993 | $1,628 | 18.4% |
| 31 | St. Cloud, MN | $49,135 | 13,199 | $757 | 18.5% |
| 32 | Lee's Summit, MO | $89,969 | 8,385 | $1,396 | 18.6% |
| 33 | Alpharetta, GA | $113,802 | 8,164 | $1,768 | 18.6% |
| 34 | Naples, FL | $107,013 | 2,344 | $1,672 | 18.7% |
| 35 | Falls Church, VA | $127,610 | 2,289 | $1,999 | 18.8% |
| 36 | Johns Creek, GA | $122,514 | 6,583 | $1,931 | 18.9% |
| 37 | Castle Rock, CO | $109,700 | 4,760 | $1,734 | 19.0% |
| 38 | Grand Forks, ND | $50,076 | 14,277 | $798 | 19.1% |
| 39 | Cedar Park, TX | $104,019 | 7,683 | $1,661 | 19.2% |
| 40 | Sandy, UT | $94,018 | 6,696 | $1,503 | 19.2% |
| 41 | Huntersville, NC | $102,016 | 5,075 | $1,640 | 19.3% |
| 42 | Fort Smith, AR | $41,724 | 17,733 | $672 | 19.3% |
| 43 | Edina, MN | $104,244 | 6,366 | $1,679 | 19.3% |
| 44 | Bellevue, NE | $65,308 | 7,753 | $1,058 | 19.4% |
| 45 | Concord, NC | $67,984 | 10,504 | $1,106 | 19.5% |
| 46 | Roswell, GA | $99,726 | 10,892 | $1,632 | 19.6% |
| 47 | Morrisville, NC | $101,738 | 5,088 | $1,679 | 19.8% |
| 48 | Fairfax, VA | $116,979 | 2,573 | $1,933 | 19.8% |
| 49 | Woodbridge, VA | $113,065 | 493 | $1,877 | 19.9% |
| 50 | Pflugerville, TX | $93,627 | 5,405 | $1,564 | 20.0% |
Top 50 Least Affordable Cities for Renters
The table below lists the 50 least affordable cities for renters nationwide. Cities in which renters spend at least 33% of their median household income on rent qualified as a city for the least affordable list.
| Rank | City | Median Household Income | Rental Households | Weighted Rent | Rent-Income Ratio |
|---|---|---|---|---|---|
| 1 | Miami, FL | $39,049 | 124,366 | $1,624 | 49.9% |
| 2 | Union City, NJ | $48,992 | 19,410 | $1,853 | 45.4% |
| 3 | Aventura, FL | $63,892 | 6,285 | $2,351 | 44.2% |
| 4 | Allentown, PA | $41,167 | 24,990 | $1,477 | 43.0% |
| 5 | North Miami Beach, FL | $43,788 | 6,760 | $1,569 | 43.0% |
| 6 | Boynton Beach, FL | $57,563 | 11,767 | $1,932 | 40.3% |
| 7 | Salinas, CA | $61,527 | 22,516 | $2,050 | 40.0% |
| 8 | Kissimmee, FL | $40,826 | 13,018 | $1,360 | 40.0% |
| 9 | Moreno Valley, CA | $66,134 | 19,510 | $2,198 | 39.9% |
| 10 | Ontario, CA | $65,046 | 23,507 | $2,154 | 39.7% |
| 11 | Sunrise, FL | $54,744 | 11,136 | $1,785 | 39.1% |
| 12 | Jonesboro, GA | $34,418 | 688 | $1,110 | 38.7% |
| 13 | Bradenton, FL | $46,776 | 9,218 | $1,509 | 38.7% |
| 14 | Marina del Rey, CA | $118,162 | 5,221 | $3,775 | 38.3% |
| 15 | Vista, CA | $72,125 | 15,337 | $2,285 | 38.0% |
| 16 | Delray Beach, FL | $60,746 | 10,895 | $1,922 | 38.0% |
| 17 | Santa Ana, CA | $66,145 | 41,309 | $2,082 | 37.8% |
| 18 | Escondido, CA | $64,038 | 22,990 | $2,010 | 37.7% |
| 19 | Palm Harbor, FL | $59,557 | 7,170 | $1,863 | 37.5% |
| 20 | Oceanside, CA | $72,697 | 26,105 | $2,263 | 37.4% |
| 21 | Largo, FL | $44,323 | 15,334 | $1,373 | 37.2% |
| 22 | New Haven, CT | $42,222 | 35,420 | $1,299 | 36.9% |
| 23 | West New York, NJ | $56,436 | 15,593 | $1,722 | 36.6% |
| 24 | La Mesa, CA | $66,051 | 13,616 | $2,010 | 36.5% |
| 25 | Tustin, CA | $84,697 | 12,938 | $2,573 | 36.5% |
| 26 | Los Angeles, CA | $62,142 | 874,365 | $1,883 | 36.4% |
| 27 | Coconut Creek, FL | $62,973 | 8,125 | $1,907 | 36.3% |
| 28 | New York, NY | $63,998 | 2,132,397 | $1,938 | 36.3% |
| 29 | Town 'n' Country, FL | $54,444 | 13,672 | $1,641 | 36.2% |
| 30 | Anaheim, CA | $71,763 | 56,042 | $2,161 | 36.1% |
| 31 | San Marcos, TX | $40,370 | 16,281 | $1,213 | 36.1% |
| 32 | Gainesville, FL | $37,264 | 30,010 | $1,117 | 36.0% |
| 33 | Worcester, MA | $48,139 | 42,042 | $1,440 | 35.9% |
| 34 | Clearwater, FL | $48,691 | 19,757 | $1,446 | 35.6% |
| 35 | Citrus Heights, CA | $62,276 | 14,723 | $1,845 | 35.6% |
| 36 | Pompano Beach, FL | $49,518 | 19,458 | $1,450 | 35.1% |
| 37 | Doral, FL | $77,493 | 9,305 | $2,263 | 35.1% |
| 38 | Port St. Lucie, FL | $60,587 | 15,021 | $1,765 | 34.9% |
| 39 | West Palm Beach, FL | $54,334 | 21,236 | $1,569 | 34.6% |
| 40 | San Marcos, CA | $78,797 | 11,234 | $2,264 | 34.5% |
| 41 | Newark, NJ | $35,199 | 77,942 | $1,009 | 34.4% |
| 42 | Daytona Beach, FL | $35,893 | 16,374 | $1,026 | 34.3% |
| 43 | West Covina, CA | $82,938 | 11,397 | $2,367 | 34.3% |
| 44 | Boston, MA | $71,115 | 175,116 | $2,025 | 34.2% |
| 45 | Hartford, CT | $36,278 | 35,494 | $1,018 | 33.7% |
| 46 | Long Beach, CA | $63,017 | 100,354 | $1,757 | 33.4% |
| 47 | Fresno, CA | $50,432 | 89,850 | $1,406 | 33.4% |
| 48 | Orlando, FL | $51,757 | 72,395 | $1,436 | 33.3% |
| 49 | Burbank, CA | $75,827 | 24,301 | $2,094 | 33.1% |
| 50 | North Charleston, SC | $45,510 | 23,107 | $1,254 | 33.1% |
Top 50 Most Affordable Cities for Renters
The following cities were the most affordable cities for renters. In these cities, renters spent 18.8% or less of their household income on rent.
| Rank | City | Median Household Income | Rental Households | Weighted Rent | Rent-Income Ratio |
|---|---|---|---|---|---|
| 1 | Decatur, GA | $106,088 | 2,989 | $1,161 | 13.1% |
| 2 | Cedar Rapids, IA | $58,511 | 17,002 | $660 | 13.5% |
| 3 | Bethesda, MD | $164,142 | 8,750 | $1,874 | 13.7% |
| 4 | The Woodlands, TX | $122,634 | 12,155 | $1,433 | 14.0% |
| 5 | McLean, VA | $207,184 | 2,180 | $2,448 | 14.2% |
| 6 | Hilliard, OH | $96,959 | 4,060 | $1,184 | 14.6% |
| 7 | Rochester, MN | $73,106 | 15,166 | $918 | 15.1% |
| 8 | Sugar Land, TX | $121,274 | 7,319 | $1,542 | 15.3% |
| 9 | Bentonville, AR | $80,392 | 8,343 | $1,032 | 15.4% |
| 10 | Olathe, KS | $90,435 | 13,379 | $1,166 | 15.5% |
| 11 | Troy, MI | $101,882 | 8,331 | $1,317 | 15.5% |
| 12 | Frisco, TX | $127,055 | 17,101 | $1,642 | 15.5% |
| 13 | Flower Mound, TX | $137,285 | 3,560 | $1,807 | 15.8% |
| 14 | Shawnee, KS | $87,120 | 6,615 | $1,164 | 16.0% |
| 15 | Fort Mill, SC | $91,061 | 1,451 | $1,221 | 16.1% |
| 16 | Sioux Falls, SD | $59,912 | 28,459 | $809 | 16.2% |
| 17 | Madison, AL | $99,188 | 5,481 | $1,347 | 16.3% |
| 18 | Carmel, IN | $112,765 | 9,003 | $1,542 | 16.4% |
| 19 | St. Charles, MO | $68,486 | 10,009 | $942 | 16.5% |
| 20 | Coppell, TX | $122,340 | 4,362 | $1,702 | 16.7% |
| 21 | Naperville, IL | $125,926 | 12,686 | $1,757 | 16.7% |
| 22 | Fargo, ND | $55,551 | 30,751 | $778 | 16.8% |
| 23 | Ellicott City, MD | $131,534 | 6,700 | $1,850 | 16.9% |
| 24 | Minot, ND | $66,194 | 9,090 | $934 | 16.9% |
| 25 | Norman, OK | $58,119 | 22,625 | $822 | 17.0% |
| 26 | Rowlett, TX | $101,085 | 2,974 | $1,437 | 17.1% |
| 27 | Eagan, MN | $90,515 | 7,940 | $1,302 | 17.3% |
| 28 | Cary, NC | $104,669 | 19,854 | $1,506 | 17.3% |
| 29 | Farmington Hills, MI | $83,268 | 12,706 | $1,206 | 17.4% |
| 30 | League City, TX | $109,073 | 8,669 | $1,581 | 17.4% |
| 31 | Wichita, KS | $52,620 | 63,194 | $765 | 17.4% |
| 32 | Lawton, OK | $47,779 | 18,169 | $695 | 17.4% |
| 33 | Lenexa, KS | $87,102 | 8,472 | $1,268 | 17.5% |
| 34 | Allen, TX | $105,925 | 8,687 | $1,546 | 17.5% |
| 35 | Ashburn, VA | $132,331 | 4,878 | $1,934 | 17.5% |
| 36 | Katy, TX | $83,091 | 1,306 | $1,221 | 17.6% |
| 37 | Overland Park, KS | $86,487 | 28,573 | $1,290 | 17.9% |
| 38 | Greer, SC | $61,744 | 4,344 | $934 | 18.1% |
| 39 | Eden Prairie, MN | $111,981 | 6,685 | $1,698 | 18.2% |
| 40 | West Des Moines, IA | $76,368 | 11,220 | $1,161 | 18.2% |
| 41 | Apple Valley, MN | $89,251 | 4,438 | $1,359 | 18.3% |
| 42 | Hoover, AL | $89,452 | 9,854 | $1,364 | 18.3% |
| 43 | Reston, VA | $120,396 | 9,900 | $1,844 | 18.4% |
| 44 | Plymouth, MN | $105,958 | 8,993 | $1,628 | 18.4% |
| 45 | St. Cloud, MN | $49,135 | 13,199 | $757 | 18.5% |
| 46 | Anchorage, AK | $84,928 | 41,200 | $1,309 | 18.5% |
| 47 | Lee's Summit, MO | $89,969 | 8,385 | $1,396 | 18.6% |
| 48 | Alpharetta, GA | $113,802 | 8,164 | $1,768 | 18.6% |
| 49 | Naples, FL | $107,013 | 2,344 | $1,672 | 18.7% |
| 50 | Pearland, TX | $104,504 | 9,998 | $1,636 | 18.8% |
Methodology
We ranked 500 U.S. cities based upon housing affordability, which we defined as the percentage of median household income spent on rent for the average household. We used rental price data from Apartment List, which estimates the median rent for rental properties in cities across the United States. We also used data from the U.S. Census Bureau’s American Community Survey, which provides information about the median household income in each city, and the composition of households, estimating the number of households with 1, 2, 3, and 4 or more members.
We used the data on household composition to determine the average weighted rent cost for each city, which was based upon a fixed ratio of bedrooms to household members. We calculated the percentage of median household income that would need to be spent by the average household to rent average housing in each city, based upon each city’s household composition. We ranked all 500 cities based on this affordability metric, finding the most and least affordable cities for renters nationwide. We also found the most and least affordable small, midsize, and large cities for renters, with small cities being those with under 100,000 population; midsize cities having between 100,000 and 300,000 population, and large cities having over 300,000 residents.
Sources
- Apartment List Data & Rent Estimates, City-Level Historic Estimates
- U.S. Census Bureau, American Community Survey