


With a resurgence of interest in healthy and active lifestyles, the fitness industry has been quickly growing on an annual basis in the U.S. However, there are large geographical variations in the health and fitness of Americans based upon lifestyle, weather, food, and other factors. In this analysis, AdvisorSmith examined data published by the CDC to find the cities and states in the country whose populations are the fittest.
To determine the fittest cities and states nationwide, we examined data from the CDC’s BRFSS survey, which reports the health status of Americans around the country. We examined the percentage of residents who were of normal weight as determined by body mass index (BMI), as well as the percentage of residents who regularly participate in aerobic exercise, muscle-building exercises, and any exercise at all.
Fittest Cities in America

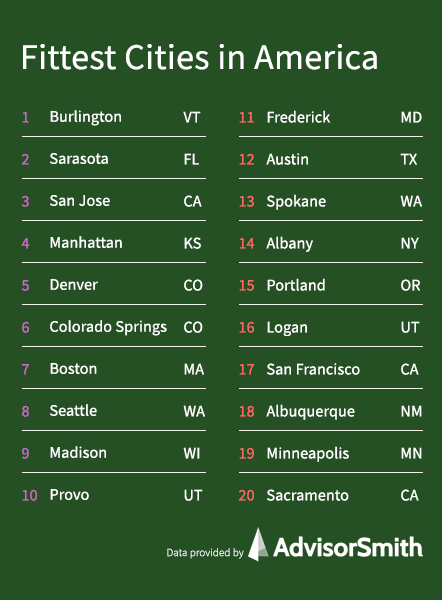
Cities from very different parts of the country were among the fittest cities in the nation. From the sun-drenched shores of California and Florida to small midwestern and northeastern cities, there was varied geographic representation among the fittest cities. AdvisorSmith’s study compared 124 metropolitan statistical areas and metropolitan divisions to find the cities in the nation with the highest number of fit residents.
Across the cities we studied, an average of 31% of residents had normal weight. About 51% of city residents participated in at least 150 minutes of aerobic exercise a week, while an average of 35% participated in muscle-building exercises at least twice a week. On average, 75% of residents exercised at least once in the past month.
| Rank | City | Normal Weight (BMI) % | Aerobic % | Strength % | Exercise % | Total Score |
|---|---|---|---|---|---|---|
| 1 | Burlington, VT | 41 | 63.4 | 43.1 | 83.5 | 92 |
| 2 | Sarasota, FL | 39.6 | 66 | 42.3 | 78.5 | 88.2 |
| 3 | San Jose, CA | 43.5 | 54.8 | 31.6 | 80.3 | 78.6 |
| 4 | Manhattan, KS | 38.2 | 57.4 | 40.5 | 81.9 | 77.8 |
| 5 | Denver, CO | 38.6 | 57 | 39.6 | 81.1 | 77.2 |
| 6 | Colorado Springs, CO | 38.5 | 54.8 | 41.2 | 80 | 75.8 |
| 7 | Boston, MA | 42.7 | 53.4 | 35.4 | 73.7 | 75.4 |
| 8 | Seattle, WA | 38.2 | 57.5 | 36.9 | 82.8 | 75.4 |
| 9 | Madison, WI | 35.2 | 59.2 | 42.1 | 83.2 | 75.1 |
| 10 | Provo, UT | 38 | 54.5 | 38.7 | 84.2 | 74.5 |
| 11 | Frederick, MD | 39.1 | 53.1 | 39.3 | 80.7 | 74.3 |
| 12 | Austin, TX | 39.1 | 54.1 | 36.5 | 79.6 | 72.4 |
| 13 | Spokane, WA | 34.9 | 60.5 | 38.5 | 80.8 | 71.4 |
| 14 | Albany, NY | 36.6 | 54 | 42.9 | 76.7 | 70.7 |
| 15 | Portland, OR | 35.8 | 59.2 | 36.2 | 79.4 | 69.5 |
| 16 | Logan, UT | 34 | 59.3 | 37.9 | 83.7 | 69.4 |
| 17 | San Francisco, CA | 38.4 | 55.9 | 31.5 | 81.1 | 69.1 |
| 18 | Albuquerque, NM | 36.2 | 55.2 | 39 | 77.2 | 68 |
| 19 | Minneapolis, MN | 33.9 | 58.7 | 38 | 82.1 | 67.9 |
| 20 | Sacramento, CA | 37.2 | 54.3 | 34.4 | 80.3 | 67.1 |
| 21 | Rochester, MN | 34 | 60.3 | 35.5 | 81.2 | 67.1 |
| 22 | Washington, DC | 36.1 | 52.6 | 38.5 | 78.5 | 65.7 |
| 23 | Cambridge, MA | 39 | 52.5 | 33.4 | 74.2 | 65.4 |
| 24 | Ogden, UT | 32.7 | 56.3 | 39.2 | 81.3 | 63.8 |
| 25 | Grand Rapids, MI | 33.1 | 55.4 | 39.1 | 81 | 63.6 |
| 26 | Tampa, FL | 34.5 | 55.2 | 38.4 | 76.2 | 63.4 |
| 27 | Los Angeles, CA | 36.3 | 53 | 34.9 | 77.4 | 63 |
| 28 | Portland, ME | 36.4 | 54.5 | 34.6 | 74.5 | 62.8 |
| 29 | Boise, ID | 36.2 | 55.8 | 31.7 | 77.7 | 62.8 |
| 30 | Salt Lake City, UT | 34.7 | 52.5 | 37.3 | 80.3 | 62.6 |
| 31 | New York, NY | 37.8 | 49.1 | 37.9 | 71.7 | 62.3 |
| 32 | Miami, FL | 34.6 | 53.3 | 40.3 | 73.5 | 62.1 |
| 33 | Reno, NV | 31.7 | 56.5 | 41 | 78.7 | 62 |
| 34 | Syracuse, NY | 34.1 | 54.1 | 39.8 | 74.8 | 62 |
| 35 | Lincoln, NE | 33.1 | 53.4 | 39.4 | 79.9 | 61.6 |
| 36 | Idaho Falls, ID | 35.6 | 53.4 | 32.7 | 77.3 | 60 |
| 37 | Daytona Beach, FL | 32 | 58.1 | 37.7 | 75.7 | 59.8 |
| 38 | Anchorage, AK | 32.4 | 55.2 | 37.9 | 78.5 | 59.7 |
| 39 | Duluth, MN | 31.1 | 59.9 | 36.3 | 77.8 | 59.5 |
| 40 | Gainesville, FL | 33.4 | 56 | 35.9 | 75.6 | 59.4 |
| 41 | Hartford, CT | 31.9 | 55.4 | 38.8 | 76.6 | 58.6 |
| 42 | Akron, OH | 34.7 | 51.6 | 37.8 | 72.3 | 58.1 |
| 43 | Phoenix, AZ | 32.9 | 52.9 | 37.6 | 76 | 57.2 |
| 44 | Billings, MT | 31 | 55.4 | 38.7 | 77 | 56.8 |
| 45 | Columbia, SC | 31.9 | 52.6 | 39.5 | 74.4 | 55.6 |
| 46 | Chicago, IL | 33.3 | 49.7 | 37.9 | 75 | 55 |
| 47 | Buffalo, NY | 29.8 | 54.8 | 39.3 | 77.7 | 54.6 |
| 48 | Pensacola, FL | 31.3 | 55.3 | 36.2 | 74.5 | 54 |
| 49 | Poughkeepsie, NY | 31.7 | 54.3 | 37.3 | 71.9 | 53.6 |
| 50 | Atlanta, GA | 31.8 | 49.5 | 38.8 | 76.5 | 53.1 |
| 51 | Fargo, ND | 33 | 51.5 | 32.5 | 78 | 53 |
| 52 | Providence, RI | 34.4 | 49.2 | 33.8 | 72.5 | 52.2 |
| 53 | Wilmington, DE | 31.2 | 52.7 | 36.1 | 75.5 | 52 |
| 54 | Raleigh, NC | 31 | 52.5 | 35.4 | 77.5 | 51.8 |
| 55 | Orlando, FL | 32.5 | 52.5 | 34.3 | 72.8 | 51.7 |
| 56 | Nashville, TN | 31.5 | 48.5 | 39.8 | 74.4 | 51.3 |
| 57 | Worcester, MA | 30.8 | 53.6 | 35 | 75.1 | 50.8 |
| 58 | Warren, MI | 29.5 | 54.1 | 35.7 | 78.4 | 50.7 |
| 59 | Baltimore, MD | 30.5 | 51.8 | 36.5 | 76.7 | 50.6 |
| 60 | St. Cloud, MN | 31.6 | 52.5 | 34.5 | 73 | 50 |
| 61 | Charleston, SC | 27.2 | 53.9 | 41.7 | 76.2 | 49.5 |
| 62 | Tallahassee, FL | 34.1 | 45.6 | 30.7 | 75.7 | 47.5 |
| 63 | Jacksonville, FL | 30.2 | 52.9 | 35.4 | 71.2 | 47.2 |
| 64 | Youngstown, OH | 31.3 | 49.3 | 36.5 | 70.7 | 47 |
| 65 | Springfield, MA | 33.9 | 50.2 | 28.2 | 71.4 | 46.9 |
| 66 | Des Moines, IA | 30.1 | 50.8 | 34.3 | 76.2 | 46.8 |
| 67 | Richmond, VA | 29.4 | 51.8 | 34.4 | 77.1 | 46.8 |
| 68 | Cedar Rapids, IA | 29.9 | 52.3 | 33.4 | 75.2 | 46.5 |
| 69 | Salem, OR | 31.4 | 51.7 | 31.2 | 73 | 46.2 |
| 70 | Charlotte, NC | 29.7 | 51.6 | 33.2 | 76.1 | 45.7 |
| 71 | New Orleans, LA | 30.1 | 47.9 | 37.9 | 72.9 | 45.5 |
| 72 | Knoxville, TN | 30 | 50.1 | 35.6 | 72.5 | 45.2 |
| 73 | Rochester, NY | 32.9 | 48.5 | 31.1 | 70.4 | 45.1 |
| 74 | Fort Worth, TX | 33.2 | 43.7 | 34.3 | 72.1 | 45 |
| 75 | Virginia Beach, VA | 28 | 50.9 | 37.6 | 75.8 | 45 |
| 76 | Omaha, NE | 30.8 | 47.6 | 34.2 | 73.9 | 44.2 |
| 77 | Augusta, GA | 29.3 | 49.9 | 37.4 | 70.9 | 44.1 |
| 78 | Cincinnati, OH | 31.6 | 45.8 | 34.3 | 73.3 | 44.1 |
| 79 | Pittsburgh, PA | 29.7 | 50.5 | 33.5 | 74.1 | 44 |
| 80 | San Antonio, TX | 27.6 | 49.4 | 39.3 | 75.4 | 44 |
| 81 | Dallas, TX | 29.9 | 47.7 | 37.3 | 70.4 | 43.1 |
| 82 | Rapid City, SD | 31.3 | 45.9 | 36.3 | 69.3 | 43.1 |
| 83 | Bismarck, ND | 29.5 | 50 | 33.5 | 73.5 | 42.8 |
| 84 | Fort Wayne, IN | 27.5 | 47.5 | 41.9 | 72.6 | 42.8 |
| 85 | Fayetteville, AR | 30 | 51.1 | 27.9 | 77.6 | 42.3 |
| 86 | Dayton, OH | 28.5 | 48.2 | 36.8 | 74.5 | 42.3 |
| 87 | Milwaukee, WI | 25.8 | 53.3 | 36.5 | 77 | 42.1 |
| 88 | St. Louis, MO | 31.6 | 47 | 31.4 | 72 | 42.1 |
| 89 | Indianapolis, IN | 30 | 48.1 | 35 | 70.7 | 42 |
| 90 | Cleveland, OH | 28.5 | 49.4 | 35.5 | 73.5 | 41.8 |
| 91 | Myrtle Beach, SC | 28 | 51.9 | 34.4 | 71.1 | 40.8 |
| 92 | Houston, TX | 26.9 | 49.4 | 36.5 | 75.7 | 40.3 |
| 93 | Columbus, OH | 29.6 | 46.4 | 34.9 | 72.1 | 40.2 |
| 94 | Salisbury, MD | 28.2 | 49.8 | 35.3 | 71 | 40.1 |
| 95 | Philadelphia, PA | 30.5 | 47.1 | 31.5 | 71.7 | 39.8 |
| 96 | Lansing, MI | 26.1 | 52.8 | 34.6 | 74.5 | 39.5 |
| 97 | Kansas City, MO | 29.4 | 46.6 | 33 | 72.9 | 38.9 |
| 98 | Chattanooga, TN | 28.7 | 47.4 | 32.2 | 71.1 | 36.5 |
| 99 | Greenville, SC | 28.1 | 42.4 | 38.5 | 70.3 | 35.6 |
| 100 | Memphis, TN | 27.4 | 45.8 | 37.8 | 68.4 | 35.5 |
| 101 | Birmingham, AL | 27.9 | 47.7 | 31.3 | 72.2 | 34.9 |
| 102 | Little Rock, AR | 27.3 | 45.8 | 35.3 | 70.6 | 34.4 |
| 103 | Tuscaloosa, AL | 25.7 | 50.6 | 34.4 | 69.8 | 34.1 |
| 104 | Riverside, CA | 27.7 | 47.6 | 29 | 73.2 | 33 |
| 105 | Waterloo, IA | 27.6 | 45.2 | 32.7 | 71.8 | 33 |
| 106 | Charleston, WV | 27.1 | 49.5 | 27.8 | 72.5 | 32.1 |
| 107 | Sioux Falls, SD | 26 | 46.4 | 32.7 | 74.2 | 31.9 |
| 108 | Oklahoma City, OK | 29.7 | 39.5 | 32.4 | 70 | 31.2 |
| 109 | Hagerstown, MD | 26.6 | 48.2 | 29.7 | 71.6 | 31 |
| 110 | Toledo, OH | 26.8 | 44.7 | 33.6 | 69.5 | 30.4 |
| 111 | Lafayette, LA | 28 | 41.5 | 34.9 | 64.7 | 28.7 |
| 112 | Topeka, KS | 28.1 | 46.2 | 27.6 | 66.7 | 28.1 |
| 113 | Louisville, KY | 26.5 | 41 | 34.5 | 70.5 | 27.7 |
| 114 | Sioux City, IA | 27.2 | 41.7 | 33.5 | 67.5 | 27.5 |
| 115 | Corpus Christi, TX | 22.1 | 49.3 | 33.9 | 72.8 | 26.5 |
| 116 | Kingsport, TN | 27 | 42.9 | 32.3 | 65 | 25.9 |
| 117 | Wichita, KS | 24.5 | 45.7 | 30.1 | 72 | 24.8 |
| 118 | Baton Rouge, LA | 24.3 | 45.7 | 31.6 | 68.5 | 23.8 |
| 119 | Mobile, AL | 27.8 | 42.3 | 25.4 | 68.6 | 23.2 |
| 120 | Jackson, MS | 27.6 | 40.3 | 28.6 | 65 | 21.8 |
| 121 | Grand Island, NE | 21.9 | 47.8 | 33.8 | 66.8 | 21.6 |
| 122 | Beaumont, TX | 19.9 | 44.6 | 36.3 | 69 | 17.7 |
| 123 | Tulsa, OK | 25.9 | 37.8 | 27 | 66 | 15.2 |
| 124 | Huntington, WV | 23.6 | 42.8 | 24.8 | 69.4 | 14.7 |
Fittest States in America
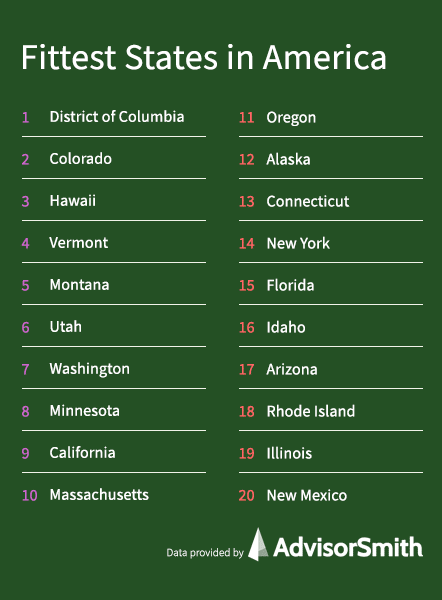
AdvisorSmith crunched the numbers to find the states where Americans are the fittest. Our analysis included 49 U.S. states and the District of Columbia. New Jersey was excluded because it did not report data for 2019. We found the fittest states by examining the percentage of normal weight people as measured by BMI, along with three other physical activity factors.
Among the 49 states and Washington, D.C., the average population with normal body weight was 31%. An average of 51% of residents had participated in 150 minutes or more of aerobic exercise, with 35% participating in muscle-building exercises at least twice a week. An average of 74% of residents had exercised at least once in the previous month.
| Rank | State | Normal Weight (BMI) % | Aerobic % | Strength % | Exercise % | Total Score |
|---|---|---|---|---|---|---|
| 1 | District of Columbia | 42.4 | 53.4 | 40.6 | 81 | 92.8 |
| 2 | Colorado | 38.9 | 58.4 | 39.3 | 81.3 | 85.2 |
| 3 | Hawaii | 38.7 | 54.8 | 37.9 | 75.6 | 77.4 |
| 4 | Vermont | 38.2 | 49.3 | 39.7 | 80 | 75.8 |
| 5 | Montana | 33.9 | 62.3 | 39.7 | 80.3 | 73.4 |
| 6 | Utah | 34.5 | 54.8 | 38.4 | 81.5 | 68.6 |
| 7 | Washington | 34.3 | 58.4 | 36.5 | 80.8 | 68.5 |
| 8 | Minnesota | 32.7 | 57.9 | 36.5 | 80.1 | 63.1 |
| 9 | California | 35.1 | 54.1 | 33.7 | 77.6 | 63 |
| 10 | Massachusetts | 38.2 | 44.9 | 33.2 | 73.6 | 62.3 |
| 11 | Oregon | 34 | 56.5 | 34.8 | 76.1 | 62 |
| 12 | Alaska | 32.2 | 56.7 | 37.6 | 78.3 | 60.9 |
| 13 | Connecticut | 32.7 | 53.4 | 39.4 | 76.5 | 60.7 |
| 14 | New York | 35.1 | 46.9 | 37.9 | 72.8 | 59.2 |
| 15 | Florida | 32.8 | 54.5 | 38.1 | 73.5 | 58.9 |
| 16 | Idaho | 34 | 56.8 | 31.2 | 76.2 | 58.5 |
| 17 | Arizona | 31.9 | 53.8 | 37.7 | 75.9 | 56.6 |
| 18 | Rhode Island | 33.9 | 49.9 | 36.1 | 73.5 | 56.5 |
| 19 | Illinois | 32.6 | 49.5 | 37.1 | 74.4 | 53.9 |
| 20 | New Mexico | 32.4 | 48 | 38.4 | 74.7 | 53.6 |
| 21 | Virginia | 32.2 | 49.3 | 35.8 | 74.7 | 51.4 |
| 22 | New Hampshire | 30.8 | 48 | 37.2 | 78.3 | 49.6 |
| 23 | Wisconsin | 28.6 | 58.4 | 36.2 | 76.8 | 49.4 |
| 24 | Maryland | 31.4 | 44.9 | 36.6 | 76.6 | 47.4 |
| 25 | Georgia | 30.6 | 48.3 | 38.2 | 72.1 | 47 |
| 26 | North Carolina | 28.6 | 62.3 | 31.9 | 73.7 | 46.3 |
| 27 | Maine | 32.5 | 51.5 | 30.6 | 69.9 | 46.1 |
| 28 | Iowa | 30.1 | 54.8 | 32.9 | 73.5 | 45.9 |
| 29 | North Dakota | 28.5 | 62.3 | 32 | 72 | 45.3 |
| 30 | Delaware | 29.4 | 51.1 | 37 | 73.4 | 45.1 |
| 31 | Pennsylvania | 29.8 | 49.9 | 33.7 | 74.5 | 42.5 |
| 32 | Nevada | 29.9 | 48.8 | 34.3 | 74.2 | 42.4 |
| 33 | Wyoming | 33.2 | 30.2 | 38 | 75.4 | 42.1 |
| 34 | Missouri | 30.3 | 57.9 | 27.8 | 69.4 | 41.4 |
| 35 | Texas | 28.4 | 48.5 | 37.8 | 72.8 | 40.6 |
| 36 | Nebraska | 29.5 | 48 | 34.8 | 73.1 | 40.5 |
| 37 | South Carolina | 28.7 | 46.9 | 38.2 | 71.2 | 39.9 |
| 38 | Michigan | 28 | 51.1 | 35.3 | 74.6 | 39.8 |
| 39 | Ohio | 29 | 48 | 34.7 | 71.7 | 38.2 |
| 40 | Arkansas | 27.8 | 56.7 | 32.2 | 68.8 | 37.4 |
| 41 | Tennessee | 28.6 | 46.8 | 35.5 | 69.9 | 36 |
| 42 | Indiana | 28.8 | 46.3 | 35.3 | 69.1 | 35.6 |
| 43 | Kansas | 28.1 | 48.3 | 33.4 | 72.9 | 35.1 |
| 44 | Alabama | 27.5 | 56.7 | 29.2 | 68.5 | 33.3 |
| 45 | South Dakota | 27.9 | 45.8 | 34.6 | 70 | 32.3 |
| 46 | Louisiana | 27.2 | 44.9 | 34.2 | 68.1 | 28.1 |
| 47 | West Virginia | 25.9 | 47.2 | 26.1 | 68.9 | 18.1 |
| 48 | Oklahoma | 26.3 | 37.3 | 28.7 | 66 | 12.8 |
| 49 | Kentucky | 26.4 | 35.3 | 27 | 67.2 | 10.4 |
| 50 | Mississippi | 25.4 | 38.5 | 29 | 62.3 | 9.5 |
Related Articles for Fitness Businesses
- Sports and Fitness Insurance
- Fitness Instructor Insurance
- Personal Trainer Insurance
- Yoga Instructor Insurance
Methodology
To find the fittest cities and states in America, AdvisorSmith used data from the Behavioral Risk Factor Surveillance System, which is a survey reporting the health status of Americans from states and cities around the country. For the state portion of the study, we examined data for all 49 states and the District of Columbia. The state of New Jersey, which did not report data for 2019, was excluded from this report. For the city portion of the study, we examined data from 124 metropolitan statistical areas and metropolitan divisions around the country.
Our study examined four primary factors to determine the fittest cities and states in the country. First, we considered the percentage of residents of each city or state that were classified as “Normal Weight” by Body Mass Index. We also took into consideration the percentage of residents who participated in at least 150 minutes of physical activity per week and the percentage of residents who participated in muscle-building exercises at least twice a week. Finally, we examined the percentage of residents who participated in any physical activity within the past month based upon survey responses.
For each of these variables, we assigned each city or state a score representing the geography’s performance on each measure. We then weighted the scores and added them to create a composite fitness score for each city and state. We then ranked the cities and states to find the fittest cities and states in America.
Sources
- United States Centers for Disease Control and Prevention, Behavioral Risk Factor Surveillance System, 2019