


With the coronavirus pandemic worsening in the United States, many governmental and health authorities have advised against traveling during the holidays to reduce the spread of the virus. In this analysis, AdvisorSmith examined anonymized data from mobile devices to determine the U.S. counties and states where residents took the most trips over the Thanksgiving holiday.

AdvisorSmith considered trips that were at least 100 miles or longer. We counted the average number of trips on a population-adjusted basis to find the U.S. counties where the most number of people traveled for the Thanksgiving holiday. All trips taken between November 20, 2020, and November 29, 2020, were included in our analysis. On average nationwide, there were 0.033 trips taken per person per day over Thanksgiving week.
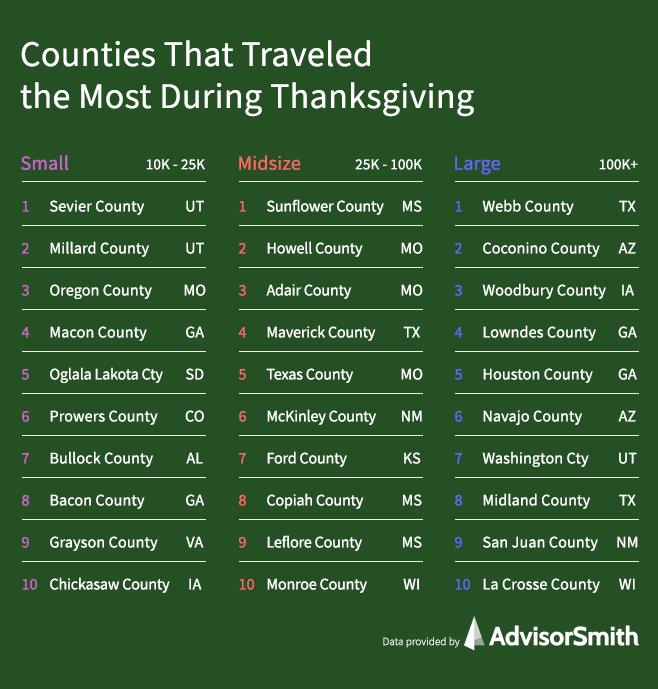
Large Counties With the Most Thanksgiving Travel
Among large counties with over 100,000 residents, the average number of trips per person per day taken over Thanksgiving week was 0.035. Texas had the most large counties with residents who took the most trips, with 7 of the top 50 counties, followed by Georgia with 6 counties, and California with 5 counties.
| Rank | County | State | Trips Per Capita |
|---|---|---|---|
| 1 | Webb County | TX | 0.101 |
| 2 | Coconino County | AZ | 0.086 |
| 3 | Woodbury County | IA | 0.083 |
| 4 | Lowndes County | GA | 0.083 |
| 5 | Houston County | GA | 0.076 |
| 6 | Navajo County | AZ | 0.075 |
| 7 | Washington County | UT | 0.073 |
| 8 | Midland County | TX | 0.072 |
| 9 | San Juan County | NM | 0.072 |
| 10 | La Crosse County | WI | 0.070 |
| 11 | Douglas County | GA | 0.069 |
| 12 | St. Lawrence County | NY | 0.069 |
| 13 | Shasta County | CA | 0.066 |
| 14 | Boone County | MO | 0.063 |
| 15 | Tom Green County | TX | 0.061 |
| 16 | Lexington County | SC | 0.061 |
| 17 | Clayton County | GA | 0.060 |
| 18 | Winnebago County | WI | 0.059 |
| 19 | Minnehaha County | SD | 0.059 |
| 20 | Imperial County | CA | 0.059 |
| 21 | Doña Ana County | NM | 0.059 |
| 22 | Deschutes County | OR | 0.058 |
| 23 | Lackawanna County | PA | 0.058 |
| 24 | Madera County | CA | 0.057 |
| 25 | Robeson County | NC | 0.057 |
| 26 | Brown County | WI | 0.056 |
| 27 | Yakima County | WA | 0.056 |
| 28 | Smith County | TX | 0.056 |
| 29 | Greene County | MO | 0.056 |
| 30 | Kern County | CA | 0.056 |
| 31 | Onondaga County | NY | 0.056 |
| 32 | Elkhart County | IN | 0.056 |
| 33 | Ector County | TX | 0.055 |
| 34 | DeSoto County | MS | 0.055 |
| 35 | Jefferson County | NY | 0.055 |
| 36 | Randall County | TX | 0.054 |
| 37 | Mohave County | AZ | 0.054 |
| 38 | Bibb County | GA | 0.054 |
| 39 | Hamilton County | TN | 0.054 |
| 40 | Cumberland County | PA | 0.053 |
| 41 | Blount County | TN | 0.052 |
| 42 | Shelby County | TN | 0.052 |
| 43 | Columbia County | GA | 0.052 |
| 44 | Oswego County | NY | 0.052 |
| 45 | El Paso County | TX | 0.051 |
| 46 | Pitt County | NC | 0.051 |
| 47 | Washington County | MD | 0.051 |
| 48 | Hanover County | VA | 0.051 |
| 49 | Lycoming County | PA | 0.051 |
| 50 | Fresno County | CA | 0.051 |
Midsize Counties With the Most Thanksgiving Travel
The average number of trips in midsize counties was 0.047 over Thanksgiving week. Wisconsin had the highest number of midsize counties whose residents traveled the most, with 7 of the top 50, followed by Georgia with 6, and, Missouri and New Mexico with 5 each.
| Rank | County | State | Trips Per Capita |
|---|---|---|---|
| 1 | Sunflower County | MS | 0.108 |
| 2 | Howell County | MO | 0.107 |
| 3 | Adair County | MO | 0.107 |
| 4 | Maverick County | TX | 0.107 |
| 5 | Texas County | MO | 0.101 |
| 6 | McKinley County | NM | 0.099 |
| 7 | Ford County | KS | 0.099 |
| 8 | Copiah County | MS | 0.097 |
| 9 | Leflore County | MS | 0.096 |
| 10 | Monroe County | WI | 0.096 |
| 11 | Lea County | NM | 0.095 |
| 12 | Chatham County | NC | 0.095 |
| 13 | Ellis County | KS | 0.094 |
| 14 | Sanpete County | UT | 0.093 |
| 15 | Lincoln County | WI | 0.093 |
| 16 | Amherst County | VA | 0.092 |
| 17 | Adams County | MS | 0.092 |
| 18 | Gladwin County | MI | 0.091 |
| 19 | Webster County | MO | 0.091 |
| 20 | Laurens County | GA | 0.091 |
| 21 | Curry County | NM | 0.090 |
| 22 | Baker County | FL | 0.087 |
| 23 | Otero County | NM | 0.087 |
| 24 | Jones County | GA | 0.086 |
| 25 | Iron County | UT | 0.085 |
| 26 | Douglas County | MN | 0.085 |
| 27 | Marlboro County | SC | 0.084 |
| 28 | Eddy County | NM | 0.083 |
| 29 | Buffalo County | NE | 0.082 |
| 30 | Coffee County | GA | 0.082 |
| 31 | Finney County | KS | 0.082 |
| 32 | Lyon County | MN | 0.082 |
| 33 | Sullivan County | NY | 0.081 |
| 34 | Lyon County | KS | 0.081 |
| 35 | Vernon County | WI | 0.081 |
| 36 | Elko County | NV | 0.081 |
| 37 | Dickinson County | MI | 0.080 |
| 38 | Tift County | GA | 0.080 |
| 39 | LaGrange County | IN | 0.080 |
| 40 | Oconto County | WI | 0.080 |
| 41 | Stone County | MO | 0.079 |
| 42 | Columbus County | NC | 0.079 |
| 43 | Glenn County | CA | 0.079 |
| 44 | Marinette County | WI | 0.079 |
| 45 | Harris County | GA | 0.078 |
| 46 | Perry County | KY | 0.078 |
| 47 | Laramie County | WY | 0.078 |
| 48 | Sumter County | GA | 0.078 |
| 49 | Calumet County | WI | 0.078 |
| 50 | Trempealeau County | WI | 0.078 |
Small Counties With the Most Thanksgiving Travel
In small counties with between 10,000 and 25,000 residents, the average number of trips per person per day over Thanksgiving week was 0.058. Minnesota led with the most small counties with residents who traveled the most, with 7 of the top 50, followed by Georgia with 6, and Missouri and Kentucky with 5 each.
| Rank | County | State | Trips Per Capita |
|---|---|---|---|
| 1 | Sevier County | UT | 0.197 |
| 2 | Millard County | UT | 0.174 |
| 3 | Oregon County | MO | 0.168 |
| 4 | Macon County | GA | 0.156 |
| 5 | Oglala Lakota County | SD | 0.152 |
| 6 | Prowers County | CO | 0.152 |
| 7 | Bullock County | AL | 0.146 |
| 8 | Bacon County | GA | 0.140 |
| 9 | Grayson County | VA | 0.136 |
| 10 | Chickasaw County | IA | 0.135 |
| 11 | Buckingham County | VA | 0.135 |
| 12 | Archuleta County | CO | 0.133 |
| 13 | Aitkin County | MN | 0.132 |
| 14 | Reeves County | TX | 0.131 |
| 15 | Adair County | KY | 0.128 |
| 16 | Charlton County | GA | 0.124 |
| 17 | Decatur County | TN | 0.121 |
| 18 | Morrow County | OR | 0.121 |
| 19 | Wayne County | MO | 0.118 |
| 20 | Cottonwood County | MN | 0.117 |
| 21 | Houston County | MN | 0.116 |
| 22 | Roosevelt County | NM | 0.116 |
| 23 | Wadena County | MN | 0.115 |
| 24 | Garrard County | KY | 0.114 |
| 25 | Pecos County | TX | 0.112 |
| 26 | Crisp County | GA | 0.112 |
| 27 | Casey County | KY | 0.112 |
| 28 | Holt County | NE | 0.111 |
| 29 | Todd County | SD | 0.111 |
| 30 | Pushmataha County | OK | 0.110 |
| 31 | Ripley County | MO | 0.109 |
| 32 | Dallas County | MO | 0.109 |
| 33 | Hale County | AL | 0.109 |
| 34 | Patrick County | VA | 0.109 |
| 35 | Rabun County | GA | 0.108 |
| 36 | Las Animas County | CO | 0.108 |
| 37 | Douglas County | MO | 0.108 |
| 38 | Russell County | KY | 0.108 |
| 39 | Alcona County | MI | 0.107 |
| 40 | Grant Parish | LA | 0.107 |
| 41 | Wilcox County | AL | 0.105 |
| 42 | Noxubee County | MS | 0.105 |
| 43 | Walthall County | MS | 0.104 |
| 44 | Cassia County | ID | 0.104 |
| 45 | Todd County | MN | 0.104 |
| 46 | Dimmit County | TX | 0.104 |
| 47 | Martin County | MN | 0.103 |
| 48 | Pope County | MN | 0.103 |
| 49 | Cook County | GA | 0.103 |
| 50 | Wayne County | KY | 0.102 |
States With the Most Thanksgiving Travel

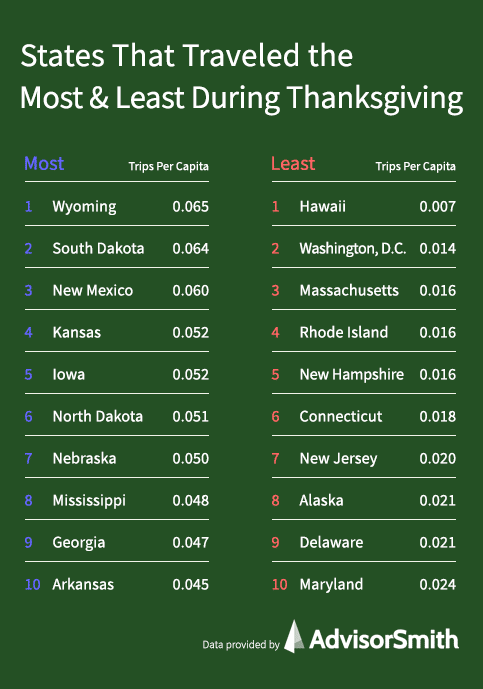
The amount of travel on a per capita basis in the states and the District of Columbia varied widely. Wyoming led the way with almost double the number of trips compared with the nationwide average, while residents of Hawaii had the least number of trips.
| Rank | State | Trips Per Capita |
|---|---|---|
| 1 | Wyoming | 0.065 |
| 2 | South Dakota | 0.064 |
| 3 | New Mexico | 0.060 |
| 4 | Kansas | 0.052 |
| 5 | Iowa | 0.052 |
| 6 | North Dakota | 0.051 |
| 7 | Nebraska | 0.050 |
| 8 | Mississippi | 0.048 |
| 9 | Georgia | 0.047 |
| 10 | Arkansas | 0.045 |
| 11 | Kentucky | 0.045 |
| 12 | Wisconsin | 0.044 |
| 13 | North Carolina | 0.044 |
| 14 | Missouri | 0.044 |
| 15 | Montana | 0.044 |
| 16 | Tennessee | 0.043 |
| 17 | Utah | 0.043 |
| 18 | South Carolina | 0.043 |
| 19 | Idaho | 0.042 |
| 20 | Oklahoma | 0.039 |
| 21 | Virginia | 0.039 |
| 22 | Minnesota | 0.039 |
| 23 | Louisiana | 0.039 |
| 24 | Alabama | 0.038 |
| 25 | Indiana | 0.038 |
| 26 | Michigan | 0.036 |
| 27 | Texas | 0.034 |
| 28 | West Virginia | 0.033 |
| 29 | Arizona | 0.033 |
| 30 | Colorado | 0.033 |
| 31 | Illinois | 0.033 |
| 32 | Nevada | 0.032 |
| 33 | Ohio | 0.031 |
| 34 | Maine | 0.031 |
| 35 | Pennsylvania | 0.030 |
| 36 | Florida | 0.029 |
| 37 | Oregon | 0.028 |
| 38 | California | 0.027 |
| 39 | Vermont | 0.026 |
| 40 | New York | 0.025 |
| 41 | Washington | 0.025 |
| 42 | Maryland | 0.024 |
| 43 | Delaware | 0.021 |
| 44 | Alaska | 0.021 |
| 45 | New Jersey | 0.020 |
| 46 | Connecticut | 0.018 |
| 47 | New Hampshire | 0.016 |
| 48 | Rhode Island | 0.016 |
| 49 | Massachusetts | 0.016 |
| 50 | Washington, D.C. | 0.014 |
| 51 | Hawaii | 0.007 |
Methodology
To determine the U.S. counties with the most travel over Thanksgiving, AdvisorSmith examined data published by the U.S. Department of Transportation, Bureau of Transportation Statistics. This data set included anonymized cell phone location data from multiple data sources that tracked the number of trips taken by county residents from over 3,000 U.S. counties. This data set counted a trip if a mobile device spent more than 10 minutes in a location away from home.
To find the counties with the most Thanksgiving travel, we counted the average number of trips over 100 miles that were taken by residents of each county on a per capita basis. Counties with the highest number of trips per capita were determined to have the highest number of trips over the Thanksgiving holiday. We considered all travel between the dates of November 20, 2020, and November 29, 2020, to be Thanksgiving travel.
Our analysis segmented counties into three categories based upon the population size of each county. Counties with between 10,000 and 25,000 residents were considered small counties. Counties with between 25,000 and 100,000 residents were midsize counties, and large counties were those with over 100,000 residents.
Sources
- U.S. Department of Transportation, Bureau of Transportation Statistics, Trips by Distance (Data Provided by Maryland Transportation Institute and Center for Advanced Transportation Technology Laboratory at the University of Maryland)