


The impacts and effects of the coronavirus (COVID-19) pandemic on the lives and economies of Americans has been widespread but not evenly distributed around the country. With varying levels of infection as well as differing levels of restrictions among states, cities, and municipalities, the effects on employment, business sales, and consumer demand has varied widely depending upon geography and the nature of local economies.
With the non-seasonally adjusted unemployment rate hitting a high of 14.4% in April 2020, and tens of millions of jobs being lost in February, March, and April, the economic impact of the pandemic has been unprecedented in American history. Additionally, many workers dropped out of the labor force, whether out of discouragement or in order to preserve their health or the health of those they live with.
In this study, AdvisorSmith took a detailed look at the unemployment situation in metropolitan areas (which we call cities) all around the country. We ranked 389 U.S. cities based upon the increases in their unemployment rates. We break down the top ten small, midsize, and large cities that saw the largest increases in unemployment. Additionally, we took a look at the top 10 small, midsize, and large cities that were least affected by coronavirus-driven unemployment.
This study was based upon data from the Local Area Unemployment Statistics published by the U.S. Bureau of Labor Statistics. The figures in the report are non-seasonally adjusted unemployment numbers, and we compared the unemployment rate in January 2020 before the pandemic to the rate in April 2020 with the most recent data available. See our conclusions below about the cities most and least affected by coronavirus unemployment.
Impact of Coronavirus on Unemployment in U.S. Cities
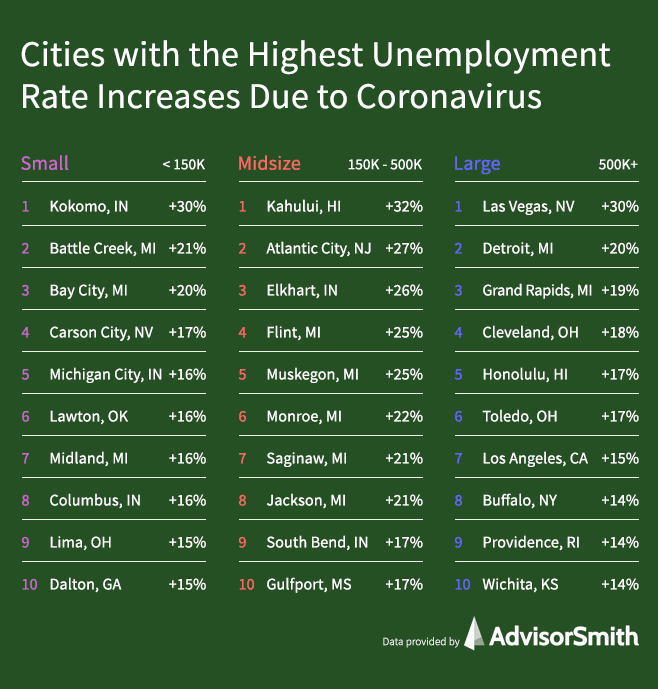
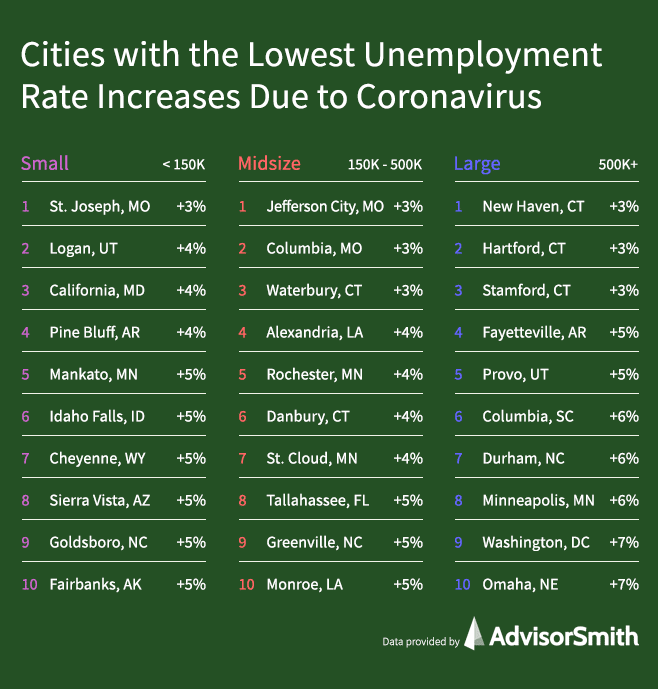
Cities most affected by coronavirus unemployment included tourist-driven economies in Hawaii, Las Vegas, and Atlantic City, along with automotive manufacturing cities in Michigan and Indiana. Cities in Connecticut and Missouri were among the least affected by coronavirus unemployment. Below we show the increases in unemployment rates across U.S. cities from January 2020 to April 2020.
Cities with the Highest Unemployment Rate Increases Due to Coronavirus
In the chart below, we examine the small (population under 150,000), midsize (population between 150,000 to 500,000), and large (population over 500,000) cities with the biggest unemployment impacts from coronavirus.

Cities Least Affected by Coronavirus Unemployment
The data below shows the small, midsize, and large cities least affected economically by the coronavirus pandemic as measured by the change in unemployment.
Ranking of Cities with the Most Unemployment Due to Coronavirus
In the following table, we rank 389 U.S. cities based upon the increase in unemployment that they have experienced during the period January 2020 through April 2020, which was when the coronavirus epidemic began to impact the U.S. economy. We show the unemployment rate at the beginning and the end of the period, as well as the increase in percentage points of unemployment in each of the cities.
| Rank | City | State | Unemployment Rate (Jan 2020) | Unemployment Rate (Apr 2020) | Change in Unemployment Rate |
|---|---|---|---|---|---|
| 1 | Kahului | HI | 2.8% | 35.0% | +32.2% |
| 2 | Kokomo | IN | 4.2% | 34.1% | +29.9% |
| 3 | Las Vegas | NV | 3.9% | 33.5% | +29.6% |
| 4 | Atlantic City | NJ | 6.8% | 33.3% | +26.5% |
| 5 | Elkhart | IN | 3.0% | 29.3% | +26.3% |
| 6 | Flint | MI | 5.0% | 30.1% | +25.1% |
| 7 | Muskegon | MI | 4.4% | 29.3% | +24.9% |
| 8 | Monroe | MI | 4.3% | 25.8% | +21.5% |
| 9 | Saginaw | MI | 5.1% | 25.6% | +20.5% |
| 10 | Battle Creek | MI | 4.1% | 24.6% | +20.5% |
| 11 | Jackson | MI | 3.9% | 24.4% | +20.5% |
| 12 | Detroit | MI | 4.4% | 24.4% | +20% |
| 13 | Bay City | MI | 5.5% | 25.3% | +19.8% |
| 14 | Grand Rapids | MI | 2.9% | 21.8% | +18.9% |
| 15 | Cleveland | OH | 4.7% | 23.1% | +18.4% |
| 16 | Carson City | NV | 4.1% | 21.4% | +17.3% |
| 17 | Honolulu | HI | 2.8% | 20.0% | +17.2% |
| 18 | South Bend | IN | 4.1% | 21.1% | +17% |
| 19 | Gulfport | MS | 5.4% | 22.1% | +16.7% |
| 20 | Toledo | OH | 5.4% | 22.0% | +16.6% |
| 21 | Myrtle Beach | SC | 4.8% | 21.4% | +16.6% |
| 22 | New Bedford | MA | 5.4% | 21.9% | +16.5% |
| 23 | Reno | NV | 3.4% | 19.6% | +16.2% |
| 24 | Fort Wayne | IN | 3.4% | 19.6% | +16.2% |
| 25 | Lansing | MI | 3.2% | 19.1% | +15.9% |
| 26 | Michigan City | IN | 4.8% | 20.6% | +15.8% |
| 27 | Lawton | OK | 3.2% | 19.0% | +15.8% |
| 28 | Midland | MI | 4.3% | 20.0% | +15.7% |
| 29 | Barnstable Town | MA | 5.5% | 21.1% | +15.6% |
| 30 | Columbus | IN | 2.8% | 18.4% | +15.6% |
| 31 | Niles | MI | 4.5% | 20.0% | +15.5% |
| 32 | Lima | OH | 5.3% | 20.6% | +15.3% |
| 33 | Dalton | GA | 5.6% | 20.5% | +14.9% |
| 34 | Los Angeles | CA | 4.1% | 18.8% | +14.7% |
| 35 | Manchester | NH | 2.8% | 17.4% | +14.6% |
| 36 | Anniston | AL | 3.8% | 18.4% | +14.6% |
| 37 | Gadsden | AL | 4.2% | 18.8% | +14.6% |
| 38 | Mansfield | OH | 5.8% | 20.3% | +14.5% |
| 39 | East Stroudsburg | PA | 6.3% | 20.8% | +14.5% |
| 40 | Kalamazoo | MI | 3.6% | 18.0% | +14.4% |
| 41 | Rockford | IL | 8.0% | 22.4% | +14.4% |
| 42 | Buffalo | NY | 5.1% | 19.2% | +14.1% |
| 43 | Providence | RI | 4.1% | 18.2% | +14.1% |
| 44 | Tuscaloosa | AL | 2.9% | 16.9% | +14% |
| 45 | Wichita | KS | 3.8% | 17.8% | +14% |
| 46 | Bend | OR | 4.2% | 18.2% | +14% |
| 47 | Hickory | NC | 3.8% | 17.6% | +13.8% |
| 48 | Chicago | IL | 3.8% | 17.5% | +13.7% |
| 49 | New Orleans | LA | 5.2% | 18.8% | +13.6% |
| 50 | Pittsfield | MA | 4.5% | 17.9% | +13.4% |
| 51 | Seattle | WA | 3.3% | 16.7% | +13.4% |
| 52 | Carbondale | IL | 3.9% | 17.1% | +13.2% |
| 53 | Orlando | FL | 3.0% | 16.2% | +13.2% |
| 54 | Bowling Green | KY | 4.5% | 17.7% | +13.2% |
| 55 | Leominster | MA | 4.1% | 17.2% | +13.1% |
| 56 | Elizabethtown | KY | 4.7% | 17.8% | +13.1% |
| 57 | Ocean City | NJ | 13.6% | 26.6% | +13% |
| 58 | Mount Vernon | WA | 6.2% | 19.1% | +12.9% |
| 59 | Youngstown | OH | 6.9% | 19.8% | +12.9% |
| 60 | Peoria | IL | 5.0% | 17.8% | +12.8% |
| 61 | Charleston | WV | 5.2% | 18.0% | +12.8% |
| 62 | Dover | NH | 2.8% | 15.5% | +12.7% |
| 63 | Louisville | KY | 3.9% | 16.6% | +12.7% |
| 64 | Asheville | NC | 3.4% | 16.0% | +12.6% |
| 65 | Beckley | WV | 5.8% | 18.4% | +12.6% |
| 66 | Fond du Lac | WI | 3.7% | 16.3% | +12.6% |
| 67 | Daphne | AL | 3.1% | 15.7% | +12.6% |
| 68 | Spartanburg | SC | 2.7% | 15.2% | +12.5% |
| 69 | Napa | CA | 3.5% | 15.9% | +12.4% |
| 70 | Lake Havasu City | AZ | 5.9% | 18.3% | +12.4% |
| 71 | Nashville | TN | 2.8% | 15.2% | +12.4% |
| 72 | Boston | MA | 3.0% | 15.4% | +12.4% |
| 73 | Ann Arbor | MI | 2.5% | 14.9% | +12.4% |
| 74 | Portsmouth | NH | 2.8% | 15.1% | +12.3% |
| 75 | Coeur d'Alene | ID | 4.7% | 17.0% | +12.3% |
| 76 | Burlington | VT | 2.2% | 14.5% | +12.3% |
| 77 | Danville | IL | 4.9% | 17.2% | +12.3% |
| 78 | Santa Rosa | CA | 2.9% | 15.2% | +12.3% |
| 79 | Muncie | IN | 4.2% | 16.5% | +12.3% |
| 80 | Reading | PA | 5.0% | 17.2% | +12.2% |
| 81 | Brunswick | GA | 3.5% | 15.7% | +12.2% |
| 82 | Eugene | OR | 3.9% | 16.1% | +12.2% |
| 83 | Beaumont | TX | 6.0% | 18.1% | +12.1% |
| 84 | Savannah | GA | 3.3% | 15.3% | +12% |
| 85 | Punta Gorda | FL | 3.6% | 15.6% | +12% |
| 86 | Terre Haute | IN | 4.6% | 16.5% | +11.9% |
| 87 | Oklahoma City | OK | 2.9% | 14.8% | +11.9% |
| 88 | Altoona | PA | 5.4% | 17.3% | +11.9% |
| 89 | Janesville | WI | 5.2% | 17.0% | +11.8% |
| 90 | Tulsa | OK | 3.2% | 15.0% | +11.8% |
| 91 | San Diego | CA | 3.3% | 15.0% | +11.7% |
| 92 | Morristown | TN | 4.6% | 16.3% | +11.7% |
| 93 | Springfield | OH | 5.7% | 17.4% | +11.7% |
| 94 | Bellingham | WA | 5.5% | 17.2% | +11.7% |
| 95 | Florence | AL | 3.7% | 15.3% | +11.6% |
| 96 | Sheboygan | WI | 3.4% | 15.0% | +11.6% |
| 97 | Medford | OR | 4.5% | 16.1% | +11.6% |
| 98 | Weirton | WV | 6.7% | 18.3% | +11.6% |
| 99 | Stockton | CA | 6.7% | 18.3% | +11.6% |
| 100 | Scranton | PA | 6.3% | 17.8% | +11.5% |
| 101 | Fort Myers | FL | 3.1% | 14.6% | +11.5% |
| 102 | Clarksville | TN | 4.6% | 16.0% | +11.4% |
| 103 | Syracuse | NY | 4.9% | 16.3% | +11.4% |
| 104 | Santa Cruz | CA | 6.1% | 17.4% | +11.3% |
| 105 | Albany | OR | 4.3% | 15.6% | +11.3% |
| 106 | Evansville | IN | 3.4% | 14.7% | +11.3% |
| 107 | Dover | DE | 4.5% | 15.8% | +11.3% |
| 108 | New York | NY | 3.9% | 15.1% | +11.2% |
| 109 | Dayton | OH | 4.7% | 15.9% | +11.2% |
| 110 | Hot Springs | AR | 4.1% | 15.3% | +11.2% |
| 111 | Lexington | KY | 3.7% | 14.8% | +11.1% |
| 112 | Decatur | IL | 5.1% | 16.2% | +11.1% |
| 113 | Corpus Christi | TX | 4.8% | 15.9% | +11.1% |
| 114 | Sarasota | FL | 3.1% | 14.2% | +11.1% |
| 115 | Pittsburgh | PA | 5.2% | 16.3% | +11.1% |
| 116 | Mobile | AL | 4.0% | 15.1% | +11.1% |
| 117 | Daytona Beach | FL | 3.6% | 14.7% | +11.1% |
| 118 | Huntington | WV | 5.7% | 16.7% | +11% |
| 119 | Allentown | PA | 5.0% | 16.0% | +11% |
| 120 | Williamsport | PA | 6.0% | 17.0% | +11% |
| 121 | Vallejo | CA | 4.0% | 14.9% | +10.9% |
| 122 | Johnstown | PA | 6.5% | 17.4% | +10.9% |
| 123 | Erie | PA | 5.8% | 16.7% | +10.9% |
| 124 | Homosassa Springs | FL | 4.9% | 15.8% | +10.9% |
| 125 | Elmira | NY | 5.0% | 15.9% | +10.9% |
| 126 | Brownsville | TX | 6.3% | 17.1% | +10.8% |
| 127 | El Paso | TX | 4.0% | 14.8% | +10.8% |
| 128 | Gettysburg | PA | 3.9% | 14.7% | +10.8% |
| 129 | Parkersburg | WV | 6.0% | 16.8% | +10.8% |
| 130 | Wilmington | NC | 3.8% | 14.6% | +10.8% |
| 131 | Montgomery | AL | 3.2% | 14.0% | +10.8% |
| 132 | Miami | FL | 2.4% | 13.2% | +10.8% |
| 133 | Springfield | MA | 4.1% | 14.8% | +10.7% |
| 134 | Oshkosh | WI | 3.5% | 14.2% | +10.7% |
| 135 | Crestview | FL | 2.9% | 13.6% | +10.7% |
| 136 | Lancaster | PA | 4.0% | 14.7% | +10.7% |
| 137 | Akron | OH | 5.3% | 16.0% | +10.7% |
| 138 | Greensboro | NC | 4.3% | 15.0% | +10.7% |
| 139 | Worcester | MA | 3.7% | 14.4% | +10.7% |
| 140 | Flagstaff | AZ | 6.3% | 16.9% | +10.6% |
| 141 | Portland | OR | 3.4% | 14.0% | +10.6% |
| 142 | San Luis Obispo | CA | 3.1% | 13.7% | +10.6% |
| 143 | McAllen | TX | 7.6% | 18.2% | +10.6% |
| 144 | Davenport | IA | 4.7% | 15.2% | +10.5% |
| 145 | York | PA | 4.4% | 14.9% | +10.5% |
| 146 | Redding | CA | 5.4% | 15.9% | +10.5% |
| 147 | Hammond | LA | 6.6% | 17.1% | +10.5% |
| 148 | Kankakee | IL | 5.4% | 15.9% | +10.5% |
| 149 | Salinas | CA | 9.7% | 20.2% | +10.5% |
| 150 | Milwaukee | WI | 4.0% | 14.5% | +10.5% |
| 151 | San Francisco | CA | 2.7% | 13.2% | +10.5% |
| 152 | Canton | OH | 5.9% | 16.3% | +10.4% |
| 153 | Kingston | NY | 4.2% | 14.6% | +10.4% |
| 154 | Naples | FL | 3.0% | 13.4% | +10.4% |
| 155 | Vero Beach | FL | 3.7% | 14.1% | +10.4% |
| 156 | Racine | WI | 5.1% | 15.5% | +10.4% |
| 157 | Modesto | CA | 6.6% | 17.0% | +10.4% |
| 158 | Sacramento | CA | 3.9% | 14.2% | +10.3% |
| 159 | Victoria | TX | 3.9% | 14.2% | +10.3% |
| 160 | Wheeling | WV | 7.2% | 17.5% | +10.3% |
| 161 | Salisbury | MD | 5.8% | 16.1% | +10.3% |
| 162 | Riverside | CA | 4.1% | 14.4% | +10.3% |
| 163 | Springfield | IL | 3.9% | 14.2% | +10.3% |
| 164 | Glens Falls | NY | 5.5% | 15.7% | +10.2% |
| 165 | Grants Pass | OR | 5.3% | 15.5% | +10.2% |
| 166 | Rochester | NY | 4.7% | 14.9% | +10.2% |
| 167 | Indianapolis | IN | 3.2% | 13.3% | +10.1% |
| 168 | Ventura | CA | 3.9% | 14.0% | +10.1% |
| 169 | Houston | TX | 4.1% | 14.2% | +10.1% |
| 170 | Olympia | WA | 4.8% | 14.9% | +10.1% |
| 171 | Odessa | TX | 3.4% | 13.5% | +10.1% |
| 172 | Spokane | WA | 5.8% | 15.8% | +10% |
| 173 | Bakersfield | CA | 8.6% | 18.6% | +10% |
| 174 | San Antonio | TX | 3.2% | 13.2% | +10% |
| 175 | Tampa | FL | 3.1% | 13.1% | +10% |
| 176 | Knoxville | TN | 3.5% | 13.5% | +10% |
| 177 | Appleton | WI | 3.6% | 13.6% | +10% |
| 178 | El Centro | CA | 18.0% | 28.0% | +10% |
| 179 | Port St. Lucie | FL | 3.6% | 13.5% | +9.9% |
| 180 | Philadelphia | PA | 4.6% | 14.5% | +9.9% |
| 181 | Utica | NY | 5.2% | 15.1% | +9.9% |
| 182 | Rapid City | SD | 3.9% | 13.8% | +9.9% |
| 183 | Owensboro | KY | 4.4% | 14.2% | +9.8% |
| 184 | Green Bay | WI | 4.0% | 13.8% | +9.8% |
| 185 | Cincinnati | OH | 4.3% | 14.1% | +9.8% |
| 186 | Jackson | TN | 3.8% | 13.6% | +9.8% |
| 187 | Longview | WA | 5.9% | 15.7% | +9.8% |
| 188 | Bremerton | WA | 4.4% | 14.1% | +9.7% |
| 189 | Greenville | SC | 2.6% | 12.3% | +9.7% |
| 190 | Melbourne | FL | 3.2% | 12.9% | +9.7% |
| 191 | Lakeland | FL | 3.7% | 13.4% | +9.7% |
| 192 | Charleston | SC | 2.4% | 12.1% | +9.7% |
| 193 | Chattanooga | TN | 3.6% | 13.3% | +9.7% |
| 194 | Cleveland | TN | 3.8% | 13.5% | +9.7% |
| 195 | Rome | GA | 3.9% | 13.5% | +9.6% |
| 196 | Auburn | AL | 2.9% | 12.4% | +9.5% |
| 197 | Atlanta | GA | 3.2% | 12.7% | +9.5% |
| 198 | Laredo | TX | 4.1% | 13.6% | +9.5% |
| 199 | Dallas | TX | 3.3% | 12.8% | +9.5% |
| 200 | Kingsport | TN | 4.2% | 13.7% | +9.5% |
| 201 | Columbus | OH | 4.2% | 13.7% | +9.5% |
| 202 | Denver | CO | 2.7% | 12.1% | +9.4% |
| 203 | Austin | TX | 2.8% | 12.2% | +9.4% |
| 204 | Bloomington | IL | 3.4% | 12.8% | +9.4% |
| 205 | Texarkana | TX | 4.4% | 13.8% | +9.4% |
| 206 | Yuma | AZ | 13.7% | 23.1% | +9.4% |
| 207 | Binghamton | NY | 5.6% | 15.0% | +9.4% |
| 208 | Watertown | NY | 7.5% | 16.9% | +9.4% |
| 209 | Lebanon | PA | 4.5% | 13.8% | +9.3% |
| 210 | Prescott | AZ | 4.5% | 13.8% | +9.3% |
| 211 | San Jose | CA | 2.7% | 12.0% | +9.3% |
| 212 | Chico | CA | 5.6% | 14.9% | +9.3% |
| 213 | New London | CT | 4.5% | 13.7% | +9.2% |
| 214 | Fayetteville | NC | 5.4% | 14.6% | +9.2% |
| 215 | Harrisburg | PA | 4.2% | 13.4% | +9.2% |
| 216 | Salem | OR | 4.1% | 13.3% | +9.2% |
| 217 | Lafayette | IN | 3.1% | 12.3% | +9.2% |
| 218 | Lake Charles | LA | 5.3% | 14.5% | +9.2% |
| 219 | Jackson | MS | 4.6% | 13.8% | +9.2% |
| 220 | Boise City | ID | 3.2% | 12.3% | +9.1% |
| 221 | Santa Maria | CA | 4.7% | 13.7% | +9% |
| 222 | Colorado Springs | CO | 3.3% | 12.3% | +9% |
| 223 | Panama City | FL | 3.6% | 12.6% | +9% |
| 224 | Yuba City | CA | 8.1% | 17.1% | +9% |
| 225 | Charlotte | NC | 3.7% | 12.7% | +9% |
| 226 | Missoula | MT | 4.1% | 13.1% | +9% |
| 227 | Birmingham | AL | 2.9% | 11.9% | +9% |
| 228 | Merced | CA | 9.8% | 18.8% | +9% |
| 229 | St. George | UT | 3.4% | 12.3% | +8.9% |
| 230 | Johnson City | TN | 4.3% | 13.2% | +8.9% |
| 231 | Vineland | NJ | 7.3% | 16.2% | +8.9% |
| 232 | Hilton Head Island | SC | 2.6% | 11.5% | +8.9% |
| 233 | Eau Claire | WI | 4.6% | 13.4% | +8.8% |
| 234 | Winston-Salem | NC | 3.9% | 12.7% | +8.8% |
| 235 | Pensacola | FL | 3.2% | 12.0% | +8.8% |
| 236 | Burlington | NC | 3.9% | 12.7% | +8.8% |
| 237 | Wenatchee | WA | 6.3% | 15.1% | +8.8% |
| 238 | Virginia Beach | VA | 3.3% | 12.1% | +8.8% |
| 239 | Madison | WI | 3.1% | 11.8% | +8.7% |
| 240 | Wausau | WI | 3.6% | 12.3% | +8.7% |
| 241 | Dubuque | IA | 4.1% | 12.7% | +8.6% |
| 242 | Fresno | CA | 8.1% | 16.7% | +8.6% |
| 243 | Chambersburg | PA | 4.4% | 13.0% | +8.6% |
| 244 | Tyler | TX | 3.6% | 12.2% | +8.6% |
| 245 | Anchorage | AK | 5.7% | 14.3% | +8.6% |
| 246 | Salt Lake City | UT | 2.6% | 11.2% | +8.6% |
| 247 | Madera | CA | 8.1% | 16.6% | +8.5% |
| 248 | Decatur | AL | 2.9% | 11.4% | +8.5% |
| 249 | Grand Junction | CO | 4.1% | 12.6% | +8.5% |
| 250 | Fort Collins | CO | 2.5% | 11.0% | +8.5% |
| 251 | Morgantown | WV | 3.9% | 12.4% | +8.5% |
| 252 | Albany | NY | 4.0% | 12.5% | +8.5% |
| 253 | Cedar Rapids | IA | 3.8% | 12.2% | +8.4% |
| 254 | Hagerstown | MD | 3.7% | 12.1% | +8.4% |
| 255 | Bloomsburg | PA | 5.8% | 14.2% | +8.4% |
| 256 | Cumberland | MD | 5.6% | 14.0% | +8.4% |
| 257 | Memphis | TN | 4.4% | 12.7% | +8.3% |
| 258 | La Crosse | WI | 3.8% | 12.1% | +8.3% |
| 259 | Phoenix | AZ | 4.0% | 12.3% | +8.3% |
| 260 | Santa Fe | NM | 4.0% | 12.3% | +8.3% |
| 261 | Columbus | GA | 4.0% | 12.2% | +8.2% |
| 262 | Blacksburg | VA | 3.3% | 11.5% | +8.2% |
| 263 | Enid | OK | 3.2% | 11.4% | +8.2% |
| 264 | Ocala | FL | 3.9% | 12.1% | +8.2% |
| 265 | Richmond | VA | 3.1% | 11.3% | +8.2% |
| 266 | Jacksonville | FL | 3.1% | 11.2% | +8.1% |
| 267 | Athens | GA | 3.2% | 11.3% | +8.1% |
| 268 | Tucson | AZ | 4.5% | 12.6% | +8.1% |
| 269 | Casper | WY | 4.7% | 12.7% | +8% |
| 270 | Des Moines | IA | 3.5% | 11.5% | +8% |
| 271 | Portland | ME | 3.1% | 11.1% | +8% |
| 272 | Longview | TX | 4.3% | 12.3% | +8% |
| 273 | Topeka | KS | 3.7% | 11.7% | +8% |
| 274 | Wichita Falls | TX | 3.3% | 11.3% | +8% |
| 275 | Duluth | MN | 4.8% | 12.8% | +8% |
| 276 | Lawrence | KS | 3.2% | 11.2% | +8% |
| 277 | Visalia | CA | 11.0% | 19.0% | +8% |
| 278 | Huntsville | AL | 2.7% | 10.6% | +7.9% |
| 279 | Baton Rouge | LA | 5.1% | 13.0% | +7.9% |
| 280 | Great Falls | MT | 4.2% | 12.1% | +7.9% |
| 281 | Albuquerque | NM | 4.6% | 12.4% | +7.8% |
| 282 | Gainesville | GA | 2.8% | 10.6% | +7.8% |
| 283 | Midland | TX | 2.4% | 10.2% | +7.8% |
| 284 | Fort Smith | AR | 4.1% | 11.9% | +7.8% |
| 285 | The Villages | FL | 4.6% | 12.3% | +7.7% |
| 286 | Corvallis | OR | 2.6% | 10.2% | +7.6% |
| 287 | Roanoke | VA | 3.1% | 10.7% | +7.6% |
| 288 | Sumter | SC | 3.5% | 11.1% | +7.6% |
| 289 | Raleigh | NC | 3.5% | 11.0% | +7.5% |
| 290 | Kansas City | MO | 3.7% | 11.2% | +7.5% |
| 291 | Champaign | IL | 3.4% | 10.9% | +7.5% |
| 292 | Pueblo | CO | 4.2% | 11.7% | +7.5% |
| 293 | Killeen | TX | 3.8% | 11.3% | +7.5% |
| 294 | Lafayette | LA | 5.7% | 13.1% | +7.4% |
| 295 | San Angelo | TX | 3.2% | 10.6% | +7.4% |
| 296 | Hanford | CA | 9.4% | 16.8% | +7.4% |
| 297 | Rocky Mount | NC | 5.2% | 12.6% | +7.4% |
| 298 | Harrisonburg | VA | 2.8% | 10.2% | +7.4% |
| 299 | Sherman | TX | 3.3% | 10.6% | +7.3% |
| 300 | Boulder | CO | 2.4% | 9.7% | +7.3% |
| 301 | Billings | MT | 3.9% | 11.1% | +7.2% |
| 302 | Waco | TX | 3.4% | 10.6% | +7.2% |
| 303 | Little Rock | AR | 3.7% | 10.9% | +7.2% |
| 304 | Sioux Falls | SD | 3.4% | 10.6% | +7.2% |
| 305 | Farmington | NM | 6.2% | 13.3% | +7.1% |
| 306 | Greeley | CO | 2.7% | 9.8% | +7.1% |
| 307 | Lewiston | ME | 3.6% | 10.7% | +7.1% |
| 308 | Lewiston | ID | 3.8% | 10.9% | +7.1% |
| 309 | Dothan | AL | 3.2% | 10.3% | +7.1% |
| 310 | Jacksonville | NC | 4.7% | 11.8% | +7.1% |
| 311 | Lynchburg | VA | 3.5% | 10.6% | +7.1% |
| 312 | Winchester | VA | 2.9% | 9.9% | +7% |
| 313 | Lubbock | TX | 2.9% | 9.9% | +7% |
| 314 | Ogden | UT | 2.7% | 9.7% | +7% |
| 315 | Albany | GA | 4.3% | 11.3% | +7% |
| 316 | St. Louis | MO | 4.0% | 11.0% | +7% |
| 317 | Shreveport | LA | 6.0% | 13.0% | +7% |
| 318 | Twin Falls | ID | 3.5% | 10.5% | +7% |
| 319 | Waterloo | IA | 4.2% | 11.2% | +7% |
| 320 | Macon | GA | 3.7% | 10.7% | +7% |
| 321 | Hattiesburg | MS | 4.7% | 11.6% | +6.9% |
| 322 | Sebring | FL | 4.5% | 11.4% | +6.9% |
| 323 | Augusta | GA | 3.7% | 10.6% | +6.9% |
| 324 | Houma | LA | 5.4% | 12.3% | +6.9% |
| 325 | Charlottesville | VA | 2.7% | 9.6% | +6.9% |
| 326 | Baltimore | MD | 3.5% | 10.4% | +6.9% |
| 327 | Warner Robins | GA | 3.4% | 10.2% | +6.8% |
| 328 | Omaha | NE | 3.2% | 10.0% | +6.8% |
| 329 | Staunton | VA | 2.7% | 9.5% | +6.8% |
| 330 | Bloomington | IN | 3.6% | 10.4% | +6.8% |
| 331 | Iowa City | IA | 2.6% | 9.4% | +6.8% |
| 332 | Washington | DC | 3.1% | 9.9% | +6.8% |
| 333 | Lincoln | NE | 2.7% | 9.3% | +6.6% |
| 334 | Trenton | NJ | 3.9% | 10.5% | +6.6% |
| 335 | Pocatello | ID | 3.4% | 9.9% | +6.5% |
| 336 | Bismarck | ND | 3.1% | 9.5% | +6.4% |
| 337 | Kennewick | WA | 6.3% | 12.7% | +6.4% |
| 338 | Joplin | MO | 3.8% | 10.1% | +6.3% |
| 339 | Ithaca | NY | 3.8% | 10.1% | +6.3% |
| 340 | Bangor | ME | 4.0% | 10.3% | +6.3% |
| 341 | Valdosta | GA | 3.7% | 9.9% | +6.2% |
| 342 | Ames | IA | 2.2% | 8.4% | +6.2% |
| 343 | Amarillo | TX | 2.7% | 8.8% | +6.1% |
| 344 | Minneapolis | MN | 3.1% | 9.2% | +6.1% |
| 345 | Grand Island | NE | 5.0% | 11.0% | +6% |
| 346 | Florence | SC | 3.1% | 9.1% | +6% |
| 347 | College Station | TX | 2.9% | 8.9% | +6% |
| 348 | Durham | NC | 3.5% | 9.5% | +6% |
| 349 | Sioux City | IA | 3.6% | 9.6% | +6% |
| 350 | New Bern | NC | 4.1% | 10.1% | +6% |
| 351 | Gainesville | FL | 3.0% | 8.9% | +5.9% |
| 352 | State College | PA | 3.8% | 9.7% | +5.9% |
| 353 | Columbia | SC | 2.7% | 8.6% | +5.9% |
| 354 | Cape Girardeau | MO | 3.8% | 9.7% | +5.9% |
| 355 | Hinesville | GA | 3.7% | 9.6% | +5.9% |
| 356 | Abilene | TX | 3.1% | 8.9% | +5.8% |
| 357 | Grand Forks | ND | 2.9% | 8.6% | +5.7% |
| 358 | Jonesboro | AR | 3.4% | 9.0% | +5.6% |
| 359 | Walla Walla | WA | 5.4% | 11.0% | +5.6% |
| 360 | Fargo | ND | 2.8% | 8.3% | +5.5% |
| 361 | Yakima | WA | 8.4% | 13.9% | +5.5% |
| 362 | Las Cruces | NM | 6.1% | 11.6% | +5.5% |
| 363 | Manhattan | KS | 3.0% | 8.4% | +5.4% |
| 364 | Springfield | MO | 3.8% | 9.1% | +5.3% |
| 365 | Fairbanks | AK | 5.9% | 11.2% | +5.3% |
| 366 | Provo | UT | 2.5% | 7.8% | +5.3% |
| 367 | Goldsboro | NC | 4.3% | 9.6% | +5.3% |
| 368 | Monroe | LA | 6.4% | 11.6% | +5.2% |
| 369 | Greenville | NC | 4.3% | 9.5% | +5.2% |
| 370 | Fayetteville | AR | 2.9% | 8.0% | +5.1% |
| 371 | Sierra Vista | AZ | 5.8% | 10.8% | +5% |
| 372 | Cheyenne | WY | 4.0% | 8.9% | +4.9% |
| 373 | Tallahassee | FL | 3.2% | 8.1% | +4.9% |
| 374 | Idaho Falls | ID | 3.0% | 7.8% | +4.8% |
| 375 | Mankato | MN | 2.8% | 7.4% | +4.6% |
| 376 | Pine Bluff | AR | 6.1% | 10.3% | +4.2% |
| 377 | California | MD | 3.2% | 7.3% | +4.1% |
| 378 | St. Cloud | MN | 4.2% | 8.2% | +4% |
| 379 | Logan | UT | 2.3% | 6.2% | +3.9% |
| 380 | Danbury | CT | 4.0% | 7.8% | +3.8% |
| 381 | Rochester | MN | 3.1% | 6.9% | +3.8% |
| 382 | Alexandria | LA | 6.2% | 9.9% | +3.7% |
| 383 | Waterbury | CT | 5.5% | 8.9% | +3.4% |
| 384 | Stamford | CT | 4.5% | 7.9% | +3.4% |
| 385 | Columbia | MO | 3.2% | 6.5% | +3.3% |
| 386 | St. Joseph | MO | 3.9% | 7.1% | +3.2% |
| 387 | Hartford | CT | 4.4% | 7.5% | +3.1% |
| 388 | New Haven | CT | 4.2% | 7.2% | +3% |
| 389 | Jefferson City | MO | 3.6% | 6.5% | +2.9% |
Methodology
Rankings in this study were produced using data from the Local Area Unemployment Statistics published by the U.S. Bureau of Labor Statistics. This data set provides information about unemployment rates for 389 U.S. metropolitan areas, which we call “cities.” The unemployment rates published for cities are non-seasonally adjusted numbers.
We compared the unemployment rate in January 2020 to the unemployment rate in April 2020, as this is the relevant period of time when the coronavirus pandemic had an impact on the U.S. economy, and the most recent date where city-level unemployment data is available.
We ranked all 389 cities based upon the change in percentage points in their unemployment rate during the study period. Additionally, we segmented the cities into three groups based on city size: small (population under 150,000), midsize (population 150,000 to 500,000), and large (population over 500,000). For each city size, we determined the cities with the greatest and smallest increases in unemployment.
Sources
1. U.S. Bureau of Labor Statistics, Local Area Unemployment Statistics
2. U.S. Bureau of Labor Statistics, Employment Situation Summary, April 2020