


As the coronavirus pandemic continues to affect the United States this winter, hospital capacity is becoming a concern as cases rise around the country and medical facilities fill up. Even as the effects of the pandemic are felt unevenly around the country, the amount of medical capacity also varies widely around the country.
In this analysis, AdvisorSmith examined data from the Centers for Medicare and Medicaid Services to find the metro areas, which we call cities, that have the most and least intensive care unit (ICU) hospital beds and total hospital beds per capita. We segmented our analysis by city size, examining hospital bed numbers in small, midsize, and large cities around the country.
We found that cities nationwide had an average of 23.7 ICU beds per 100,000 population. Additionally, we found that cities had an average of 2.6 hospital beds per 1,000 population.

Large Cities With Most and Least ICU Beds
Among cities with over 500,000 residents, we counted ICU beds in 109 large cities. Large cities had an average of 21.3 ICU beds per 100,000 residents, and the range of ICU beds was between a low of 10.3 and a high of 51.7.
| Rank | City | State | Adult ICU Beds | ICU Beds per 100K people |
|---|---|---|---|---|
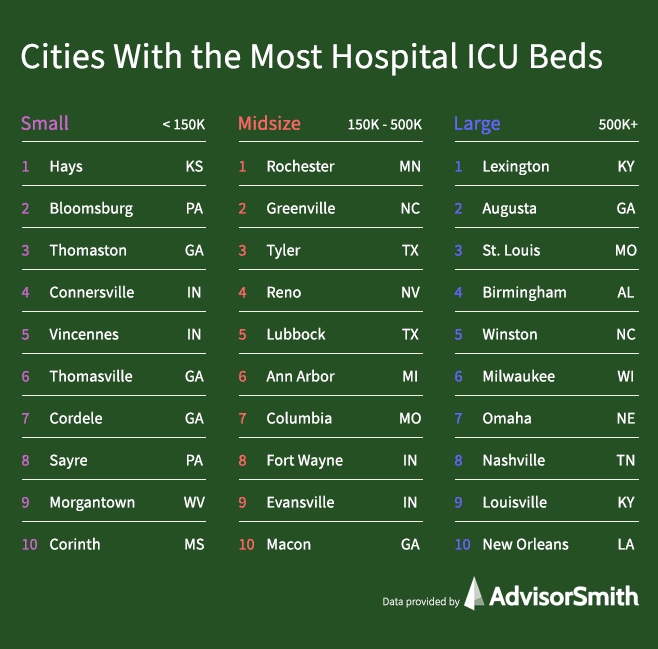
| 1 | Lexington | KY | 266 | 51.7 |
| 2 | Augusta | GA | 260 | 43.0 |
| 3 | St. Louis | MO | 1,158 | 41.3 |
| 4 | Birmingham | AL | 448 | 41.2 |
| 5 | Winston | NC | 253 | 37.7 |
| 6 | Milwaukee | WI | 569 | 36.2 |
| 7 | Omaha | NE | 322 | 34.2 |
| 8 | Nashville | TN | 607 | 31.9 |
| 9 | Louisville | KY | 393 | 31.1 |
| 10 | New Orleans | LA | 391 | 30.8 |
| 11 | Chattanooga | TN | 165 | 29.4 |
| 12 | Jackson | MS | 174 | 29.1 |
| 13 | Tucson | AZ | 299 | 28.8 |
| 14 | Jacksonville | FL | 434 | 28.3 |
| 15 | Durham | NC | 180 | 28.2 |
| 16 | Dayton | OH | 226 | 28.1 |
| 17 | Charleston | SC | 221 | 28.0 |
| 18 | Tulsa | OK | 278 | 28.0 |
| 19 | Scranton | PA | 150 | 27.0 |
| 20 | Little Rock | AR | 198 | 26.8 |
| 21 | El Paso | TX | 224 | 26.6 |
| 22 | Pittsburgh | PA | 613 | 26.4 |
| 23 | Kansas City | MO | 565 | 26.3 |
| 24 | North Port | FL | 216 | 26.3 |
| 25 | Toledo | OH | 167 | 26.0 |
| 26 | Tampa | FL | 802 | 25.4 |
| 27 | Wichita | KS | 161 | 25.3 |
| 28 | Palm Bay | FL | 149 | 25.0 |
| 29 | Oklahoma City | OK | 345 | 24.8 |
| 30 | Miami | FL | 1,514 | 24.6 |
| 31 | McAllen | TX | 211 | 24.5 |
| 32 | Cleveland | OH | 502 | 24.4 |
| 33 | Chicago | IL | 2,229 | 23.5 |
| 34 | Knoxville | TN | 201 | 23.3 |
| 35 | Philadelphia | PA | 1,397 | 22.9 |
| 36 | Detroit | MI | 988 | 22.9 |
| 37 | Lansing | MI | 124 | 22.6 |
| 38 | San Antonio | TX | 566 | 22.5 |
| 39 | Allentown | PA | 189 | 22.4 |
| 40 | Indianapolis | IN | 459 | 22.4 |
| 41 | Atlanta | GA | 1,313 | 22.1 |
| 42 | Cincinnati | OH | 488 | 22.1 |
| 43 | Denver | CO | 636 | 21.7 |
| 44 | Richmond | VA | 277 | 21.6 |
| 45 | Hartford | CT | 256 | 21.2 |
| 46 | Akron | OH | 149 | 21.2 |
| 47 | Fayetteville | AR | 111 | 21.1 |
| 48 | Providence | RI | 342 | 21.1 |
| 49 | Columbus | OH | 438 | 20.8 |
| 50 | Orlando | FL | 530 | 20.6 |
| Rank | City | State | Adult ICU Beds | ICU Beds per 100K people |
|---|---|---|---|---|
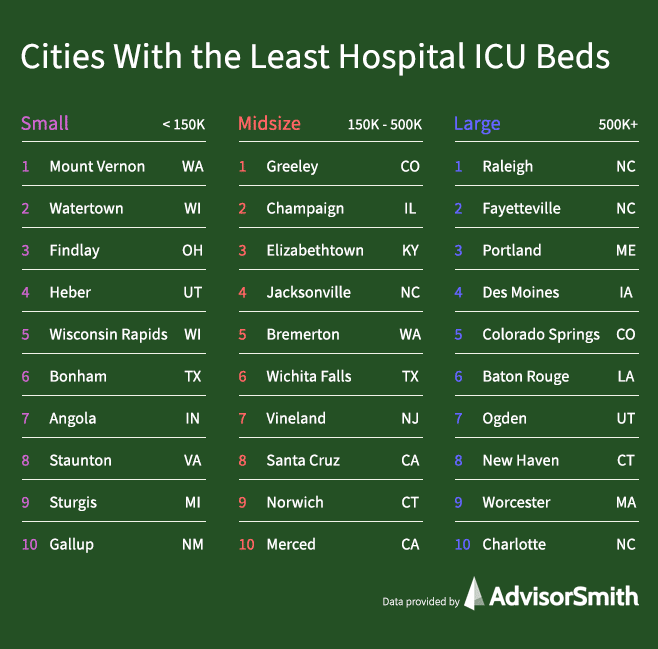
| 1 | Raleigh | NC | 141 | 10.4 |
| 2 | Fayetteville | NC | 62 | 11.9 |
| 3 | Portland | ME | 64 | 12.0 |
| 4 | Des Moines | IA | 84 | 12.2 |
| 5 | Colorado Springs | CO | 91 | 12.3 |
| 6 | Baton Rouge | LA | 107 | 12.5 |
| 7 | Ogden | UT | 86 | 12.8 |
| 8 | New Haven | CT | 110 | 12.8 |
| 9 | Worcester | MA | 125 | 13.2 |
| 10 | Charlotte | NC | 343 | 13.2 |
| 11 | Lancaster | PA | 73 | 13.4 |
| 12 | Washington | DC | 840 | 13.4 |
| 13 | Modesto | CA | 74 | 13.5 |
| 14 | Minneapolis | MN | 489 | 13.5 |
| 15 | Spokane | WA | 79 | 14.1 |
| 16 | Fresno | CA | 141 | 14.2 |
| 17 | Springfield | MA | 100 | 14.3 |
| 18 | Stockton | CA | 110 | 14.6 |
| 19 | Greenville | SC | 134 | 14.8 |
| 20 | Harrisburg | PA | 85 | 14.8 |
| 21 | Riverside | CA | 692 | 15.0 |
| 22 | New York | NY | 2,950 | 15.3 |
| 23 | Bakersfield | CA | 137 | 15.3 |
| 24 | Phoenix | AZ | 751 | 15.5 |
| 25 | Columbia | SC | 129 | 15.5 |
| 26 | Honolulu | HI | 154 | 15.7 |
| 27 | San Jose | CA | 315 | 15.8 |
| 28 | Greensboro | NC | 122 | 15.9 |
| 29 | Memphis | TN | 216 | 16.1 |
| 30 | Poughkeepsie | NY | 110 | 16.3 |
| 31 | Sacramento | CA | 384 | 16.4 |
| 32 | Grand Rapids | MI | 178 | 16.6 |
| 33 | Bridgeport | CT | 157 | 16.6 |
| 34 | Dallas | TX | 1,250 | 16.8 |
| 35 | Albuquerque | NM | 159 | 17.4 |
| 36 | Rochester | NY | 189 | 17.6 |
| 37 | San Diego | CA | 590 | 17.7 |
| 38 | Boise City | ID | 129 | 17.7 |
| 39 | Virginia Beach | VA | 314 | 17.8 |
| 40 | Madison | WI | 119 | 18.0 |
| 41 | Oxnard | CA | 153 | 18.0 |
| 42 | Buffalo | NY | 206 | 18.2 |
| 43 | Albany | NY | 161 | 18.2 |
| 44 | Deltona | FL | 123 | 18.7 |
| 45 | Cape Coral | FL | 141 | 18.7 |
| 46 | Lakeland | FL | 133 | 18.8 |
| 47 | Boston | MA | 923 | 19.0 |
| 48 | Salt Lake City | UT | 234 | 19.2 |
| 49 | San Francisco | CA | 909 | 19.2 |
| 50 | Provo | UT | 122 | 19.3 |
Midsize Cities With Most and Least ICU Beds
We studied ICU beds in 172 midsize cities with between 150,000 and 500,000 population. The average number of ICU beds in midsize cities was 24 per 100,000, with a range between 5.1 and 99.1.
| Rank | City | State | Adult ICU Beds | ICU Beds per 100K people |
|---|---|---|---|---|
| 1 | Rochester | MN | 218 | 99.2 |
| 2 | Greenville | NC | 167 | 93.0 |
| 3 | Tyler | TX | 206 | 89.7 |
| 4 | Reno | NV | 290 | 61.9 |
| 5 | Lubbock | TX | 194 | 60.8 |
| 6 | Ann Arbor | MI | 219 | 59.3 |
| 7 | Columbia | MO | 114 | 55.1 |
| 8 | Fort Wayne | IN | 218 | 53.3 |
| 9 | Evansville | IN | 163 | 51.8 |
| 10 | Macon | GA | 115 | 50.1 |
| 11 | Joplin | MO | 87 | 48.7 |
| 12 | Monroe | LA | 94 | 46.5 |
| 13 | Fargo | ND | 111 | 45.4 |
| 14 | Redding | CA | 81 | 45.1 |
| 15 | Athens | GA | 92 | 43.5 |
| 16 | Dover | DE | 77 | 43.1 |
| 17 | Jackson | TN | 76 | 42.6 |
| 18 | Gainesville | GA | 85 | 42.2 |
| 19 | Johnson City | TN | 84 | 41.4 |
| 20 | Panama City | FL | 77 | 41.3 |
| 21 | Asheville | NC | 185 | 40.3 |
| 22 | Springfield | IL | 83 | 39.9 |
| 23 | Abilene | TX | 66 | 38.6 |
| 24 | Charleston | WV | 100 | 38.4 |
| 25 | Lake Havasu City | AZ | 80 | 38.2 |
| 26 | Florence | SC | 75 | 36.6 |
| 27 | Kingsport | TN | 112 | 36.5 |
| 28 | Lake Charles | LA | 75 | 35.7 |
| 29 | Shreveport | LA | 137 | 34.5 |
| 30 | Terre Haute | IN | 64 | 34.3 |
| 31 | Coeur d'Alene | ID | 55 | 34.1 |
| 32 | Hattiesburg | MS | 57 | 33.9 |
| 33 | Bangor | ME | 51 | 33.6 |
| 34 | Madera | CA | 52 | 33.1 |
| 35 | Wausau | WI | 52 | 31.9 |
| 36 | Duluth | MN | 90 | 31.1 |
| 37 | Fort Smith | AR | 77 | 30.8 |
| 38 | Ocala | FL | 110 | 30.6 |
| 39 | Charlottesville | VA | 66 | 30.4 |
| 40 | Springfield | MO | 137 | 29.4 |
| 41 | Crestview | FL | 79 | 28.5 |
| 42 | Oshkosh | WI | 48 | 28.1 |
| 43 | Punta Gorda | FL | 51 | 27.6 |
| 44 | Eau Claire | WI | 46 | 27.3 |
| 45 | Brownsville | TX | 114 | 27.0 |
| 46 | Appleton | WI | 64 | 27.0 |
| 47 | Flint | MI | 109 | 26.8 |
| 48 | Peoria | IL | 108 | 26.8 |
| 49 | Gulfport | MS | 111 | 26.8 |
| 50 | Rockford | IL | 90 | 26.7 |
| Rank | City | State | Adult ICU Beds | ICU Beds per 100K people |
|---|---|---|---|---|
| 1 | Greeley | CO | 16 | 5.1 |
| 2 | Champaign | IL | 13 | 5.7 |
| 3 | Elizabethtown | KY | 10 | 6.5 |
| 4 | Jacksonville | NC | 14 | 7.1 |
| 5 | Bremerton | WA | 20 | 7.4 |
| 6 | Wichita Falls | TX | 12 | 7.9 |
| 7 | Vineland | NJ | 12 | 8.0 |
| 8 | Santa Cruz | CA | 22 | 8.0 |
| 9 | Norwich | CT | 22 | 8.3 |
| 10 | Merced | CA | 24 | 8.8 |
| 11 | Monroe | MI | 14 | 9.3 |
| 12 | Burlington | VT | 21 | 9.5 |
| 13 | Barnstable Town | MA | 21 | 9.8 |
| 14 | Wilmington | NC | 29 | 9.9 |
| 15 | Bellingham | WA | 24 | 10.7 |
| 16 | Pueblo | CO | 18 | 10.8 |
| 17 | Torrington | CT | 21 | 11.6 |
| 18 | Salisbury | MD | 48 | 11.7 |
| 19 | Reading | PA | 50 | 11.9 |
| 20 | Hilo | HI | 24 | 11.9 |
| 21 | Concord | NH | 18 | 11.9 |
| 22 | Kahului | HI | 20 | 12.0 |
| 23 | Burlington | NC | 20 | 12.0 |
| 24 | Auburn | AL | 20 | 12.2 |
| 25 | College Station | TX | 32 | 12.2 |
| 26 | Fort Collins | CO | 43 | 12.3 |
| 27 | Clarksville | TN | 39 | 12.8 |
| 28 | Hilton Head Island | SC | 28 | 12.8 |
| 29 | Hagerstown | MD | 37 | 12.9 |
| 30 | Lafayette | IN | 30 | 13.0 |
| 31 | Niles | MI | 20 | 13.0 |
| 32 | Tallahassee | FL | 50 | 13.0 |
| 33 | Cedar Rapids | IA | 36 | 13.2 |
| 34 | Yuba City | CA | 24 | 13.8 |
| 35 | Santa Maria | CA | 62 | 13.9 |
| 36 | Visalia | CA | 65 | 14.0 |
| 37 | Kingston | NY | 25 | 14.0 |
| 38 | East Stroudsburg | PA | 24 | 14.2 |
| 39 | Bloomington | IN | 24 | 14.3 |
| 40 | Salinas | CA | 62 | 14.3 |
| 41 | Tupelo | MS | 24 | 14.5 |
| 42 | Hanford | CA | 22 | 14.5 |
| 43 | Erie | PA | 40 | 14.7 |
| 44 | Kennewick | WA | 44 | 14.9 |
| 45 | Manchester | NH | 62 | 15.0 |
| 46 | Naples | FL | 58 | 15.3 |
| 47 | El Centro | CA | 28 | 15.4 |
| 48 | Waco | TX | 42 | 15.5 |
| 49 | Medford | OR | 34 | 15.5 |
| 50 | Lincoln | NE | 52 | 15.6 |
Small Cities With Most and Least ICU Beds
Our study counted ICU beds in 530 small cities with under 150,000 residents. In small cities, there were an average of 24 ICU beds per 100,000 residents. The range of ICU beds was between 4.7 to 118.7 per 100,000 people.
| Rank | City | State | Adult ICU Beds | ICU Beds per 100K people |
|---|---|---|---|---|
| 1 | Hays | KS | 34 | 118.7 |
| 2 | Bloomsburg | PA | 90 | 107.8 |
| 3 | Thomaston | GA | 28 | 106.9 |
| 4 | Connersville | IN | 20 | 86.7 |
| 5 | Vincennes | IN | 30 | 82.0 |
| 6 | Thomasville | GA | 35 | 78.9 |
| 7 | Cordele | GA | 16 | 70.7 |
| 8 | Sayre | PA | 42 | 69.1 |
| 9 | Morgantown | WV | 91 | 65.4 |
| 10 | Corinth | MS | 24 | 65.2 |
| 11 | The Dalles | OR | 17 | 64.3 |
| 12 | Kearney | NE | 34 | 60.8 |
| 13 | Selma | AL | 23 | 60.1 |
| 14 | Brenham | TX | 21 | 59.2 |
| 15 | Albert Lea | MN | 18 | 59.1 |
| 16 | Somerset | KY | 38 | 58.8 |
| 17 | Shelby | NC | 57 | 58.5 |
| 18 | Mount Vernon | IL | 22 | 58.3 |
| 19 | Scottsbluff | NE | 22 | 58.1 |
| 20 | New Bern | NC | 72 | 57.8 |
| 21 | Borger | TX | 12 | 56.8 |
| 22 | Harrison | AR | 24 | 53.1 |
| 23 | North Platte | NE | 19 | 52.2 |
| 24 | Jonesboro | AR | 66 | 49.7 |
| 25 | Norfolk | NE | 24 | 49.7 |
| 26 | Tifton | GA | 20 | 49.3 |
| 27 | Enid | OK | 30 | 49.1 |
| 28 | Greenville | MS | 22 | 48.8 |
| 29 | Dothan | AL | 72 | 48.6 |
| 30 | Hammond | LA | 64 | 47.8 |
| 31 | Fort Madison | IA | 28 | 47.8 |
| 32 | Vicksburg | MS | 22 | 47.7 |
| 33 | Jasper | IN | 26 | 47.2 |
| 34 | Sherman | TX | 62 | 46.3 |
| 35 | Walla Walla | WA | 28 | 46.2 |
| 36 | Richmond | IN | 30 | 45.4 |
| 37 | Big Stone Gap | VA | 19 | 45.4 |
| 38 | Lufkin | TX | 39 | 44.9 |
| 39 | Oxford | MS | 24 | 44.8 |
| 40 | Henderson | NC | 20 | 44.8 |
| 41 | Clarksdale | MS | 10 | 44.2 |
| 42 | Yankton | SD | 10 | 43.9 |
| 43 | The Villages | FL | 56 | 43.5 |
| 44 | Carson City | NV | 24 | 43.5 |
| 45 | Easton | MD | 16 | 43.2 |
| 46 | Rome | GA | 42 | 42.9 |
| 47 | Madisonville | KY | 19 | 42.2 |
| 48 | Nacogdoches | TX | 27 | 41.4 |
| 49 | Hot Springs | AR | 41 | 41.4 |
| 50 | Minden | LA | 16 | 41.2 |
| Rank | City | State | Adult ICU Beds | ICU Beds per 100K people |
|---|---|---|---|---|
| 1 | Mount Vernon | WA | 6 | 4.7 |
| 2 | Watertown | WI | 4 | 4.7 |
| 3 | Findlay | OH | 4 | 5.3 |
| 4 | Heber | UT | 4 | 5.3 |
| 5 | Wisconsin Rapids | WI | 4 | 5.5 |
| 6 | Bonham | TX | 2 | 5.7 |
| 7 | Angola | IN | 2 | 5.8 |
| 8 | Staunton | VA | 8 | 6.5 |
| 9 | Sturgis | MI | 4 | 6.6 |
| 10 | Gallup | NM | 5 | 7.0 |
| 11 | Oak Harbor | WA | 6 | 7.1 |
| 12 | Bozeman | MT | 8 | 7.2 |
| 13 | Clewiston | FL | 3 | 7.3 |
| 14 | Athens | TN | 4 | 7.5 |
| 15 | Moscow | ID | 3 | 7.5 |
| 16 | Centralia | WA | 6 | 7.5 |
| 17 | Rexburg | ID | 4 | 7.6 |
| 18 | Gettysburg | PA | 8 | 7.8 |
| 19 | Rochelle | IL | 4 | 7.9 |
| 20 | Farmington | NM | 10 | 8.0 |
| 21 | Somerset | PA | 6 | 8.1 |
| 22 | Huntsville | TX | 6 | 8.2 |
| 23 | Lawrence | KS | 10 | 8.3 |
| 24 | Cañon City | CO | 4 | 8.3 |
| 25 | Corning | NY | 8 | 8.3 |
| 26 | Mount Sterling | KY | 4 | 8.5 |
| 27 | Fergus Falls | MN | 5 | 8.5 |
| 28 | Albany | OR | 11 | 8.6 |
| 29 | Red Wing | MN | 4 | 8.6 |
| 30 | Bardstown | KY | 4 | 8.7 |
| 31 | Hillsdale | MI | 4 | 8.8 |
| 32 | Watertown | NY | 10 | 8.9 |
| 33 | Sandpoint | ID | 4 | 8.9 |
| 34 | Hermiston | OR | 8 | 9.0 |
| 35 | Pella | IA | 3 | 9.0 |
| 36 | Tiffin | OH | 5 | 9.1 |
| 37 | Edwards | CO | 5 | 9.1 |
| 38 | Dayton | TN | 3 | 9.1 |
| 39 | Adrian | MI | 9 | 9.2 |
| 40 | Shelton | WA | 6 | 9.2 |
| 41 | Big Rapids | MI | 4 | 9.2 |
| 42 | St. Marys | GA | 5 | 9.3 |
| 43 | Sierra Vista | AZ | 12 | 9.5 |
| 44 | Berlin | NH | 3 | 9.5 |
| 45 | El Campo | TX | 4 | 9.6 |
| 46 | Helena | MT | 8 | 9.9 |
| 47 | Logan | UT | 14 | 10.0 |
| 48 | Truckee | CA | 10 | 10.0 |
| 49 | Astoria | OR | 4 | 10.1 |
| 50 | Greeneville | TN | 7 | 10.1 |
Large Cities With Most and Least Hospital Beds
Our study examined 109 large cities with over 500,000 residents to find the cities with the most and least hospital beds nationwide. Among large cities, there were an average of 2.4 hospital beds per 1,000 residents, with a range from 1.2 to 4.7.
| Rank | City | State | Hospital Beds | Beds per 1,000 people |
|---|---|---|---|---|
| 1 | Jackson | MS | 2,796 | 4.7 |
| 2 | Birmingham | AL | 4,343 | 4.0 |
| 3 | Durham | NC | 2,537 | 4.0 |
| 4 | Rochester | NY | 4,227 | 3.9 |
| 5 | Little Rock | AR | 2,908 | 3.9 |
| 6 | Lexington | KY | 1,975 | 3.8 |
| 7 | Toledo | OH | 2,270 | 3.5 |
| 8 | New Haven | CT | 2,878 | 3.4 |
| 9 | St. Louis | MO | 9,410 | 3.4 |
| 10 | Buffalo | NY | 3,768 | 3.3 |
| 11 | Pittsburgh | PA | 7,722 | 3.3 |
| 12 | Cleveland | OH | 6,805 | 3.3 |
| 13 | Syracuse | NY | 2,122 | 3.3 |
| 14 | New Orleans | LA | 4,065 | 3.2 |
| 15 | Richmond | VA | 4,014 | 3.1 |
| 16 | Allentown | PA | 2,615 | 3.1 |
| 17 | Winston | NC | 2,075 | 3.1 |
| 18 | Tulsa | OK | 3,050 | 3.1 |
| 19 | Knoxville | TN | 2,592 | 3.0 |
| 20 | Louisville | KY | 3,721 | 2.9 |
| 21 | Kansas City | MO | 6,111 | 2.8 |
| 22 | Chattanooga | TN | 1,593 | 2.8 |
| 23 | Memphis | TN | 3,750 | 2.8 |
| 24 | Augusta | GA | 1,684 | 2.8 |
| 25 | Harrisburg | PA | 1,588 | 2.8 |
| 26 | Miami | FL | 16,888 | 2.7 |
| 27 | Dayton | OH | 2,213 | 2.7 |
| 28 | Oklahoma City | OK | 3,802 | 2.7 |
| 29 | Nashville | TN | 5,161 | 2.7 |
| 30 | Tampa | FL | 8,533 | 2.7 |
| 31 | Wichita | KS | 1,713 | 2.7 |
| 32 | Philadelphia | PA | 16,322 | 2.7 |
| 33 | Albany | NY | 2,352 | 2.7 |
| 34 | Indianapolis | IN | 5,412 | 2.6 |
| 35 | Akron | OH | 1,824 | 2.6 |
| 36 | Jacksonville | FL | 3,962 | 2.6 |
| 37 | Omaha | NE | 2,421 | 2.6 |
| 38 | Youngstown | OH | 1,382 | 2.6 |
| 39 | Lakeland | FL | 1,812 | 2.6 |
| 40 | Charleston | SC | 2,016 | 2.6 |
| 41 | Scranton | PA | 1,407 | 2.5 |
| 42 | Palm Bay | FL | 1,507 | 2.5 |
| 43 | McAllen | TX | 2,174 | 2.5 |
| 44 | New York | NY | 48,103 | 2.5 |
| 45 | North Port | FL | 2,048 | 2.5 |
| 46 | Hartford | CT | 3,007 | 2.5 |
| 47 | Columbia | SC | 2,061 | 2.5 |
| 48 | Baltimore | MD | 6,926 | 2.5 |
| 49 | Madison | WI | 1,628 | 2.5 |
| 50 | Milwaukee | WI | 3,875 | 2.5 |
| Rank | City | State | Hospital Beds | Beds per 1,000 people |
|---|---|---|---|---|
| 1 | Provo | UT | 738 | 1.2 |
| 2 | Ogden | UT | 842 | 1.2 |
| 3 | Raleigh | NC | 1,812 | 1.3 |
| 4 | Colorado Springs | CO | 1,042 | 1.4 |
| 5 | Lancaster | PA | 777 | 1.4 |
| 6 | Washington | DC | 9,169 | 1.5 |
| 7 | Austin | TX | 3,295 | 1.5 |
| 8 | Seattle | WA | 6,193 | 1.6 |
| 9 | Fayetteville | NC | 848 | 1.6 |
| 10 | Portland | OR | 4,046 | 1.6 |
| 11 | Sacramento | CA | 3,983 | 1.7 |
| 12 | Denver | CO | 5,018 | 1.7 |
| 13 | Oxnard | CA | 1,455 | 1.7 |
| 14 | Riverside | CA | 7,914 | 1.7 |
| 15 | Boise City | ID | 1,256 | 1.7 |
| 16 | Stockton | CA | 1,305 | 1.7 |
| 17 | Atlanta | GA | 10,386 | 1.7 |
| 18 | Fayetteville | AR | 951 | 1.8 |
| 19 | Minneapolis | MN | 6,586 | 1.8 |
| 20 | Worcester | MA | 1,747 | 1.8 |
| 21 | Poughkeepsie | NY | 1,253 | 1.9 |
| 22 | Bakersfield | CA | 1,658 | 1.9 |
| 23 | Phoenix | AZ | 9,075 | 1.9 |
| 24 | Fresno | CA | 1,861 | 1.9 |
| 25 | San Diego | CA | 6,303 | 1.9 |
| 26 | Houston | TX | 13,222 | 1.9 |
| 27 | Charlotte | NC | 4,959 | 1.9 |
| 28 | Dallas | TX | 14,348 | 1.9 |
| 29 | Bridgeport | CT | 1,822 | 1.9 |
| 30 | Greensboro | NC | 1,509 | 2.0 |
| 31 | San Jose | CA | 3,946 | 2.0 |
| 32 | Las Vegas | NV | 4,413 | 2.0 |
| 33 | Virginia Beach | VA | 3,577 | 2.0 |
| 34 | Cape Coral | FL | 1,532 | 2.0 |
| 35 | Albuquerque | NM | 1,866 | 2.0 |
| 36 | Lansing | MI | 1,123 | 2.0 |
| 37 | Salt Lake City | UT | 2,597 | 2.1 |
| 38 | Portland | ME | 1,146 | 2.1 |
| 39 | Boston | MA | 10,417 | 2.1 |
| 40 | Des Moines | IA | 1,496 | 2.2 |
| 41 | San Francisco | CA | 10,327 | 2.2 |
| 42 | Honolulu | HI | 2,163 | 2.2 |
| 43 | Deltona | FL | 1,457 | 2.2 |
| 44 | Greenville | SC | 2,009 | 2.2 |
| 45 | Los Angeles | CA | 29,642 | 2.2 |
| 46 | San Antonio | TX | 5,662 | 2.3 |
| 47 | El Paso | TX | 1,900 | 2.3 |
| 48 | Modesto | CA | 1,248 | 2.3 |
| 49 | Grand Rapids | MI | 2,446 | 2.3 |
| 50 | Cincinnati | OH | 5,059 | 2.3 |
Midsize Cities With Most and Least Hospital Beds
175 midsize cities with between 150,000 and 500,000 residents were included in our study. Midsize cities had an average of 2.6 beds per 1,000 residents, and cities ranged from 0.7 to 6.3 beds per 1,000.
| Rank | City | State | Hospital Beds | Beds per 1,000 people |
|---|---|---|---|---|
| 1 | Rochester | MN | 1,395 | 6.3 |
| 2 | Iowa City | IA | 1,075 | 6.2 |
| 3 | Saginaw | MI | 1,081 | 5.7 |
| 4 | Florence | SC | 1,130 | 5.5 |
| 5 | Greenville | NC | 943 | 5.3 |
| 6 | Tallahassee | FL | 1,971 | 5.1 |
| 7 | Columbia | MO | 1,006 | 4.9 |
| 8 | Sioux Falls | SD | 1,255 | 4.8 |
| 9 | Jackson | TN | 824 | 4.6 |
| 10 | Gainesville | FL | 1,484 | 4.5 |
| 11 | Ann Arbor | MI | 1,670 | 4.5 |
| 12 | Charleston | WV | 1,172 | 4.5 |
| 13 | Visalia | CA | 2,078 | 4.5 |
| 14 | Alexandria | LA | 682 | 4.5 |
| 15 | Gainesville | GA | 884 | 4.4 |
| 16 | Monroe | LA | 872 | 4.3 |
| 17 | Tupelo | MS | 710 | 4.3 |
| 18 | Macon | GA | 970 | 4.2 |
| 19 | Hattiesburg | MS | 685 | 4.1 |
| 20 | Duluth | MN | 1,166 | 4.0 |
| 21 | Johnson City | TN | 816 | 4.0 |
| 22 | Mobile | AL | 1,729 | 4.0 |
| 23 | Springfield | IL | 835 | 4.0 |
| 24 | Tyler | TX | 922 | 4.0 |
| 25 | Lubbock | TX | 1,275 | 4.0 |
| 26 | Lake Charles | LA | 815 | 3.9 |
| 27 | Evansville | IN | 1,212 | 3.9 |
| 28 | Joplin | MO | 681 | 3.8 |
| 29 | Huntington | WV | 1,354 | 3.8 |
| 30 | Shreveport | LA | 1,487 | 3.7 |
| 31 | Peoria | IL | 1,474 | 3.7 |
| 32 | St. Cloud | MN | 726 | 3.6 |
| 33 | Abilene | TX | 620 | 3.6 |
| 34 | Punta Gorda | FL | 667 | 3.6 |
| 35 | Fort Wayne | IN | 1,472 | 3.6 |
| 36 | Roanoke | VA | 1,121 | 3.6 |
| 37 | Santa Rosa | CA | 1,765 | 3.5 |
| 38 | Charlottesville | VA | 762 | 3.5 |
| 39 | Bowling Green | KY | 613 | 3.5 |
| 40 | Erie | PA | 938 | 3.5 |
| 41 | Odessa | TX | 559 | 3.5 |
| 42 | Redding | CA | 619 | 3.4 |
| 43 | Fort Smith | AR | 848 | 3.4 |
| 44 | Topeka | KS | 784 | 3.4 |
| 45 | Bangor | ME | 498 | 3.3 |
| 46 | Amarillo | TX | 860 | 3.3 |
| 47 | Billings | MT | 577 | 3.2 |
| 48 | Auburn | AL | 515 | 3.1 |
| 49 | Eau Claire | WI | 525 | 3.1 |
| 50 | Sebastian | FL | 486 | 3.1 |
| Rank | City | State | Hospital Beds | Beds per 1,000 people |
|---|---|---|---|---|
| 1 | Greeley | CO | 225 | 0.7 |
| 2 | Jacksonville | NC | 162 | 0.8 |
| 3 | Merced | CA | 226 | 0.8 |
| 4 | Torrington | CT | 186 | 1.0 |
| 5 | Bellingham | WA | 241 | 1.1 |
| 6 | Bremerton | WA | 298 | 1.1 |
| 7 | Monroe | MI | 171 | 1.1 |
| 8 | Burlington | NC | 212 | 1.3 |
| 9 | Yuba City | CA | 223 | 1.3 |
| 10 | Salem | OR | 554 | 1.3 |
| 11 | Santa Cruz | CA | 358 | 1.3 |
| 12 | Prescott Valley | AZ | 304 | 1.3 |
| 13 | San Luis Obispo | CA | 382 | 1.3 |
| 14 | Clarksville | TN | 412 | 1.4 |
| 15 | College Station | TX | 354 | 1.4 |
| 16 | Midland | TX | 246 | 1.4 |
| 17 | El Centro | CA | 268 | 1.5 |
| 18 | Daphne | AL | 323 | 1.5 |
| 19 | Kennewick | WA | 441 | 1.5 |
| 20 | Olympia | WA | 429 | 1.5 |
| 21 | Kingston | NY | 269 | 1.5 |
| 22 | Hilton Head Island | SC | 329 | 1.5 |
| 23 | Vallejo | CA | 676 | 1.5 |
| 24 | Hanford | CA | 230 | 1.5 |
| 25 | Oshkosh | WI | 265 | 1.6 |
| 26 | Bend | OR | 298 | 1.6 |
| 27 | Dover | DE | 281 | 1.6 |
| 28 | State College | PA | 260 | 1.6 |
| 29 | Trenton | NJ | 593 | 1.6 |
| 30 | Myrtle Beach | SC | 776 | 1.6 |
| 31 | Racine | WI | 318 | 1.6 |
| 32 | Hagerstown | MD | 464 | 1.6 |
| 33 | Norwich | CT | 435 | 1.6 |
| 34 | Warner Robins | GA | 301 | 1.6 |
| 35 | Eugene | OR | 624 | 1.6 |
| 36 | St. George | UT | 284 | 1.7 |
| 37 | Barnstable Town | MA | 354 | 1.7 |
| 38 | Yakima | WA | 424 | 1.7 |
| 39 | Elkhart | IN | 352 | 1.7 |
| 40 | Spartanburg | SC | 541 | 1.7 |
| 41 | Las Cruces | NM | 379 | 1.7 |
| 42 | Lafayette | IN | 404 | 1.7 |
| 43 | Laredo | TX | 485 | 1.8 |
| 44 | Bloomington | IN | 302 | 1.8 |
| 45 | Salinas | CA | 797 | 1.8 |
| 46 | York | PA | 829 | 1.9 |
| 47 | Concord | NH | 281 | 1.9 |
| 48 | Salisbury | MD | 784 | 1.9 |
| 49 | Yuma | AZ | 406 | 1.9 |
| 50 | East Stroudsburg | PA | 327 | 1.9 |
Small Cities With Most and Least Hospital Beds
In 625 small cities with under 150,000 residents, we found that the average number of beds per 1,000 was 2.6. The range for small cities was between 0.2 and 19.7 hospital beds per 1,000 residents.
| Rank | City | State | Hospital Beds | Beds per 1,000 people |
|---|---|---|---|---|
| 1 | Kinston | NC | 1,103 | 19.7 |
| 2 | Bloomsburg | PA | 969 | 11.6 |
| 3 | Yankton | SD | 262 | 11.5 |
| 4 | Carroll | IA | 205 | 10.2 |
| 5 | Cordele | GA | 208 | 9.2 |
| 6 | Point Pleasant | WV | 507 | 8.9 |
| 7 | Clarksdale | MS | 181 | 8.0 |
| 8 | Meridian | MS | 775 | 7.7 |
| 9 | Fort Madison | IA | 444 | 7.6 |
| 10 | Thomasville | GA | 328 | 7.4 |
| 11 | Olean | NY | 567 | 7.4 |
| 12 | Malone | NY | 368 | 7.3 |
| 13 | Murray | KY | 277 | 7.1 |
| 14 | Bainbridge | GA | 187 | 7.0 |
| 15 | Helena | AR | 127 | 7.0 |
| 16 | Vicksburg | MS | 321 | 7.0 |
| 17 | Burlington | IA | 313 | 6.8 |
| 18 | Aberdeen | SD | 290 | 6.7 |
| 19 | Paducah | KY | 637 | 6.6 |
| 20 | Cleveland | MS | 199 | 6.4 |
| 21 | Borger | TX | 135 | 6.4 |
| 22 | Great Falls | MT | 518 | 6.3 |
| 23 | Pierre | SD | 130 | 6.3 |
| 24 | Morgantown | WV | 866 | 6.2 |
| 25 | Sayre | PA | 378 | 6.2 |
| 26 | Oneonta | NY | 371 | 6.2 |
| 27 | Kearney | NE | 343 | 6.1 |
| 28 | Minot | ND | 455 | 6.0 |
| 29 | Amsterdam | NY | 290 | 5.9 |
| 30 | Maysville | KY | 100 | 5.9 |
| 31 | Mitchell | SD | 134 | 5.8 |
| 32 | Gillette | WY | 350 | 5.8 |
| 33 | Ada | OK | 220 | 5.7 |
| 34 | St. Marys | PA | 173 | 5.7 |
| 35 | Lewiston | ME | 615 | 5.7 |
| 36 | Enid | OK | 347 | 5.7 |
| 37 | Wheeling | WV | 789 | 5.6 |
| 38 | Minden | LA | 215 | 5.5 |
| 39 | Lima | OH | 566 | 5.5 |
| 40 | Rolla | MO | 242 | 5.4 |
| 41 | Natchitoches | LA | 208 | 5.4 |
| 42 | Mountain Home | AR | 224 | 5.4 |
| 43 | Gadsden | AL | 552 | 5.4 |
| 44 | Rome | GA | 527 | 5.4 |
| 45 | Marshall | MN | 136 | 5.3 |
| 46 | Victoria | TX | 527 | 5.3 |
| 47 | Albert Lea | MN | 161 | 5.3 |
| 48 | Hays | KS | 149 | 5.2 |
| 49 | Cape Girardeau | MO | 501 | 5.2 |
| 50 | Paris | TX | 253 | 5.1 |
| Rank | City | State | Hospital Beds | Beds per 1,000 people |
|---|---|---|---|---|
| 1 | Holland | MI | 25 | 0.2 |
| 2 | Oak Harbor | WA | 25 | 0.3 |
| 3 | Rochelle | IL | 17 | 0.3 |
| 4 | Shelton | WA | 25 | 0.4 |
| 5 | Gardnerville Ranchos | NV | 23 | 0.5 |
| 6 | Nogales | AZ | 25 | 0.5 |
| 7 | Ellensburg | WA | 26 | 0.5 |
| 8 | Cornelia | GA | 25 | 0.6 |
| 9 | Shawano | WI | 25 | 0.6 |
| 10 | Pahrump | NV | 25 | 0.6 |
| 11 | Menomonie | WI | 25 | 0.6 |
| 12 | Sandpoint | ID | 25 | 0.6 |
| 13 | Kill Devil Hills | NC | 21 | 0.6 |
| 14 | Watertown | WI | 49 | 0.6 |
| 15 | Wabash | IN | 18 | 0.6 |
| 16 | Cedartown | GA | 25 | 0.6 |
| 17 | Clewiston | FL | 25 | 0.6 |
| 18 | El Campo | TX | 26 | 0.6 |
| 19 | Moscow | ID | 25 | 0.6 |
| 20 | Kendallville | IN | 31 | 0.7 |
| 21 | Prineville | OR | 16 | 0.7 |
| 22 | Sunbury | PA | 63 | 0.7 |
| 23 | Escanaba | MI | 25 | 0.7 |
| 24 | Peru | IN | 25 | 0.7 |
| 25 | Brookings | OR | 16 | 0.7 |
| 26 | Decatur | IN | 25 | 0.7 |
| 27 | Bonham | TX | 25 | 0.7 |
| 28 | Albany | OR | 92 | 0.7 |
| 29 | Angola | IN | 25 | 0.7 |
| 30 | Ashland | OH | 39 | 0.7 |
| 31 | Gettysburg | PA | 76 | 0.7 |
| 32 | Lewisburg | TN | 25 | 0.7 |
| 33 | Jackson | OH | 24 | 0.7 |
| 34 | St. Marys | GA | 40 | 0.7 |
| 35 | Rio Grande City | TX | 48 | 0.7 |
| 36 | Heber | UT | 56 | 0.7 |
| 37 | Bradford | PA | 31 | 0.8 |
| 38 | Dayton | TN | 25 | 0.8 |
| 39 | Taos | NM | 25 | 0.8 |
| 40 | Red Bluff | CA | 49 | 0.8 |
| 41 | Gaffney | SC | 44 | 0.8 |
| 42 | Frankfort | IN | 25 | 0.8 |
| 43 | Clearlake | CA | 50 | 0.8 |
| 44 | Bozeman | MT | 87 | 0.8 |
| 45 | Emporia | KS | 28 | 0.8 |
| 46 | Uvalde | TX | 21 | 0.8 |
| 47 | Dickinson | ND | 25 | 0.8 |
| 48 | Granbury | TX | 48 | 0.8 |
| 49 | Aberdeen | WA | 59 | 0.8 |
| 50 | Hermiston | OR | 71 | 0.8 |
Methodology
To determine the cities with the most and least hospital beds per capita, we used data published by the Centers for Medicare and Medicaid Services on Hospital Beds and Locations and provided by The Accountability Project, which provides counts of hospital beds from hospitals around the country.
To find the number of ICU beds, we counted the total number of adult ICU beds available in each metropolitan area. To find the total number of hospital beds, we included acute care beds, intensive care beds, coronary care beds, burn unit beds, surgical beds, and other specialty hospital beds.
We calculated the number of hospital beds per metropolitan area, which we call cities for the purposes of this study. We used estimates from the U.S. Census Bureau on population figures for each of the cities. For ICU beds, we found the number of beds per 10,000 residents. For total hospital beds, we adjusted the number of beds by population to find the number of beds per 1,000 residents.
We then divided cities into three groups based upon population. Cities with under 150,000 residents were considered small cities. Cities with between 150,000 and 500,000 residents were considered midsize cities, and cities with over 500,000 residents were considered large cities.
To conclude the analysis, we ranked the cities within their population subgroups in order to discover the cities with the most and least ICU and total hospital beds per capita.
Sources
- Centers for Medicare and Medicaid Services, Hospital Beds and Locations (from The Accountability Project)
- U.S. Census Bureau, Metropolitan and Micropolitan Statistical Areas Population Totals and Components of Change, Annual Estimates of the Resident Population