


As the United States begins its recovery from the coronavirus pandemic in 2021 with the arrival of vaccines, the country’s economy is beginning to heal from the damage done by the pandemic. In this study, AdvisorSmith examined the rates of job growth and job loss in U.S. cities and states over the past two years, from March 2019 through March 2021. We also studied the cities with the fastest job growth and most job losses by city size.
During the two-year period between March 2019 and March 2021, the United States lost about 6.1 million jobs, with total employment dropping to 143 million in March 2021. This was a drop of 4.1% over the two-year study period (an annualized decrease of -2.1%).
Twenty states, primarily in the Midwest and the South, had job growth rates or job loss rates that were better than the national average. The other 30 states and Washington, D.C., suffered job losses that were worse than the national average. Idaho had the highest job growth rate, with job growth of 4.1% over the two-year period, adding about 30,900 jobs. Hawaii’s tourism-dependent economy lost the most jobs, with a reduction of -16.3%, accounting for 107,400 lost jobs.
Our study ranked 394 U.S. cities using data provided by the U.S. Bureau of Labor of Statistics. Read on to discover the cities with the best job growth in 2021.
Cities With the Best Job Growth
Below, we list the 50 cities with the best job growth over the past two years. Each city’s employment level (in thousands) is listed during March 2019, March 2020, and March 2021, along with the percentage growth in jobs in each city during the two-year study period.
| Rank | City | State | March 2019 | March 2020 | March 2021 | Growth |
|---|---|---|---|---|---|---|
| 1 | Ocean City | NJ | 34.9 | 34.9 | 39.1 | 12.0% |
| 2 | St. George | UT | 69.8 | 72.1 | 75.7 | 8.5% |
| 3 | Idaho Falls | ID | 68.5 | 70.4 | 73.8 | 7.7% |
| 4 | Coeur d'Alene | ID | 64.6 | 66.7 | 69 | 6.8% |
| 5 | Lakeland | FL | 234.6 | 242.8 | 247.1 | 5.3% |
| 6 | Provo | UT | 269.4 | 271.8 | 281.9 | 4.6% |
| 7 | Ogden | UT | 264.5 | 268.3 | 275.9 | 4.3% |
| 8 | Boise | ID | 339.7 | 352.7 | 353.1 | 3.9% |
| 9 | Pocatello | ID | 37.3 | 37.4 | 38.7 | 3.8% |
| 10 | Sierra Vista | AZ | 33.9 | 35 | 35 | 3.2% |
| 11 | Fayetteville | AR | 262.1 | 271.7 | 268.6 | 2.5% |
| 12 | Huntsville | AL | 243.5 | 249.2 | 249 | 2.3% |
| 13 | Lake Havasu City | AZ | 52 | 52.4 | 53 | 1.9% |
| 14 | Walla Walla | WA | 28.1 | 29.2 | 28.6 | 1.8% |
| 15 | Austin | TX | 1103.5 | 1137.8 | 1123.1 | 1.8% |
| 16 | Salt Lake City | UT | 741.6 | 756.4 | 754.7 | 1.8% |
| 17 | Cleveland | TN | 46.6 | 47.6 | 47.4 | 1.7% |
| 18 | Waco | TX | 121.9 | 123.2 | 123.9 | 1.6% |
| 19 | Lewiston | ID | 28.1 | 28.5 | 28.5 | 1.4% |
| 20 | Winchester | VA | 65.3 | 66.7 | 66.2 | 1.4% |
| 21 | Twin Falls | ID | 46.4 | 47.5 | 47 | 1.3% |
| 22 | Stockton | CA | 242.4 | 249.6 | 245.5 | 1.3% |
| 23 | Logan | UT | 65.1 | 66.4 | 65.7 | 0.9% |
| 24 | Panama City | FL | 80.3 | 81.5 | 80.9 | 0.7% |
| 25 | Kennewick | WA | 115.1 | 118.2 | 115.9 | 0.7% |
| 26 | California | MD | 47.3 | 48.1 | 47.6 | 0.6% |
| 27 | Decatur | AL | 57.1 | 58.2 | 57.4 | 0.5% |
| 28 | Crestview | FL | 117.9 | 119 | 118.4 | 0.4% |
| 29 | Bend | OR | 84.3 | 87.2 | 84.6 | 0.4% |
| 30 | Gainesville | GA | 93 | 94.8 | 93.2 | 0.2% |
| 31 | Rapid City | SD | 66.2 | 66.8 | 66.3 | 0.2% |
| 32 | Dallas | TX | 2655.9 | 2718.7 | 2659 | 0.1% |
| 33 | Pensacola | FL | 185.4 | 188.2 | 185.6 | 0.1% |
| 34 | Palm Bay | FL | 229.8 | 233.1 | 230 | 0.1% |
| 35 | Champaign | IL | 116.1 | 117.9 | 116.2 | 0.1% |
| 36 | Savannah | GA | 189.1 | 192.4 | 189.2 | 0.1% |
| 37 | Brunswick | GA | 43.3 | 43.7 | 43.3 | 0.0% |
| 38 | Auburn | AL | 66.2 | 66.5 | 66.2 | 0.0% |
| 39 | Jacksonville | FL | 718.1 | 727.3 | 717.9 | 0.0% |
| 40 | Phoenix | AZ | 2166.9 | 2218 | 2164.7 | -0.1% |
| 41 | Prescott | AZ | 65.5 | 66.2 | 65.4 | -0.2% |
| 42 | Sherman | TX | 48.4 | 49 | 48.3 | -0.2% |
| 43 | Port St. Lucie | FL | 156 | 158.7 | 155.6 | -0.3% |
| 44 | Raleigh | NC | 639.9 | 653.3 | 638.1 | -0.3% |
| 45 | Ocala | FL | 107.9 | 109 | 107.5 | -0.4% |
| 46 | Amarillo | TX | 121 | 121.8 | 120.5 | -0.4% |
| 47 | Morristown | TN | 47 | 47.3 | 46.8 | -0.4% |
| 48 | Tyler | TX | 107 | 108.1 | 106.5 | -0.5% |
| 49 | Sioux Falls | SD | 157 | 159.2 | 156.2 | -0.5% |
| 50 | Jefferson City | MO | 77.5 | 77.9 | 77.1 | -0.5% |
Cities That Lost the Most Jobs
The following table shows the 50 cities that suffered the worst job losses over the past two years. It also lists the employment level (in thousands) for each city in March 2019, March 2020, and March 2021.
| Rank (Losses) | City | State | Mar 2019 | Mar 2020 | Mar 2021 | Growth% |
|---|---|---|---|---|---|---|
| 1 | Kahului | HI | 80.9 | 79.9 | 60.3 | -25.5% |
| 2 | Lake Charles | LA | 116.1 | 109.3 | 92.1 | -20.7% |
| 3 | Odessa | TX | 84.2 | 81.6 | 68 | -19.2% |
| 4 | Midland | TX | 112.5 | 112.4 | 94.2 | -16.3% |
| 5 | Honolulu | HI | 475.2 | 473.4 | 409.5 | -13.8% |
| 6 | State College | PA | 81.3 | 79.6 | 71.1 | -12.5% |
| 7 | Santa Cruz | CA | 102.8 | 102.3 | 90.1 | -12.4% |
| 8 | Ithaca | NY | 65.9 | 63.8 | 58 | -12.0% |
| 9 | Atlantic City | NJ | 130.7 | 131.2 | 115.6 | -11.6% |
| 10 | New York City | NY | 4620.8 | 4631.4 | 4090 | -11.5% |
| 11 | Norwich | CT | 127.3 | 124.2 | 112.8 | -11.4% |
| 12 | Napa | CA | 73.6 | 72.9 | 65.4 | -11.1% |
| 13 | Farmington | NM | 47.6 | 46.2 | 42.3 | -11.1% |
| 14 | Las Vegas | NV | 1028.3 | 1043 | 914.1 | -11.1% |
| 15 | Orlando | FL | 1325.1 | 1335.6 | 1180.8 | -10.9% |
| 16 | San Luis Obispo | CA | 118.7 | 119 | 105.8 | -10.9% |
| 17 | Springfield | MA | 336.7 | 334.4 | 302 | -10.3% |
| 18 | Corvallis | OR | 44.8 | 43.5 | 40.2 | -10.3% |
| 19 | Gadsden | AL | 37.5 | 36.5 | 33.7 | -10.1% |
| 20 | Pittsfield | MA | 39.9 | 38.7 | 35.9 | -10.0% |
| 21 | New Orleans | LA | 580.7 | 578.8 | 523 | -9.9% |
| 22 | Santa Fe | NM | 62.4 | 62.4 | 56.2 | -9.9% |
| 23 | Los Angeles | CA | 4554.5 | 4561.4 | 4105.4 | -9.9% |
| 24 | Binghamton | NY | 102.7 | 100.3 | 92.7 | -9.7% |
| 25 | Santa Rosa | CA | 206.2 | 207.5 | 186.3 | -9.7% |
| 26 | Lawrence | KS | 54 | 52.3 | 48.8 | -9.6% |
| 27 | Kingston | NY | 61.4 | 60.4 | 55.5 | -9.6% |
| 28 | Manhattan | KS | 42.9 | 42.1 | 38.8 | -9.6% |
| 29 | Monroe | MI | 41 | 40.8 | 37.1 | -9.5% |
| 30 | Johnstown | PA | 53.9 | 52.6 | 48.8 | -9.5% |
| 31 | Victoria | TX | 41.7 | 40.2 | 37.9 | -9.1% |
| 32 | Cumberland | MD | 39.7 | 38 | 36.1 | -9.1% |
| 33 | Wheeling | WV | 65 | 61.5 | 59.2 | -8.9% |
| 34 | Lansing | MI | 239.1 | 238.4 | 218 | -8.8% |
| 35 | San Francisco | CA | 2459.4 | 2477.4 | 2242.5 | -8.8% |
| 36 | Nassau County | NY | 1331.4 | 1309.7 | 1214.8 | -8.8% |
| 37 | Elmira | NY | 36.8 | 37.1 | 33.6 | -8.7% |
| 38 | Reading | PA | 181.3 | 179.7 | 165.7 | -8.6% |
| 39 | Newark | NJ | 1221.6 | 1220.4 | 1116.5 | -8.6% |
| 40 | Philadelphia | PA | 975.3 | 984.1 | 892.7 | -8.5% |
| 41 | Battle Creek | MI | 57.9 | 56.7 | 53 | -8.5% |
| 42 | Salinas | CA | 143 | 143.3 | 130.9 | -8.5% |
| 43 | Anaheim | CA | 1661.5 | 1659.8 | 1521.1 | -8.5% |
| 44 | Shreveport | LA | 181.9 | 178.4 | 166.6 | -8.4% |
| 45 | Rockford | IL | 150 | 145.6 | 137.5 | -8.3% |
| 46 | Chico | CA | 80.5 | 80.3 | 73.8 | -8.3% |
| 47 | Kokomo | IN | 39.9 | 39 | 36.6 | -8.3% |
| 48 | Muskegon | MI | 63.1 | 62.9 | 57.9 | -8.2% |
| 49 | Decatur | IL | 50.2 | 49.2 | 46.1 | -8.2% |
| 50 | Kalamazoo | MI | 150.7 | 151 | 138.4 | -8.2% |
Cities With the Best Job Growth by City Size
The nation’s cities with the best growth in employment and segmented by city size, are listed here. We broke down our study of job growth by small (population < 150,000), midsize (population 150,000-500,000), and large (population > 500,000) cities in order to provide more meaningful comparisons.

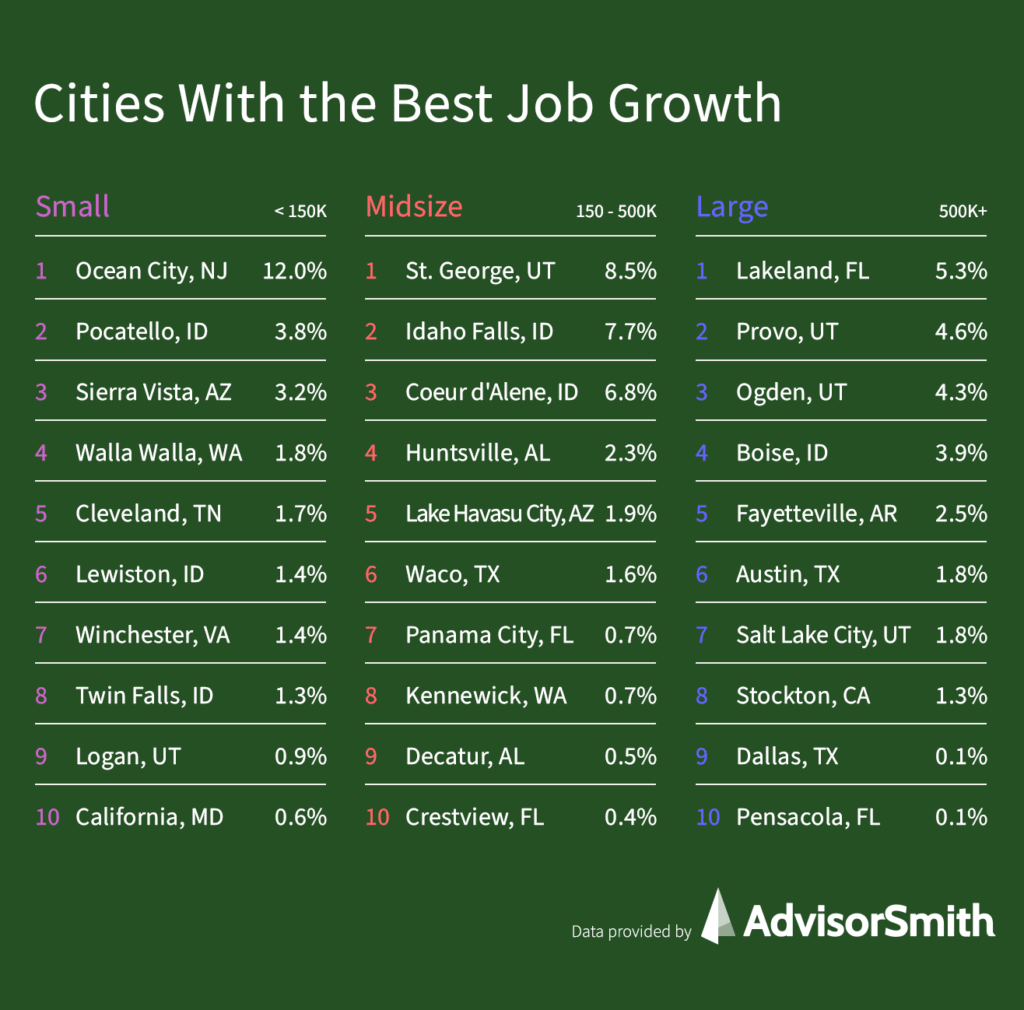
Small Cities With the Most Job Growth
| Rank | City | State | Growth |
|---|---|---|---|
| 1 | Ocean City | NJ | 12.0% |
| 2 | Pocatello | ID | 3.8% |
| 3 | Sierra Vista | AZ | 3.2% |
| 4 | Walla Walla | WA | 1.8% |
| 5 | Cleveland | TN | 1.7% |
| 6 | Lewiston | ID | 1.4% |
| 7 | Winchester | VA | 1.4% |
| 8 | Twin Falls | ID | 1.3% |
| 9 | Logan | UT | 0.9% |
| 10 | California | MD | 0.6% |
| 11 | Rapid City | SD | 0.2% |
| 12 | Brunswick | GA | 0.0% |
| 13 | Sherman | TX | -0.2% |
| 14 | Morristown | TN | -0.4% |
| 15 | Valdosta | GA | -0.5% |
| 16 | Bismarck | ND | -0.8% |
| 17 | Hammond | LA | -1.1% |
| 18 | The Villages | FL | -1.2% |
| 19 | Carson City | NV | -1.3% |
| 20 | Jonesboro | AR | -1.3% |
| 21 | Staunton | VA | -1.6% |
| 22 | Longview | WA | -1.7% |
| 23 | Homosassa Springs | FL | -1.8% |
| 24 | New Bern | NC | -1.8% |
| 25 | Dothan | AL | -1.8% |
Small Cities With the Worst Job Losses
| Rank | City | State | Growth |
|---|---|---|---|
| 1 | Ithaca | NY | -12.0% |
| 2 | Napa | CA | -11.1% |
| 3 | Farmington | NM | -11.1% |
| 4 | Corvallis | OR | -10.3% |
| 5 | Gadsden | AL | -10.1% |
| 6 | Pittsfield | MA | -10.0% |
| 7 | Lawrence | KS | -9.6% |
| 8 | Manhattan | KS | -9.6% |
| 9 | Johnstown | PA | -9.5% |
| 10 | Victoria | TX | -9.1% |
| 11 | Cumberland | MD | -9.1% |
| 12 | Wheeling | WV | -8.9% |
| 13 | Elmira | NY | -8.7% |
| 14 | Battle Creek | MI | -8.5% |
| 15 | Kokomo | IN | -8.3% |
| 16 | Decatur | IL | -8.2% |
| 17 | Parkersburg | WV | -7.9% |
| 18 | Kankakee | IL | -7.5% |
| 19 | Grand Forks | ND | -7.1% |
| 20 | Enid | OK | -7.1% |
| 21 | Midland | MI | -6.9% |
| 22 | Mount Vernon | WA | -6.9% |
| 23 | Beckley | WV | -6.8% |
| 24 | Casper | WY | -6.7% |
| 25 | Watertown | NY | -6.6% |
Midsize Cities With the Most Job Growth
| Rank | City | State | Growth |
|---|---|---|---|
| 1 | St. George | UT | 8.5% |
| 2 | Idaho Falls | ID | 7.7% |
| 3 | Coeur d'Alene | ID | 6.8% |
| 4 | Huntsville | AL | 2.3% |
| 5 | Lake Havasu City | AZ | 1.9% |
| 6 | Waco | TX | 1.6% |
| 7 | Panama City | FL | 0.7% |
| 8 | Kennewick | WA | 0.7% |
| 9 | Decatur | AL | 0.5% |
| 10 | Crestview | FL | 0.4% |
| 11 | Bend | OR | 0.4% |
| 12 | Gainesville | GA | 0.2% |
| 13 | Champaign | IL | 0.1% |
| 14 | Savannah | GA | 0.1% |
| 15 | Auburn | AL | 0.0% |
| 16 | Prescott | AZ | -0.2% |
| 17 | Port St. Lucie | FL | -0.3% |
| 18 | Ocala | FL | -0.4% |
| 19 | Amarillo | TX | -0.4% |
| 20 | Tyler | TX | -0.5% |
| 21 | Sioux Falls | SD | -0.5% |
| 22 | Jefferson City | MO | -0.5% |
| 23 | Wilmington | NC | -0.5% |
| 24 | Fargo | ND | -0.8% |
| 25 | Reno | NV | -0.9% |
Midsize Cities With the Worst Job Losses
| Rank | City | State | Growth |
|---|---|---|---|
| 1 | Kahului | HI | -25.5% |
| 2 | Lake Charles | LA | -20.7% |
| 3 | Odessa | TX | -19.2% |
| 4 | Midland | TX | -16.3% |
| 5 | State College | PA | -12.5% |
| 6 | Santa Cruz | CA | -12.4% |
| 7 | Atlantic City | NJ | -11.6% |
| 8 | Norwich | CT | -11.4% |
| 9 | San Luis Obispo | CA | -10.9% |
| 10 | Santa Fe | NM | -9.9% |
| 11 | Binghamton | NY | -9.7% |
| 12 | Santa Rosa | CA | -9.7% |
| 13 | Kingston | NY | -9.6% |
| 14 | Monroe | MI | -9.5% |
| 15 | Reading | PA | -8.6% |
| 16 | Salinas | CA | -8.5% |
| 17 | Shreveport | LA | -8.4% |
| 18 | Rockford | IL | -8.3% |
| 19 | Chico | CA | -8.3% |
| 20 | Muskegon | MI | -8.2% |
| 21 | Kalamazoo | MI | -8.2% |
| 22 | Elizabethtown | KY | -8.1% |
| 23 | East Stroudsburg | PA | -8.1% |
| 24 | Erie | PA | -8.0% |
| 25 | Utica | NY | -7.8% |
Large Cities With the Most Job Growth
| Rank | City | State | Growth |
|---|---|---|---|
| 1 | Lakeland | FL | 5.3% |
| 2 | Provo | UT | 4.6% |
| 3 | Ogden | UT | 4.3% |
| 4 | Boise | ID | 3.9% |
| 5 | Fayetteville | AR | 2.5% |
| 6 | Austin | TX | 1.8% |
| 7 | Salt Lake City | UT | 1.8% |
| 8 | Stockton | CA | 1.3% |
| 9 | Dallas | TX | 0.1% |
| 10 | Pensacola | FL | 0.1% |
| 11 | Palm Bay | FL | 0.1% |
| 12 | Jacksonville | FL | 0.0% |
| 13 | Phoenix | AZ | -0.1% |
| 14 | Raleigh | NC | -0.3% |
| 15 | Knoxville | TN | -0.6% |
| 16 | Tampa | FL | -0.6% |
| 17 | Colorado Springs | CO | -0.7% |
| 18 | San Antonio | TX | -0.9% |
| 19 | Nashville | TN | -1.2% |
| 20 | Riverside | CA | -1.4% |
| 21 | Fort Worth | TX | -1.5% |
| 22 | Augusta | GA | -1.5% |
| 23 | Kansas City | MO | -1.6% |
| 24 | Charlotte | NC | -1.6% |
| 25 | Kansas City | KS | -1.6% |
Large Cities With the Worst Job Losses
| Rank | City | State | Growth% |
|---|---|---|---|
| 1 | Honolulu | HI | -13.80% |
| 2 | New York City | NY | -11.50% |
| 3 | Las Vegas | NV | -11.10% |
| 4 | Orlando | FL | -10.90% |
| 5 | Springfield | MA | -10.30% |
| 6 | New Orleans | LA | -9.90% |
| 7 | Los Angeles | CA | -9.90% |
| 8 | Lansing | MI | -8.80% |
| 9 | San Francisco | CA | -8.80% |
| 10 | Nassau County | NY | -8.80% |
| 11 | Newark | NJ | -8.60% |
| 12 | Philadelphia | PA | -8.50% |
| 13 | Anaheim | CA | -8.50% |
| 14 | Oakland | CA | -8.10% |
| 15 | Elgin | IL | -8.00% |
| 16 | Youngstown | OH | -8.00% |
| 17 | Buffalo | NY | -7.90% |
| 18 | Boston | MA | -7.80% |
| 19 | Syracuse | NY | -7.80% |
| 20 | Gary | IN | -7.50% |
| 21 | Chicago | IL | -7.50% |
| 22 | Baton Rouge | LA | -7.20% |
| 23 | Warren | MI | -7.20% |
| 24 | Pittsburgh | PA | -7.20% |
| 25 | Oxnard | CA | -7.10% |
Job Growth in Each State
The table below shows job growth and losses in all 50 states and Washington, D.C. Only three states added jobs in the past two years, while the rest of the states all lost jobs. Midwestern and southern states had the most job growth and least job losses, while the Northeast, Upper Midwest, and West had the worst job losses.
| Rank | State | March 2019 | March 2020 | March 2021 | Growth |
|---|---|---|---|---|---|
| 1 | Idaho | 745.4 | 766.4 | 776.3 | 4.1% |
| 2 | Utah | 1542.6 | 1565.3 | 1579.1 | 2.4% |
| 3 | Montana | 472.2 | 478.7 | 473 | 0.2% |
| 4 | South Dakota | 431.2 | 432.4 | 427.6 | -0.8% |
| 5 | Arizona | 2929.6 | 2987.7 | 2901.7 | -1.0% |
| 6 | Nebraska | 1012.5 | 1017.3 | 999.8 | -1.3% |
| 7 | Arkansas | 1277.1 | 1287.9 | 1258.7 | -1.4% |
| 8 | Texas | 12693.4 | 12869.4 | 12477.5 | -1.7% |
| 9 | Tennessee | 3100.4 | 3127.7 | 3045.7 | -1.8% |
| 10 | North Carolina | 4550.3 | 4589 | 4460.5 | -2.0% |
| 11 | Alabama | 2061.4 | 2070.4 | 2019.5 | -2.0% |
| 12 | Georgia | 4592 | 4628.8 | 4474.4 | -2.6% |
| 13 | South Carolina | 2168.3 | 2174 | 2108.3 | -2.8% |
| 14 | Missouri | 2886.8 | 2891.8 | 2797.2 | -3.1% |
| 15 | Kansas | 1411.9 | 1414.6 | 1368 | -3.1% |
| 16 | Colorado | 2749.5 | 2788.4 | 2662.3 | -3.2% |
| 17 | Mississippi | 1156.1 | 1153 | 1118.9 | -3.2% |
| 18 | Washington | 3422.1 | 3471.5 | 3305.2 | -3.4% |
| 19 | Iowa | 1567.4 | 1566.3 | 1506.5 | -3.9% |
| 20 | Virginia | 4023.7 | 4046.2 | 3864.4 | -4.0% |
| 21 | Florida | 8965.5 | 9047.4 | 8599.5 | -4.1% |
| 22 | Kentucky | 1926.5 | 1929.5 | 1845 | -4.2% |
| 23 | Indiana | 3143.8 | 3118.7 | 3010.4 | -4.2% |
| 24 | New Hampshire | 677.9 | 676.6 | 648 | -4.4% |
| 25 | Maine | 617.9 | 618.5 | 590 | -4.5% |
| 26 | Wisconsin | 2949.2 | 2940.2 | 2810.2 | -4.7% |
| 27 | Oklahoma | 1700.8 | 1688.8 | 1620.6 | -4.7% |
| 28 | Delaware | 461.5 | 459.6 | 439.5 | -4.8% |
| 29 | Ohio | 5525.8 | 5497.2 | 5257.8 | -4.8% |
| 30 | Maryland | 2745.7 | 2725.9 | 2610.5 | -4.9% |
| 31 | Wyoming | 283.7 | 281.4 | 268.6 | -5.3% |
| 32 | Oregon | 1933.4 | 1945.6 | 1828.9 | -5.4% |
| 33 | West Virginia | 716.3 | 706.7 | 676.8 | -5.5% |
| 34 | North Dakota | 433.3 | 431.9 | 409.1 | -5.6% |
| 35 | Minnesota | 2923.1 | 2925.7 | 2758.3 | -5.6% |
| 36 | Pennsylvania | 6009.1 | 6001.3 | 5625.1 | -6.4% |
| 37 | Illinois | 6048.7 | 6020.3 | 5661.5 | -6.4% |
| 38 | Connecticut | 1676.7 | 1664.5 | 1564.4 | -6.7% |
| 39 | New Mexico | 848.9 | 856.2 | 790.6 | -6.9% |
| 40 | New Jersey | 4138.4 | 4145 | 3846.8 | -7.0% |
| 41 | Michigan | 4402.2 | 4373.5 | 4090 | -7.1% |
| 42 | California | 17309.3 | 17439.8 | 16080.9 | -7.1% |
| 43 | Massachusetts | 3625.7 | 3641.8 | 3367.7 | -7.1% |
| 44 | Alaska | 317.9 | 316.9 | 294.8 | -7.3% |
| 45 | Rhode Island | 494.7 | 493.9 | 457.6 | -7.5% |
| 46 | Louisiana | 1994.1 | 1968.5 | 1833.8 | -8.0% |
| 47 | District of Columbia | 796.6 | 799.5 | 730.9 | -8.2% |
| 48 | Nevada | 1408 | 1426.2 | 1290.9 | -8.3% |
| 49 | Vermont | 318.7 | 312.4 | 290.2 | -8.9% |
| 50 | New York | 9698.2 | 9644.9 | 8757.5 | -9.7% |
| 51 | Hawaii | 660.8 | 657.8 | 553.4 | -16.3% |
Methodology
This study examined the change in jobs based upon estimates published by the U.S. Bureau of Labor Statistics in the State and Metro Area Employment data set. We examined the percentage change in jobs in each metropolitan area between March 2019 and March 2021. We used non-seasonally adjusted figures since we examined comparable time periods for the starting and ending period.
We ranked the top 50 cities for job growth, as well as the 50 cities with the highest job losses. We also ranked the top small, midsize, and large cities by their job growth or losses. Additionally, we ranked all 50 states and Washington, D.C., based on their job growth or losses over the two-year study period.
Sources
- U.S. Bureau of Labor Statistics, Current Employment Statistics State and Area Estimates
- U.S. Census Bureau, Population Estimates Program