


With the United States in the midst of a ten-year economic expansion, job creation has been strong in many places around the country. In this study, AdvisorSmith ranks the U.S. cities with the best job growth over the past three years. We also break down the fastest job growth by city size in order to provide a comparison of similarly sized cities. Additionally, we ranked job growth rates by state.
In the three year period between July 2016 and July 2019, the United States added approximately 6.7 million jobs, with total employment reaching 151 million in July 2019, for a growth rate of 4.6% over the study period (an annualized growth rate of 1.5%).
Fifteen states, all in the West and the South, had employment growth rates at or above the national average. The other 35 states and Washington, D.C. had growth rates below the national average. The fastest growing state was Utah, which grew by 9.9% over three years (3.2% annualized), and added 139,000 jobs. The slowest growing state was Alaska, which added just 0.1% to its net employment over the study period.
Midsize cities accounted for the top 5, and 12 of the top 20 cities with the fastest net employment growth. All of the top 30 cities were in the West or the South. Our study ranked 398 US cities using data provided by the U.S. Bureau of Labor of Statistics.
Cities with the Best Job Growth by City Size
The nation’s cities with the best growth in employment, segmented by city size, are listed here. We broke down our study of job growth by small (population < 150,000), midsize (population 150,000-500,000), and large (population > 500,000) cities in order to provide more meaningful comparisons.

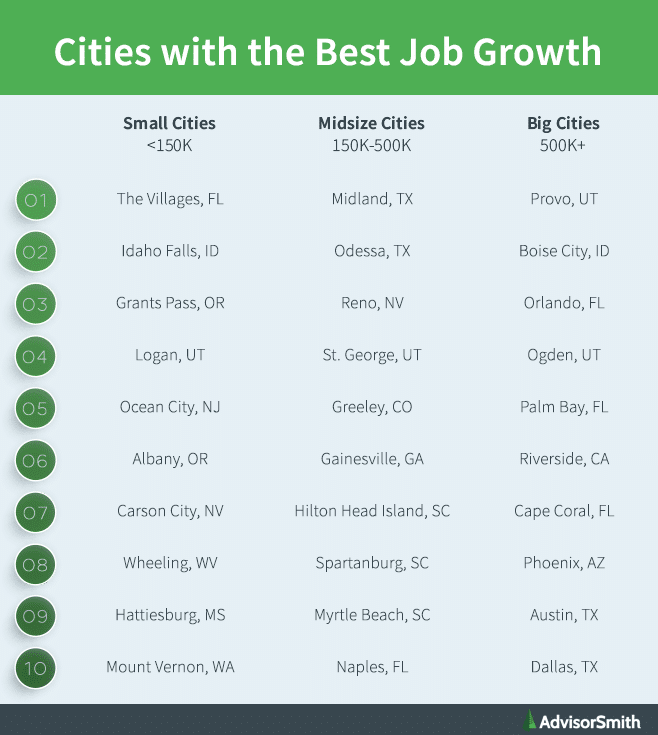
Cities with the Best Job Growth (July 2016 – July 2019)
1. Midland, TX
As the #1 city in our study, Midland is located halfway between Fort Worth and El Paso in West Texas. The city is where administrative offices for overseeing oil fields in West Texas are located. Distribution and logistics are other important industries in Midland, given the city’s central location in West Texas.
From 2016 to 2019, Midland added a total of 25,000 jobs, increasing from 86,300 to 111,300, a net increase of 29% (8.85% growth annualized). Some of the largest employers in Midland include the Midland Independent School District, Dawson Geophysical, Midland Memorial Hospital and Medical Center, Walmart, the City of Midland, and Midland College.
2. Odessa, TX
Located just 30 minutes west of Midland, Odessa is a Texan city located in West Texas. Founded in 1881 as a railway stop, the city grew rapidly due to a series of oil booms after oil was first discovered in 1927. Oil is the primary industry in the city, including equipment suppliers and refineries, but the city is also developing as a center of logistics, with several major distribution centers.
Odessa’s employment grew from 68,800 to 83,000 during the past 3 years, a growth of 20.6% (or 6.5% annualized). Overall, Odessa added 14,200 jobs during the study period. Major employers in Odessa include Saulsbury Industries, Ector County Independent School District, Halliburton, Medical Center Hospital, and Keane Group.
3. Reno, NV
Reno sits at the foot of the Sierra Nevada mountains and is approximately 22 miles from Lake Tahoe in the northwest portion of Nevada. The city is the second most populous metro area in Nevada after Las Vegas. Reno became an important stop on the transcontinental railroad, being the biggest city between Sacramento and Salt Lake City. The legalization of casinos in Nevada in 1931 led to a boom in Reno, which once hosted the largest casino in the world. More recently, Reno has begun to attract technology employers and distribution facilities.
Net employment in Reno jumped 17.3% in the past 3 years, from 218,600 in 2016 to 256,400 in July 2019, a net gain of 37,800. Important employers in Reno include the Washoe County School District, the University of Nevada, Reno, Washoe County, Renown Regional Medical Center, and casino employers such as Peppermill Reno, International Game Technology, Atlantis Casino Resort, and Eldorado.
4. St. George, UT
Located in the southwest portion of Utah, St. George is about 300 miles south of Salt Lake City. The city was originally a settlement organized by Brigham Young, the leader of The Church of Jesus Christ of Latter-day Saints in the 1860s. Today, St. George serves as an important gateway to Zion National Park, making tourism an important industry in the city. Additionally, the city serves as the headquarters for regional airline SkyWest Airlines.
St. George’s employment increased from 60,400 in July 2016 to 70,300 in July 2019, an increase of 16.4%, or 5.19% on an annualized basis. Some of the largest employers in St. George are the Washington County School District, Intermountain Healthcare, Walmart, and Dixie State University.
5. Greeley, CO
Greeley is a midsize city situated in northern Colorado and was founded in the late 1800s. Greeley’s economy was built around farming and agriculture. Historically, the city was a center for sugar beet production, and it produced about a quarter of the sugar in the United States in the 1920s. The city is famous for the Greeley Stampede, which is a rodeo, parade, carnival, and music festival all in one event.
During the study period, jobs in Greeley grew 13.6% (4.4% annualized) from 97,600 to 110,900, for a net gain of 13,300. Major employers in Greeley include JBS, North Colorado Medical Center, Greeley-Evans School District 6, the University of Northern Colorado, Weld County, and State Farm.
Top 50 Cities with the Best Job Growth
Below, we list the cities with the best job growth over the past three years. Each city’s employment level (in thousands) is listed for the study period, along with the percentage growth and the absolute number of jobs created in each city. We also provide the city’s size for reference.
| Rank | City | City Size | July 2016 Employment (thousands) | July 2017 Employment (thousands) | July 2018 Employment (thousands) | July 2019 Employment (thousands) | 3 Year Percentage Growth | 3 Year Net Jobs Created (thousands) | Annualized Percentage Change |
|---|---|---|---|---|---|---|---|---|---|
| 1 | Midland, TX | Midsize | 86.3 | 95.1 | 110.1 | 111.3 | 29.00% | 25 | 8.85% |
| 2 | Odessa, TX | Midsize | 68.8 | 73.7 | 80.8 | 83 | 20.60% | 14.2 | 6.45% |
| 3 | Reno, NV | Midsize | 218.6 | 231.3 | 242.2 | 256.4 | 17.30% | 37.8 | 5.46% |
| 4 | St. George, UT | Midsize | 60.4 | 63.3 | 67.2 | 70.3 | 16.40% | 9.9 | 5.19% |
| 5 | Greeley, CO | Midsize | 97.6 | 102.8 | 107.9 | 110.9 | 13.60% | 13.3 | 4.35% |
| 6 | Provo, UT | Large | 232.9 | 242.9 | 255.3 | 264 | 13.40% | 31.1 | 4.27% |
| 7 | The Villages, FL | Small | 26.5 | 27.5 | 28.9 | 30 | 13.20% | 3.5 | 4.22% |
| 8 | Boise City, ID | Large | 305.4 | 317.3 | 333.4 | 345.3 | 13.10% | 39.9 | 4.18% |
| 9 | Gainesville, GA | Midsize | 86.2 | 90 | 92.1 | 96.3 | 11.70% | 10.1 | 3.76% |
| 10 | Hilton Head Island, SC | Midsize | 78.8 | 81.4 | 84.6 | 87.7 | 11.30% | 8.9 | 3.63% |
| 11 | Spartanburg, SC | Midsize | 145.2 | 151.3 | 157.4 | 161.2 | 11.00% | 16 | 3.55% |
| 12 | Orlando, FL | Large | 1199.8 | 1235.6 | 1279.4 | 1328.4 | 10.70% | 128.6 | 3.45% |
| 13 | Idaho Falls, ID | Small | 64.6 | 65.9 | 68.9 | 71.4 | 10.50% | 6.8 | 3.39% |
| 14 | Ogden, UT | Large | 248.1 | 255.3 | 261.3 | 273.5 | 10.20% | 25.4 | 3.30% |
| 15 | Myrtle Beach, SC | Midsize | 171 | 176.2 | 183.3 | 188.3 | 10.10% | 17.3 | 3.26% |
| 16 | Palm Bay, FL | Large | 208.8 | 213.7 | 222.4 | 229.6 | 10.00% | 20.8 | 3.22% |
| 17 | Riverside, CA | Large | 1385.1 | 1434.7 | 1487.4 | 1522.7 | 9.90% | 137.6 | 3.21% |
| 18 | Naples, FL | Midsize | 137.1 | 140.4 | 145.2 | 150.7 | 9.90% | 13.6 | 3.20% |
| 19 | Port St. Lucie, FL | Midsize | 139.6 | 143.4 | 148.2 | 153.4 | 9.90% | 13.8 | 3.19% |
| 20 | Olympia, WA | Midsize | 111.5 | 115.2 | 119.1 | 122.3 | 9.70% | 10.8 | 3.13% |
| 21 | Cape Coral, FL | Large | 250 | 256.7 | 263.5 | 274.2 | 9.70% | 24.2 | 3.13% |
| 22 | Phoenix, AZ | Large | 1931.8 | 1988.6 | 2056.9 | 2117.4 | 9.60% | 185.6 | 3.11% |
| 23 | Bend, OR | Midsize | 80.2 | 83.5 | 85.7 | 87.9 | 9.60% | 7.7 | 3.10% |
| 24 | Austin, TX | Large | 999.6 | 1030.8 | 1069.9 | 1094.3 | 9.50% | 94.7 | 3.06% |
| 25 | Dallas, TX | Large | 2493.5 | 2555.2 | 2623.1 | 2726.2 | 9.30% | 232.7 | 3.02% |
| 26 | Sebastian, FL | Midsize | 49.4 | 50.7 | 51.9 | 54 | 9.30% | 4.6 | 3.01% |
| 27 | Grants Pass, OR | Small | 25.4 | 25.9 | 26.9 | 27.7 | 9.10% | 2.3 | 2.93% |
| 28 | Lake Charles, LA | Midsize | 108.8 | 117.3 | 118 | 118.5 | 8.90% | 9.7 | 2.89% |
| 29 | College Station, TX | Midsize | 109.3 | 111.6 | 116.5 | 119 | 8.90% | 9.7 | 2.87% |
| 30 | San Francisco, CA | Large | 1090 | 1111.8 | 1146 | 1185.7 | 8.80% | 95.7 | 2.84% |
| 31 | Elkhart, IN | Midsize | 130.6 | 136.7 | 141.5 | 142 | 8.70% | 11.4 | 2.83% |
| 32 | Logan, UT | Small | 56.7 | 58 | 59.5 | 61.6 | 8.60% | 4.9 | 2.80% |
| 33 | Nashville, TN | Large | 943.6 | 975 | 1002.1 | 1025.1 | 8.60% | 81.5 | 2.80% |
| 34 | Salinas, CA | Midsize | 135.6 | 139.5 | 142 | 147.3 | 8.60% | 11.7 | 2.80% |
| 35 | Ocean City, NJ | Small | 56.9 | 58.6 | 58.4 | 61.8 | 8.60% | 4.9 | 2.79% |
| 36 | Huntsville, AL | Midsize | 224.9 | 231.2 | 236.9 | 244.2 | 8.60% | 19.3 | 2.78% |
| 37 | Fayetteville, AR | Large | 241.9 | 247.6 | 253.2 | 262.6 | 8.60% | 20.7 | 2.77% |
| 38 | Jacksonville, FL | Large | 665 | 685.4 | 702.1 | 721.7 | 8.50% | 56.7 | 2.76% |
| 39 | Seattle, WA | Large | 1656.8 | 1699 | 1735.2 | 1797.1 | 8.50% | 140.3 | 2.75% |
| 40 | Asheville, NC | Midsize | 185.5 | 188.5 | 192.9 | 201.2 | 8.50% | 15.7 | 2.75% |
| 41 | Daphne, AL | Midsize | 76.5 | 78.6 | 80.2 | 82.9 | 8.40% | 6.4 | 2.71% |
| 42 | Charlotte, NC | Large | 1135.1 | 1165 | 1196.8 | 1228.4 | 8.20% | 93.3 | 2.67% |
| 43 | Lake Havasu City, AZ | Midsize | 47.8 | 49 | 50.4 | 51.7 | 8.20% | 3.9 | 2.65% |
| 44 | Fresno, CA | Large | 334.8 | 340.2 | 349 | 362.1 | 8.20% | 27.3 | 2.65% |
| 45 | Charleston, SC | Large | 347.6 | 356.7 | 368.4 | 375.9 | 8.10% | 28.3 | 2.64% |
| 46 | Las Vegas, NV | Large | 946.9 | 971 | 1002.2 | 1023.8 | 8.10% | 76.9 | 2.64% |
| 47 | McAllen, TX | Large | 246.1 | 251.1 | 258.4 | 265.9 | 8.00% | 19.8 | 2.61% |
| 48 | Medford, OR | Midsize | 83.3 | 86.4 | 87.3 | 90 | 8.00% | 6.7 | 2.61% |
| 49 | Kennewick, WA | Midsize | 111.9 | 114.5 | 117.3 | 120.9 | 8.00% | 9 | 2.61% |
| 50 | Colorado Springs, CO | Large | 278.8 | 286.9 | 292.8 | 301.2 | 8.00% | 22.4 | 2.61% |
20 Cities that Lost the Most Jobs
Although the United States added millions of jobs over the past 3 years, some cities lost jobs over the 3 year study period. The majority of these cities (15 out of 20) were small cities. The sole large city in the top 20 for lost jobs was Youngstown, Ohio.
| Rank | City | City Size | July 2016 Employment (thousands) | July 2017 Employment (thousands) | July 2018 Employment (thousands) | July 2019 Employment (thousands) | 3 Year Percentage Change | 3 Year Net Jobs Lost (thousands) | Annualized Percentage Change |
|---|---|---|---|---|---|---|---|---|---|
| 1 | Enid, OK | Small | 26.8 | 25.6 | 25.5 | 25.4 | -5.20% | -1.4 | -1.77% |
| 2 | Houma, LA | Midsize | 88.6 | 85.6 | 87.1 | 84.5 | -4.60% | -4.1 | -1.57% |
| 3 | Lawrence, MA | Small | 84.6 | 84.6 | 83.2 | 81.2 | -4.00% | -3.4 | -1.36% |
| 4 | Alexandria, LA | Midsize | 63.2 | 61.7 | 61.1 | 61.1 | -3.30% | -2.1 | -1.12% |
| 5 | Muncie, IN | Small | 50.6 | 48.2 | 48.5 | 49 | -3.20% | -1.6 | -1.07% |
| 6 | Youngstown, OH | Large | 223.9 | 217.7 | 219.2 | 217.1 | -3.00% | -6.8 | -1.02% |
| 7 | Cleveland, TN | Small | 47.1 | 46.9 | 45.3 | 45.7 | -3.00% | -1.4 | -1.00% |
| 8 | Danville, IL | Small | 28.3 | 27.9 | 26.9 | 27.5 | -2.80% | -0.8 | -0.95% |
| 9 | Charleston, WV | Midsize | 112.7 | 111.6 | 110.6 | 109.6 | -2.80% | -3.1 | -0.93% |
| 10 | Sierra Vista, AZ | Small | 33.2 | 32.1 | 32.6 | 32.3 | -2.70% | -0.9 | -0.91% |
| 11 | Grand Forks, ND | Small | 54.7 | 54.3 | 54 | 53.3 | -2.60% | -1.4 | -0.86% |
| 12 | Johnstown, PA | Small | 55.1 | 54.1 | 53.4 | 53.8 | -2.40% | -1.3 | -0.79% |
| 13 | Weirton, WV | Small | 40.6 | 40.2 | 40.5 | 39.7 | -2.20% | -0.9 | -0.74% |
| 14 | Battle Creek, MI | Small | 58.8 | 58.6 | 57.5 | 57.5 | -2.20% | -1.3 | -0.74% |
| 15 | Bismarck, ND | Small | 74.3 | 73.2 | 72.6 | 72.7 | -2.20% | -1.6 | -0.72% |
| 16 | Bay City, MI | Small | 35.9 | 35.4 | 35.5 | 35.2 | -1.90% | -0.7 | -0.65% |
| 17 | Rocky Mount, NC | Small | 55.5 | 54.5 | 54.8 | 54.5 | -1.80% | -1 | -0.60% |
| 18 | Parkersburg, WV | Small | 38.9 | 38.1 | 38.4 | 38.2 | -1.80% | -0.7 | -0.60% |
| 19 | Michigan City, IN | Small | 41.5 | 41.3 | 41.7 | 40.8 | -1.70% | -0.7 | -0.57% |
| 20 | Bloomington, IL | Midsize | 91.2 | 92.2 | 89.7 | 89.9 | -1.40% | -1.3 | -0.48% |
Job Growth in Each State
Western states led the nation in job growth, with the top 5 spots, and 8 of the top 10 taken by states in the West. In total, the top 10 states added about 3.6 million jobs between July 2016 and July 2019, which is more than half the national total of 6.7 million jobs added.
| Rank | State | July 2016 Employment (thousands) | July 2017 Employment (thousands) | July 2018 Employment (thousands) | July 2019 Employment (thousands) | 3 Year Percentage Growth | 3 Year Net Jobs Created (thousands) | Annualized Percentage Change |
|---|---|---|---|---|---|---|---|---|
| 1 | Utah | 1418.2 | 1454.2 | 1503.7 | 1558.1 | 9.90% | 139.9 | 3.19% |
| 2 | Nevada | 1299.2 | 1337.3 | 1381 | 1426.4 | 9.80% | 127.2 | 3.16% |
| 3 | Idaho | 702.8 | 721.2 | 746.9 | 769.1 | 9.40% | 66.3 | 3.05% |
| 4 | Arizona | 2642 | 2703.8 | 2783.3 | 2861.5 | 8.30% | 219.5 | 2.70% |
| 5 | Washington | 3261.1 | 3341.3 | 3420.5 | 3528.1 | 8.20% | 267 | 2.66% |
| 6 | Florida | 8275.1 | 8455.3 | 8645.4 | 8892.7 | 7.50% | 617.6 | 2.43% |
| 7 | Colorado | 2615.5 | 2672.2 | 2745.8 | 2802.7 | 7.20% | 187.2 | 2.33% |
| 8 | Texas | 11974.6 | 12172.8 | 12475.6 | 12816 | 7.00% | 841.4 | 2.29% |
| 9 | Oregon | 1825.3 | 1871.6 | 1899.7 | 1942.8 | 6.40% | 117.5 | 2.10% |
| 10 | California | 16394 | 16730.3 | 17050.5 | 17378.9 | 6.00% | 984.9 | 1.96% |
| 11 | South Carolina | 2058.8 | 2097.4 | 2148.1 | 2181.7 | 6.00% | 122.9 | 1.95% |
| 12 | Georgia | 4353 | 4429.8 | 4518.2 | 4597.8 | 5.60% | 244.8 | 1.84% |
| 13 | North Carolina | 4284.5 | 4358.2 | 4441.9 | 4524.9 | 5.60% | 240.4 | 1.84% |
| 14 | Tennessee | 2940.3 | 2984 | 3029.7 | 3090.2 | 5.10% | 149.9 | 1.67% |
| 15 | New Mexico | 817.3 | 822.8 | 833.5 | 855.2 | 4.60% | 37.9 | 1.52% |
| 16 | Alabama | 1991.6 | 2011.3 | 2037.1 | 2077.3 | 4.30% | 85.7 | 1.41% |
| 17 | Montana | 474 | 479.1 | 485 | 494.1 | 4.20% | 20.1 | 1.39% |
| 18 | New York | 9458.7 | 9573.3 | 9698.5 | 9829.3 | 3.90% | 370.6 | 1.29% |
| 19 | South Dakota | 438.6 | 437.8 | 443 | 455.5 | 3.90% | 16.9 | 1.27% |
| 20 | Arkansas | 1218.2 | 1232 | 1245.9 | 1265.1 | 3.80% | 46.9 | 1.27% |
| 21 | New Jersey | 4082.2 | 4131.6 | 4170 | 4235.3 | 3.80% | 153.1 | 1.23% |
| 22 | West Virginia | 706.6 | 709.7 | 723.5 | 732.8 | 3.70% | 26.2 | 1.22% |
| 23 | New Hampshire | 672.1 | 680.6 | 685 | 696.4 | 3.60% | 24.3 | 1.19% |
| 24 | Indiana | 3038.8 | 3070.2 | 3105.2 | 3145.7 | 3.50% | 106.9 | 1.16% |
| 25 | Rhode Island | 492.1 | 495.9 | 499 | 509.4 | 3.50% | 17.3 | 1.16% |
| 26 | Oklahoma | 1635.2 | 1651.4 | 1675.1 | 1689.8 | 3.30% | 54.6 | 1.10% |
| 27 | Virginia | 3916 | 3961.6 | 4013.8 | 4044.9 | 3.30% | 128.9 | 1.09% |
| 28 | Massachusetts | 3608.1 | 3647.9 | 3673.6 | 3719.9 | 3.10% | 111.8 | 1.02% |
| 29 | Illinois | 6027.1 | 6072.3 | 6132.1 | 6210.2 | 3.00% | 183.1 | 1.00% |
| 30 | District of Columbia | 787.8 | 794 | 801.5 | 811 | 2.90% | 23.2 | 0.97% |
| 31 | Pennsylvania | 5861 | 5913.9 | 5982.3 | 6028.4 | 2.90% | 167.4 | 0.94% |
| 32 | Michigan | 4308.8 | 4341.6 | 4401.1 | 4430.9 | 2.80% | 122.1 | 0.94% |
| 33 | Minnesota | 2915.1 | 2951.3 | 2980.5 | 2996.6 | 2.80% | 81.5 | 0.92% |
| 34 | Missouri | 2831 | 2853.5 | 2874.5 | 2907.3 | 2.70% | 76.3 | 0.89% |
| 35 | Maine | 638.2 | 642.4 | 647.3 | 654.8 | 2.60% | 16.6 | 0.86% |
| 36 | Wyoming | 291.6 | 290.5 | 292.6 | 298.9 | 2.50% | 7.3 | 0.83% |
| 37 | Mississippi | 1133.5 | 1136.9 | 1137.6 | 1161.5 | 2.50% | 28 | 0.82% |
| 38 | Delaware | 459 | 461.5 | 466.6 | 470.3 | 2.50% | 11.3 | 0.81% |
| 39 | Kentucky | 1903.9 | 1907 | 1919.6 | 1948.7 | 2.40% | 44.8 | 0.78% |
| 40 | Ohio | 5496.5 | 5532.4 | 5577.1 | 5621.5 | 2.30% | 125 | 0.75% |
| 41 | Maryland | 2702.5 | 2732.5 | 2751.6 | 2762.8 | 2.20% | 60.3 | 0.74% |
| 42 | Kansas | 1387 | 1385.3 | 1398.8 | 1417.1 | 2.20% | 30.1 | 0.72% |
| 43 | Wisconsin | 2946.7 | 2968.9 | 2990.9 | 3009.7 | 2.10% | 63 | 0.71% |
| 44 | Hawaii | 639.8 | 645.4 | 647.1 | 652.2 | 1.90% | 12.4 | 0.64% |
| 45 | Iowa | 1565.9 | 1565.8 | 1578.7 | 1594.5 | 1.80% | 28.6 | 0.61% |
| 46 | Vermont | 310.7 | 311.9 | 315 | 315.8 | 1.60% | 5.1 | 0.54% |
| 47 | Nebraska | 1015.7 | 1016.3 | 1024.9 | 1031.6 | 1.60% | 15.9 | 0.52% |
| 48 | Connecticut | 1679.7 | 1681.9 | 1683.6 | 1696.1 | 1.00% | 16.4 | 0.32% |
| 49 | North Dakota | 434.6 | 430.2 | 434.6 | 437.7 | 0.70% | 3.1 | 0.24% |
| 50 | Louisiana | 1961.6 | 1954.3 | 1966.8 | 1971.6 | 0.50% | 10 | 0.17% |
| 51 | Alaska | 358.1 | 353.6 | 351.3 | 358.5 | 0.10% | 0.4 | 0.04% |
Methodology
Our study examined the change in jobs as estimated by the U.S. Bureau of Labor Statistics in metropolitan areas over the three year period from July 2016 to July 2019. We considered the percentage change in jobs for each metropolitan area using non-seasonally adjusted employment numbers, since we used comparable time periods for the starting and ending points of comparison.
We chose a three-year study period in order to minimize the impact of single-year fluctuations in job growth in order to provide a more comprehensive picture of the job growth situation in each metro area.
We also examined the growth rate for the 50 states, as well as Washington DC. We ranked the states based upon their percentage growth in jobs over a three year period.
Data Sources
[1] US Bureau of Labor Statistics Current Employment Statistics State and Area Estimates
[2] US Census Bureau Population Estimates Program