


Over the past two years, there have been significant changes in housing markets around the country as the coronavirus pandemic has caused major changes to the way Americans live and work. In some areas, housing prices have increased substantially, while in others, housing prices have flatlined or even decreased. In this analysis, AdvisorSmith examines the cities around the nation where housing prices have increased and decreased the most.
AdvisorSmith studied housing price data over a two-year period to understand the most significant changes in housing prices nationally. This study considered the impact of home price changes among 2- and 3-bedroom homes, which are the two most common housing unit sizes in the United States. Over the study period, home price growth was very strong nationwide, with prices growing on average 18.7% nationwide.

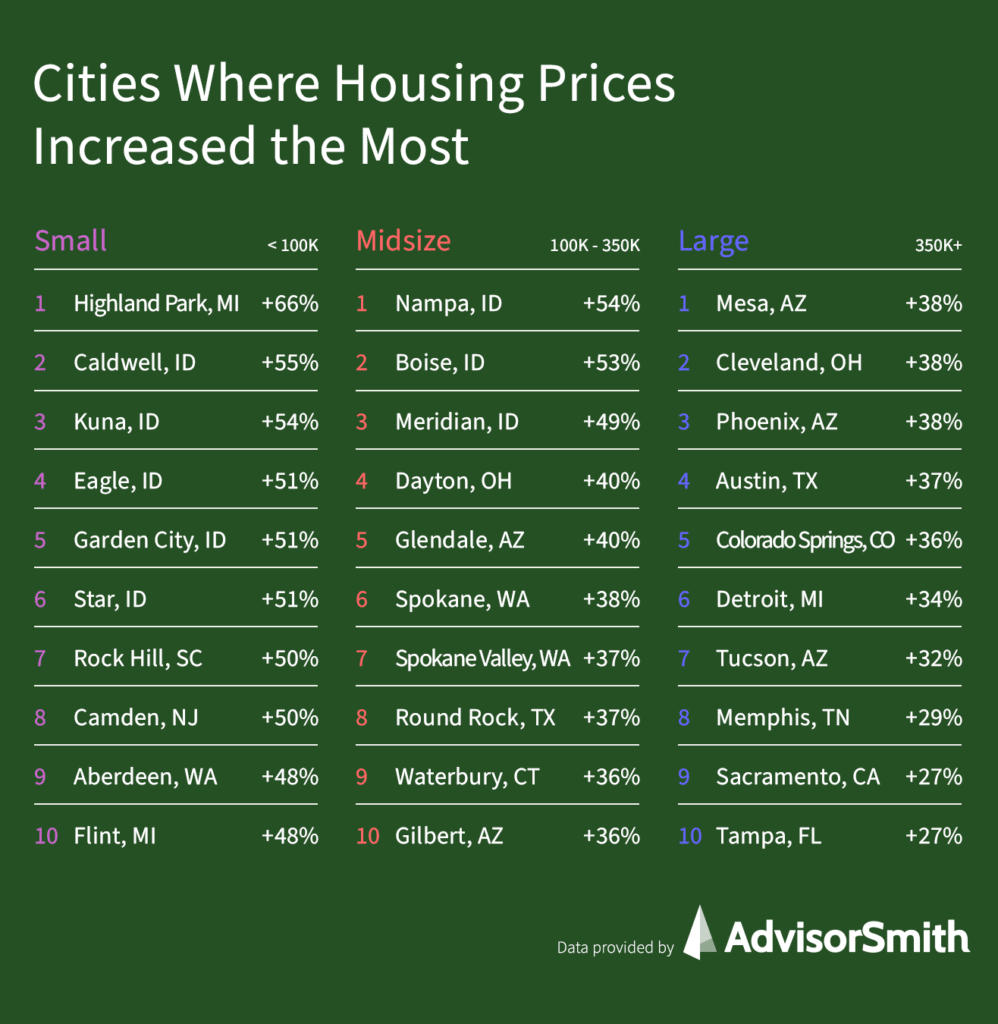
Cities Where Housing Prices Have Increased the Most: Large Cities
Among large cities (350,000 residents or more), the largest increases in housing prices came from smaller Sun Belt cities in Arizona, California, and Florida, along with midwestern cities that started with very low home prices such as Cleveland and Detroit. The top 10 cities had housing price increases between 26% and 38%.
| Rank | City | State | Home Price Increase (2019-2021) |
|---|---|---|---|
| 1 | Mesa | AZ | 38.00% |
| 2 | Cleveland | OH | 37.90% |
| 3 | Phoenix | AZ | 37.60% |
| 4 | Austin | TX | 37.30% |
| 5 | Colorado Springs | CO | 35.70% |
| 6 | Detroit | MI | 34.10% |
| 7 | Tucson | AZ | 31.60% |
| 8 | Memphis | TN | 29.30% |
| 9 | Sacramento | CA | 26.90% |
| 10 | Tampa | FL | 26.70% |
| 11 | Milwaukee | WI | 26.10% |
| 12 | Indianapolis | IN | 26.00% |
| 13 | San Diego | CA | 25.80% |
| 14 | Columbus | OH | 25.70% |
| 15 | Albuquerque | NM | 25.50% |
| 16 | Kansas City | MO | 25.40% |
| 17 | Charlotte | NC | 25.40% |
| 18 | Oakland | CA | 24.00% |
| 19 | Fresno | CA | 24.00% |
| 20 | Oklahoma City | OK | 23.80% |
| 21 | Fort Worth | TX | 22.90% |
| 22 | Bakersfield | CA | 22.60% |
| 23 | Jacksonville | FL | 22.40% |
| 24 | Omaha | NE | 22.40% |
| 25 | Arlington | TX | 22.30% |
| 26 | Wichita | KS | 21.60% |
| 27 | Long Beach | CA | 21.30% |
| 28 | Philadelphia | PA | 21.10% |
| 29 | Los Angeles | CA | 20.70% |
| 30 | Anaheim | CA | 20.30% |
| 31 | Raleigh | NC | 19.90% |
| 32 | Nashville | TN | 19.60% |
| 33 | Tulsa | OK | 18.90% |
| 34 | El Paso | TX | 18.20% |
| 35 | New Orleans | LA | 17.80% |
| 36 | Louisville | KY | 17.80% |
| 37 | Portland | OR | 17.70% |
| 38 | Aurora | CO | 17.60% |
| 39 | Atlanta | GA | 17.10% |
| 40 | San Antonio | TX | 16.60% |
| 41 | Virginia Beach | VA | 16.60% |
| 42 | Dallas | TX | 15.80% |
| 43 | Houston | TX | 15.50% |
| 44 | Seattle | WA | 15.50% |
| 45 | Las Vegas | NV | 15.20% |
| 46 | Denver | CO | 14.70% |
| 47 | Baltimore | MD | 13.70% |
| 48 | Minneapolis | MN | 13.40% |
| 49 | San Jose | CA | 13.40% |
| 50 | Miami | FL | 12.50% |
| 51 | Chicago | IL | 10.60% |
| 52 | Washington | DC | 9.40% |
| 53 | Boston | MA | 8.20% |
| 54 | San Francisco | CA | 3.30% |
| 55 | New York | NY | 2.60% |
Cities Where Housing Prices Have Increased the Most: Midsize Cities
Midsize cities (100,000 to 350,000 residents) in the Boise, Idaho, and Spokane, Washington, areas topped the list of cities where home prices rose the most, along with suburbs of the Phoenix and Austin areas. Among the top 10 cities, home prices rose between 36% and 54%.
| Rank | City | State | Home Price Increase (2019-2021) |
|---|---|---|---|
| 1 | Nampa | ID | 54.30% |
| 2 | Boise | ID | 52.80% |
| 3 | Meridian | ID | 49.20% |
| 4 | Dayton | OH | 40.30% |
| 5 | Glendale | AZ | 39.50% |
| 6 | Spokane | WA | 37.70% |
| 7 | Spokane Valley | WA | 36.90% |
| 8 | Round Rock | TX | 36.60% |
| 9 | Waterbury | CT | 36.40% |
| 10 | Gilbert | AZ | 35.90% |
| 11 | Clarksville | TN | 35.70% |
| 12 | Tempe | AZ | 35.70% |
| 13 | Birmingham | AL | 35.60% |
| 14 | Surprise | AZ | 34.90% |
| 15 | Chandler | AZ | 34.60% |
| 16 | Peoria | AZ | 34.40% |
| 17 | Scottsdale | AZ | 34.00% |
| 18 | Kansas City | KS | 33.30% |
| 19 | Tacoma | WA | 32.80% |
| 20 | Huntsville | AL | 32.70% |
| 21 | Bend | OR | 32.50% |
| 22 | Toledo | OH | 31.90% |
| 23 | Augusta | GA | 31.60% |
| 24 | Bridgeport | CT | 31.50% |
| 25 | West Valley City | UT | 30.80% |
| 26 | Elizabeth | NJ | 30.40% |
| 27 | Chula Vista | CA | 30.30% |
| 28 | Worcester | MA | 30.10% |
| 29 | West Jordan | UT | 29.70% |
| 30 | Buffalo | NY | 29.60% |
| 31 | Killeen | TX | 29.60% |
| 32 | Pueblo | CO | 29.00% |
| 33 | Clearwater | FL | 28.80% |
| 34 | Everett | WA | 28.60% |
| 35 | Syracuse | NY | 28.40% |
| 36 | San Bernardino | CA | 28.00% |
| 37 | Akron | OH | 28.00% |
| 38 | Stockton | CA | 28.00% |
| 39 | Lancaster | CA | 27.90% |
| 40 | Springfield | MA | 27.90% |
| 41 | Kent | WA | 27.80% |
| 42 | Salt Lake City | UT | 27.60% |
| 43 | Provo | UT | 27.60% |
| 44 | Winston-Salem | NC | 27.50% |
| 45 | Inglewood | CA | 27.30% |
| 46 | Manchester | NH | 27.20% |
| 47 | Palmdale | CA | 27.00% |
| 48 | El Cajon | CA | 27.00% |
| 49 | Escondido | CA | 26.90% |
| 50 | Knoxville | TN | 26.90% |
Cities Where Housing Prices Have Increased the Most: Small Cities
Similar trends were seen among small cities (less than 100,000 residents), with smaller cities in the same metro areas also experiencing the largest increases in home prices. Among the top 10 cities, home prices rose between 48% and 66%.
| Rank | City | State | Home Price Increase (2019-2021) |
|---|---|---|---|
| 1 | Highland Park | MI | 65.60% |
| 2 | Caldwell | ID | 54.90% |
| 3 | Kuna | ID | 53.70% |
| 4 | Eagle | ID | 51.30% |
| 5 | Garden City | ID | 50.90% |
| 6 | Star | ID | 50.80% |
| 7 | Rock Hill | SC | 50.10% |
| 8 | Camden | NJ | 49.50% |
| 9 | Aberdeen | WA | 47.90% |
| 10 | Flint | MI | 47.80% |
| 11 | Harvey | IL | 47.40% |
| 12 | Youngstown | OH | 44.70% |
| 13 | Gloucester City | NJ | 44.00% |
| 14 | El Mirage | AZ | 43.20% |
| 15 | Twentynine Palms | CA | 42.40% |
| 16 | Trotwood | OH | 39.70% |
| 17 | Trenton | NJ | 39.70% |
| 18 | Coolidge | AZ | 39.60% |
| 19 | Coeur d'Alene | ID | 39.50% |
| 20 | Hayden | ID | 39.50% |
| 21 | Maple Heights | OH | 39.50% |
| 22 | Fairfield | AL | 39.50% |
| 23 | East Orange | NJ | 39.20% |
| 24 | Avondale | AZ | 39.00% |
| 25 | Cedar Park | TX | 38.90% |
| 26 | Post Falls | ID | 38.70% |
| 27 | Riverdale | IL | 38.20% |
| 28 | Lakeway | TX | 38.20% |
| 29 | Shelton | WA | 38.10% |
| 30 | Forest Park | GA | 38.10% |
| 31 | Atlantic City | NJ | 38.00% |
| 32 | Pflugerville | TX | 37.90% |
| 33 | Hamtramck | MI | 37.80% |
| 34 | Central Falls | RI | 37.10% |
| 35 | Ogden | UT | 37.10% |
| 36 | Fountain | CO | 36.70% |
| 37 | Whitehall | OH | 36.70% |
| 38 | Waynesville | NC | 36.70% |
| 39 | Sauk Village | IL | 36.60% |
| 40 | Eloy | AZ | 36.50% |
| 41 | Pleasantville | NJ | 36.40% |
| 42 | Buckeye | AZ | 36.30% |
| 43 | Twin Falls | ID | 36.00% |
| 44 | Boone | NC | 36.00% |
| 45 | Apache Junction | AZ | 35.80% |
| 46 | Idaho Falls | ID | 35.80% |
| 47 | Conway | NH | 35.70% |
| 48 | Muskegon | MI | 35.50% |
| 49 | Anderson | IN | 35.40% |
| 50 | Struthers | OH | 35.40% |
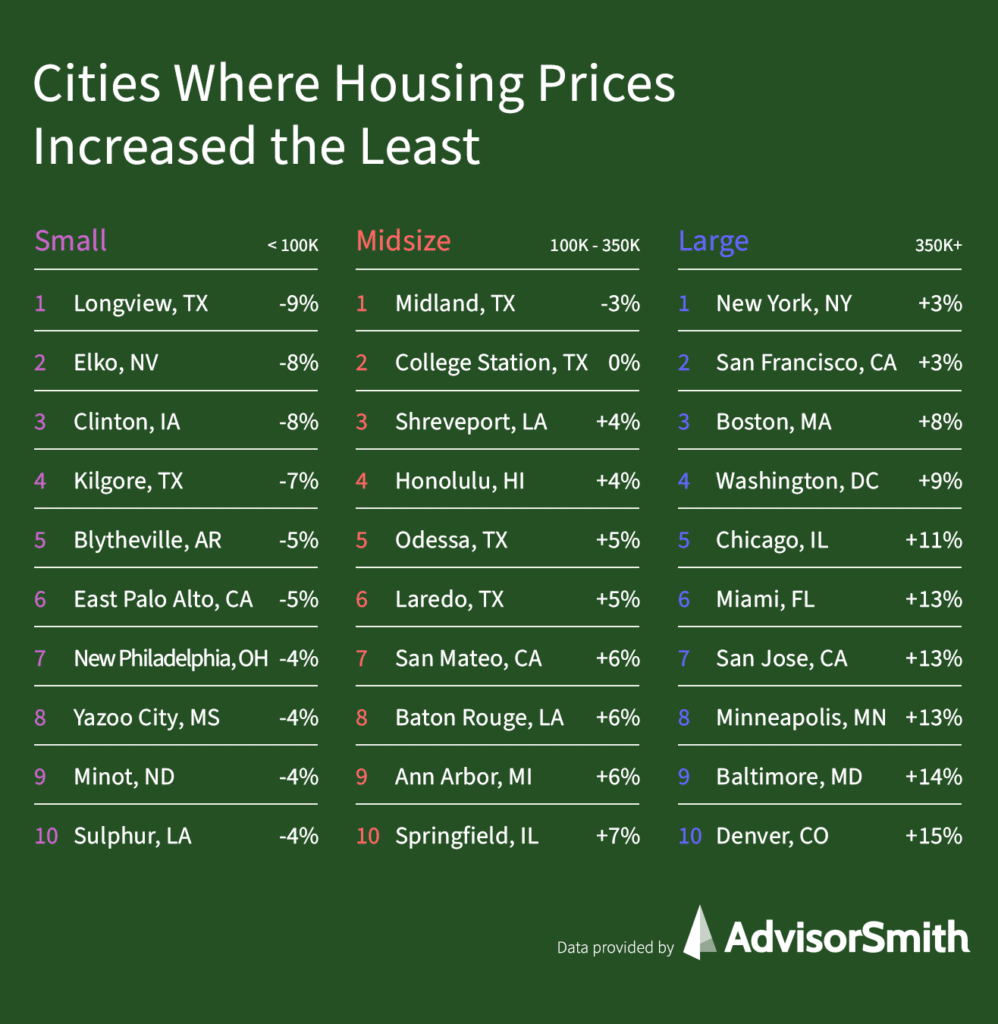
Cities Where Housing Prices Have Increased the Least: Large Cities
The nation’s most urban cities had the smallest increases in housing prices. These cities included New York City, San Francisco, Boston, Washington, D.C., and Chicago. Many residents moved away from these cities during the pandemic, as many of their residents were able to work remotely and sought out additional space further from city centers.
| Rank | City | State | Home Price Increase (2019-2021) |
|---|---|---|---|
| 1 | New York | NY | 2.60% |
| 2 | San Francisco | CA | 3.30% |
| 3 | Boston | MA | 8.20% |
| 4 | Washington | DC | 9.40% |
| 5 | Chicago | IL | 10.60% |
| 6 | Miami | FL | 12.50% |
| 7 | San Jose | CA | 13.40% |
| 8 | Minneapolis | MN | 13.40% |
| 9 | Baltimore | MD | 13.70% |
| 10 | Denver | CO | 14.70% |
| 11 | Las Vegas | NV | 15.20% |
| 12 | Seattle | WA | 15.50% |
| 13 | Houston | TX | 15.50% |
| 14 | Dallas | TX | 15.80% |
| 15 | Virginia Beach | VA | 16.60% |
| 16 | San Antonio | TX | 16.60% |
| 17 | Atlanta | GA | 17.10% |
| 18 | Aurora | CO | 17.60% |
| 19 | Portland | OR | 17.70% |
| 20 | Louisville | KY | 17.80% |
| 21 | New Orleans | LA | 17.80% |
| 22 | El Paso | TX | 18.20% |
| 23 | Tulsa | OK | 18.90% |
| 24 | Nashville | TN | 19.60% |
| 25 | Raleigh | NC | 19.90% |
| 26 | Anaheim | CA | 20.30% |
| 27 | Los Angeles | CA | 20.70% |
| 28 | Philadelphia | PA | 21.10% |
| 29 | Long Beach | CA | 21.30% |
| 30 | Wichita | KS | 21.60% |
| 31 | Arlington | TX | 22.30% |
| 32 | Omaha | NE | 22.40% |
| 33 | Jacksonville | FL | 22.40% |
| 34 | Bakersfield | CA | 22.60% |
| 35 | Fort Worth | TX | 22.90% |
| 36 | Oklahoma City | OK | 23.80% |
| 37 | Fresno | CA | 24.00% |
| 38 | Oakland | CA | 24.00% |
| 39 | Charlotte | NC | 25.40% |
| 40 | Kansas City | MO | 25.40% |
| 41 | Albuquerque | NM | 25.50% |
| 42 | Columbus | OH | 25.70% |
| 43 | San Diego | CA | 25.80% |
| 44 | Indianapolis | IN | 26.00% |
| 45 | Milwaukee | WI | 26.10% |
| 46 | Tampa | FL | 26.70% |
| 47 | Sacramento | CA | 26.90% |
| 48 | Memphis | TN | 29.30% |
| 49 | Tucson | AZ | 31.60% |
| 50 | Detroit | MI | 34.10% |
| 51 | Colorado Springs | CO | 35.70% |
| 52 | Austin | TX | 37.30% |
| 53 | Phoenix | AZ | 37.60% |
| 54 | Cleveland | OH | 37.90% |
| 55 | Mesa | AZ | 38.00% |
Cities Where Housing Prices Have Increased the Least: Midsize Cities
A variety of midsize cities were among those with the smallest increases in housing prices. Some cities, such as Midland and Odessa, Texas, were affected by the drop in oil prices. Other cities such as College Station, Texas, and Ann Arbor, Michigan, are college towns. Honolulu was affected by the drop in tourism revenues and the impact of the pandemic on the Hawaiian economy.
| Rank | City | State | Home Price Increase (2019-2021) |
|---|---|---|---|
| 1 | Midland | TX | -3.00% |
| 2 | College Station | TX | 0.20% |
| 3 | Shreveport | LA | 3.80% |
| 4 | Honolulu | HI | 4.00% |
| 5 | Odessa | TX | 4.70% |
| 6 | Laredo | TX | 4.80% |
| 7 | San Mateo | CA | 5.60% |
| 8 | Baton Rouge | LA | 5.60% |
| 9 | Ann Arbor | MI | 6.40% |
| 10 | Springfield | IL | 6.60% |
| 11 | Anchorage | AK | 6.80% |
| 12 | Lafayette | LA | 7.90% |
| 13 | Little Rock | AR | 8.40% |
| 14 | Pearland | TX | 8.40% |
| 15 | Sunnyvale | CA | 8.40% |
| 16 | Jersey City | NJ | 8.60% |
| 17 | Las Cruces | NM | 8.70% |
| 18 | Naperville | IL | 9.30% |
| 19 | Santa Clara | CA | 9.40% |
| 20 | Tuscaloosa | AL | 9.60% |
| 21 | Beaumont | TX | 10.10% |
| 22 | Peoria | IL | 10.20% |
| 23 | Irvine | CA | 10.50% |
| 24 | Arlington | VA | 10.60% |
| 25 | Fargo | ND | 10.70% |
| 26 | Jackson | MS | 10.70% |
| 27 | Yonkers | NY | 10.90% |
| 28 | Elgin | IL | 11.20% |
| 29 | Davenport | IA | 11.40% |
| 30 | Stamford | CT | 11.50% |
| 31 | Tyler | TX | 11.70% |
| 32 | Hialeah | FL | 11.70% |
| 33 | Lubbock | TX | 11.80% |
| 34 | Chico | CA | 11.80% |
| 35 | Fremont | CA | 11.80% |
| 36 | Cedar Rapids | IA | 12.00% |
| 37 | Cambridge | MA | 12.00% |
| 38 | Aurora | IL | 12.00% |
| 39 | Sandy Springs | GA | 12.40% |
| 40 | Sugar Land | TX | 12.50% |
| 41 | Daly City | CA | 12.60% |
| 42 | Santa Rosa | CA | 12.60% |
| 43 | Billings | MT | 12.60% |
| 44 | Antioch | CA | 12.80% |
| 45 | Fort Collins | CO | 12.80% |
| 46 | Charleston | SC | 13.10% |
| 47 | Boulder | CO | 13.10% |
| 48 | Davie | FL | 13.20% |
| 49 | Norman | OK | 13.60% |
| 50 | League City | TX | 13.70% |
Cities Where Housing Prices Have Increased the Least: Small Cities
Among small cities, the top 25 saw decreases in typical home prices, ranging from 0% to decreases of 9%.
| Rank | City | State | Home Price Increase (2019-2021) |
|---|---|---|---|
| 1 | Longview | TX | -9.20% |
| 2 | Elko | NV | -8.40% |
| 3 | Clinton | IA | -7.50% |
| 4 | Kilgore | TX | -6.60% |
| 5 | Blytheville | AR | -4.70% |
| 6 | East Palo Alto | CA | -4.50% |
| 7 | New Philadelphia | OH | -4.10% |
| 8 | Yazoo City | MS | -4.10% |
| 9 | Minot | ND | -4.00% |
| 10 | Sulphur | LA | -3.60% |
| 11 | Bossier City | LA | -2.30% |
| 12 | Pineville | LA | -2.10% |
| 13 | Liberal | KS | -2.10% |
| 14 | Wasilla | AK | -1.90% |
| 15 | Jamestown | ND | -1.40% |
| 16 | Sioux City | IA | -1.40% |
| 17 | Grand Forks | ND | -1.00% |
| 18 | Dover | OH | -0.80% |
| 19 | Meridian | MS | -0.70% |
| 20 | Carbondale | IL | -0.50% |
| 21 | Key Biscayne | FL | -0.40% |
| 22 | Northbrook | IL | -0.20% |
| 23 | Wilmette | IL | -0.20% |
| 24 | Hinsdale | IL | -0.10% |
| 25 | Great Neck | NY | 0.00% |
| 26 | Alexandria | LA | 0.10% |
| 27 | Sunny Isles Beach | FL | 0.10% |
| 28 | Gillette | WY | 0.20% |
| 29 | North Liberty | IA | 0.20% |
| 30 | Guttenberg | NJ | 0.20% |
| 31 | Richmond Hill | GA | 0.50% |
| 32 | Hoboken | NJ | 0.50% |
| 33 | Mandan | ND | 0.70% |
| 34 | Bay City | TX | 0.80% |
| 35 | Gatesville | TX | 0.80% |
| 36 | Dickinson | ND | 0.80% |
| 37 | Forrest City | AR | 0.90% |
| 38 | Bellaire | TX | 1.10% |
| 39 | Lake Charles | LA | 1.20% |
| 40 | Coralville | IA | 1.30% |
| 41 | Charleston | IL | 1.30% |
| 42 | Mattoon | IL | 1.60% |
| 43 | Winnetka | IL | 1.70% |
| 44 | Oak Park | IL | 1.90% |
| 45 | Kewanee | IL | 2.00% |
| 46 | Williston | ND | 2.10% |
| 47 | Marshall | TX | 2.10% |
| 48 | Glenview | IL | 2.20% |
| 49 | Aventura | FL | 2.40% |
| 50 | Western Springs | IL | 2.40% |
Methodology
AdvisorSmith studied the cities in which home prices increased the most and least over the two-year period between May 2019 and May 2021. We determined the increase in housing prices by using home price data as measured by the Zillow Home Value Index, which measures the value of a typical home in cities around the nation. We examined typical home values at the city level, which reflects the legal boundaries of cities, not metropolitan areas.
To determine the cities in which home prices increased the most and least, we compared the home prices for 2-bedroom and 3-bedroom homes in each of the cities and measured the percentage change in home prices over the 2-year study period. We took a weighted average of the change in home prices for 2-bedroom and 3-bedroom housing units. We weighted the change in home prices of 3-bedroom homes more heavily since it is the most common housing configuration in the United States.
We then subdivided the cities into one of three groups based upon the population of each city. Large cities were those with at least 350,000 residents. Midsize cities were cities with between 100,000 and 350,000 residents. Small cities were those with between 10,000 and 100,000 residents. Within each of the population bands, we ranked the cities by the increase (or decrease) in housing prices over the two-year study period to find the cities where housing prices have increased the most.
Sources
- Zillow Home Value Index (Data Provided by Zillow Group)
- U.S. Census Bureau, American Community Survey