


Citizens around the country have recently been re-examining the role and practices of policing in their cities. With policing needs and crime levels varying widely around the country, cities take a variety of approaches to public safety. One reflection of the role of police in different cities is the level of funding allocated to police in each city, and this is an active debate currently occurring in cities nationwide.
In this study, AdvisorSmith examined police budgets in 301 of the largest U.S. cities. We considered cities with populations of 100,000 or more, and we found the cities that spend the highest and lowest proportion of their city budgets on policing. We also found the cities which spend the most on police on a per-capita basis when adjusted for differences in the cost of living in each city.
Our study found that the average police expenditure among the largest 301 cities was 19% of city budgets. However, the range of spending was very wide, with cities spending as little at 4.6% of the budget and up to 51% at the high end. Additionally, cities spent an average of $407 per resident on police services. This figure also had significant variability, ranging from a low of $150 per resident up to a high of $913 per resident.
This study was based upon data from the Annual Survey of State and Local Government Finances which is conducted annually by the U.S. Census Bureau. We examined municipal and county budgets from 2017, which is the most recent survey data available. Since cities and counties vary in terms of the proportion of services they provide, we normalized cities around the country by allocating a proportion of county-level spend to each city. Read on to discover the cities that spend the most and least on police services.
Police Spending As a Percentage of City Budget
These are the top and bottom 15 cities for the proportion of city budgets spent on the police. These figures are adjusted to account for both direct city expenditure as well as county-level expenditures on behalf of cities.

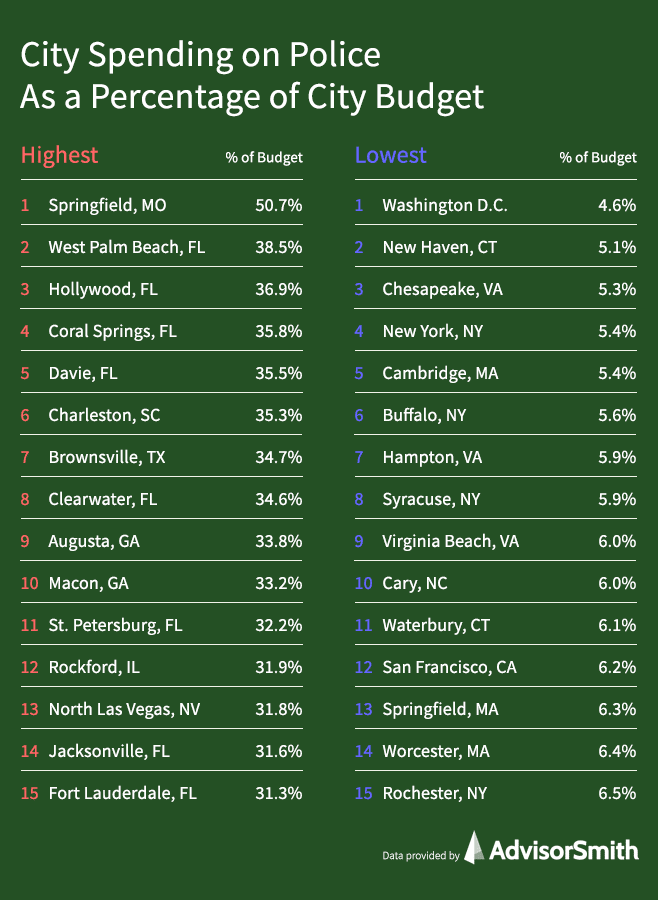
Of the top 15 cities spending the highest proportion of their budget on policing, eight were cities located in Florida. These cities not only devoted large portions of their budgets to police expenditures, but they also spent high amounts on a per-capita basis as well. This was also the case for other top cities such as Springfield, MO, and Charleston, SC. A few of the highest spending cities, including Brownsville, TX; Augusta, GA; and Macon, GA, were cities that spent little on policing on a per-capita basis but had small budgets overall, so policing took a disproportionately high percentage of the city budgets.
Of the 15 cities spending the lowest proportion of their budget on policing, approximately half were cities that also spent small amounts on a per-capita basis. Most of these cities were in the Northeast, Virginia, or North Carolina. The remaining cities were those that spent large amounts on policing on a per-capita basis, but where city budgets were relatively larger from providing other types of city services such as housing and education, which reduced the proportion of city spending on policing. These cities included Washington D.C.; New York City; Syracuse, NY; and Rochester, NY.
In the table below, we rank cities based upon the percentage of their budget that is spent on police. We provide data on the size of each city’s adjusted budget, as well as their adjusted spending on police, and the percentage of the budget that is spent on policing. The cities are also ranked from highest to lowest percentage of budget spent on police. The adjusted budgets and police spending include both direct city expenditures as well as the city’s population-adjusted proportion of county expenditures.
| Rank | City | State | City Budget ($MM) | Police Spending ($MM) | Police Spending (% of Budget) |
|---|---|---|---|---|---|
| 1 | Springfield | MO | $154.43 | $78.31 | 50.7% |
| 2 | West Palm Beach | FL | $225.80 | $87.01 | 38.5% |
| 3 | Hollywood | FL | $281.35 | $103.70 | 36.9% |
| 4 | Coral Springs | FL | $219.09 | $78.39 | 35.8% |
| 5 | Davie | FL | $185.39 | $65.79 | 35.5% |
| 6 | Charleston | SC | $227.33 | $80.15 | 35.3% |
| 7 | Brownsville | TX | $122.82 | $42.61 | 34.7% |
| 8 | Clearwater | FL | $188.44 | $65.15 | 34.6% |
| 9 | Augusta | GA | $124.14 | $41.99 | 33.8% |
| 10 | Macon | GA | $75.63 | $25.14 | 33.2% |
| 11 | St. Petersburg | FL | $488.79 | $157.59 | 32.2% |
| 12 | Rockford | IL | $258.81 | $82.68 | 31.9% |
| 13 | North Las Vegas | NV | $502.05 | $159.67 | 31.8% |
| 14 | Jacksonville | FL | $1,100.52 | $348.26 | 31.6% |
| 15 | Fort Lauderdale | FL | $448.73 | $140.27 | 31.3% |
| 16 | Fort Wayne | IN | $248.25 | $76.55 | 30.8% |
| 17 | Athens | GA | $88.60 | $27.14 | 30.6% |
| 18 | Vista | CA | $245.75 | $74.19 | 30.2% |
| 19 | Antioch | CA | $163.22 | $49.07 | 30.1% |
| 20 | Lafayette | LA | $296.36 | $89.03 | 30.0% |
| 21 | Aurora | IL | $275.76 | $82.46 | 29.9% |
| 22 | Independence | MO | $140.92 | $41.98 | 29.8% |
| 23 | Elgin | IL | $158.02 | $46.06 | 29.1% |
| 24 | Tucson | AZ | $984.71 | $285.92 | 29.0% |
| 25 | Boise | ID | $247.76 | $71.47 | 28.8% |
| 26 | Concord | CA | $242.83 | $68.61 | 28.3% |
| 27 | North Charleston | SC | $214.49 | $60.43 | 28.2% |
| 28 | Naperville | IL | $258.62 | $72.37 | 28.0% |
| 29 | Columbus | GA | $168.62 | $46.81 | 27.8% |
| 30 | Huntington Beach | CA | $372.51 | $103.28 | 27.7% |
| 31 | Omaha | NE | $528.92 | $146.13 | 27.6% |
| 32 | Pompano Beach | FL | $242.83 | $66.97 | 27.6% |
| 33 | Anaheim | CA | $661.45 | $181.35 | 27.4% |
| 34 | Henderson | NV | $649.71 | $176.89 | 27.2% |
| 35 | Miramar | FL | $262.35 | $70.94 | 27.0% |
| 36 | Centennial | CO | $111.06 | $29.69 | 26.7% |
| 37 | Evansville | IN | $155.34 | $41.48 | 26.7% |
| 38 | Colorado Springs | CO | $534.91 | $141.90 | 26.5% |
| 39 | Orlando | FL | $734.99 | $193.64 | 26.3% |
| 40 | Odessa | TX | $110.73 | $29.16 | 26.3% |
| 41 | Warren | MI | $184.09 | $48.47 | 26.3% |
| 42 | Milwaukee | WI | $1,299.97 | $338.85 | 26.1% |
| 43 | Glendale | CA | $450.00 | $116.20 | 25.8% |
| 44 | Stockton | CA | $580.35 | $149.83 | 25.8% |
| 45 | Tacoma | WA | $428.27 | $108.76 | 25.4% |
| 46 | Mesa | AZ | $733.06 | $184.96 | 25.2% |
| 47 | Cincinnati | OH | $734.76 | $184.00 | 25.0% |
| 48 | Joliet | IL | $206.88 | $51.77 | 25.0% |
| 49 | Garland | TX | $206.67 | $51.70 | 25.0% |
| 50 | Lakewood | CO | $285.11 | $71.22 | 25.0% |
| 51 | Moreno Valley | CA | $463.97 | $115.70 | 24.9% |
| 52 | Las Vegas | NV | $1,422.74 | $354.31 | 24.9% |
| 53 | Springfield | IL | $241.92 | $59.74 | 24.7% |
| 54 | Los Angeles | CA | $11,971.21 | $2,954.10 | 24.7% |
| 55 | Richmond | CA | $322.77 | $79.53 | 24.6% |
| 56 | Oxnard | CA | $417.53 | $102.57 | 24.6% |
| 57 | Tyler | TX | $132.02 | $32.43 | 24.6% |
| 58 | Tempe | AZ | $399.59 | $98.06 | 24.5% |
| 59 | Albuquerque | NM | $857.19 | $210.23 | 24.5% |
| 60 | Thousand Oaks | CA | $321.85 | $78.87 | 24.5% |
| 61 | Laredo | TX | $342.33 | $83.75 | 24.5% |
| 62 | Tampa | FL | $860.18 | $210.10 | 24.4% |
| 63 | Riverside | CA | $647.64 | $158.18 | 24.4% |
| 64 | Fullerton | CA | $241.37 | $58.89 | 24.4% |
| 65 | Dayton | OH | $269.47 | $65.71 | 24.4% |
| 66 | Savannah | GA | $341.97 | $83.23 | 24.3% |
| 67 | Pasadena | CA | $413.44 | $100.40 | 24.3% |
| 68 | Lubbock | TX | $369.17 | $88.83 | 24.1% |
| 69 | Costa Mesa | CA | $219.24 | $52.54 | 24.0% |
| 70 | Torrance | CA | $445.86 | $106.40 | 23.9% |
| 71 | Vancouver | WA | $215.18 | $51.19 | 23.8% |
| 72 | Oklahoma City | OK | $924.86 | $219.74 | 23.8% |
| 73 | Santa Ana | CA | $670.05 | $158.66 | 23.7% |
| 74 | Cleveland | OH | $1,158.43 | $273.66 | 23.6% |
| 75 | Miami Gardens | FL | $244.99 | $57.87 | 23.6% |
| 76 | Miami | FL | $1,374.86 | $320.54 | 23.3% |
| 77 | Tallahassee | FL | $350.30 | $81.38 | 23.2% |
| 78 | Jurupa Valley | CA | $158.89 | $36.83 | 23.2% |
| 79 | Norman | OK | $123.48 | $28.58 | 23.1% |
| 80 | Eugene | OR | $271.12 | $62.63 | 23.1% |
| 81 | St. Louis | MO | $824.43 | $190.42 | 23.1% |
| 82 | Corpus Christi | TX | $413.30 | $95.27 | 23.1% |
| 83 | Roseville | CA | $259.64 | $59.59 | 22.9% |
| 84 | Oakland | CA | $1,324.19 | $303.22 | 22.9% |
| 85 | Chandler | AZ | $529.38 | $121.16 | 22.9% |
| 86 | Palm Bay | FL | $133.97 | $30.43 | 22.7% |
| 87 | Aurora | CO | $564.85 | $128.20 | 22.7% |
| 88 | Port St. Lucie | FL | $299.06 | $67.08 | 22.4% |
| 89 | Glendale | AZ | $446.07 | $99.97 | 22.4% |
| 90 | Daly City | CA | $218.11 | $48.83 | 22.4% |
| 91 | Waco | TX | $200.70 | $44.81 | 22.3% |
| 92 | South Bend | IN | $157.33 | $35.06 | 22.3% |
| 93 | Vallejo | CA | $296.90 | $65.76 | 22.1% |
| 94 | San Mateo | CA | $247.45 | $54.28 | 21.9% |
| 95 | Atlanta | GA | $961.16 | $210.73 | 21.9% |
| 96 | Hillsboro | OR | $199.73 | $43.71 | 21.9% |
| 97 | San Bernardino | CA | $427.19 | $93.10 | 21.8% |
| 98 | Las Cruces | NM | $161.71 | $35.12 | 21.7% |
| 99 | Austin | TX | $1,875.13 | $406.47 | 21.7% |
| 100 | Inglewood | CA | $385.17 | $83.48 | 21.7% |
| 101 | Indianapolis | IN | $1,019.38 | $220.43 | 21.6% |
| 102 | Lakeland | FL | $249.15 | $53.80 | 21.6% |
| 103 | Overland Park | KS | $280.28 | $60.47 | 21.6% |
| 104 | Killeen | TX | $150.92 | $32.52 | 21.5% |
| 105 | Downey | CA | $269.65 | $58.10 | 21.5% |
| 106 | Fairfield | CA | $278.24 | $59.87 | 21.5% |
| 107 | Plano | TX | $334.26 | $71.89 | 21.5% |
| 108 | Sacramento | CA | $1,154.92 | $247.98 | 21.5% |
| 109 | Garden Grove | CA | $328.24 | $70.34 | 21.4% |
| 110 | Pembroke Pines | FL | $433.00 | $92.49 | 21.4% |
| 111 | Clovis | CA | $232.63 | $49.62 | 21.3% |
| 112 | Beaumont | TX | $217.87 | $46.46 | 21.3% |
| 113 | Peoria | IL | $203.03 | $43.27 | 21.3% |
| 114 | Provo | UT | $81.77 | $17.33 | 21.2% |
| 115 | Rialto | CA | $223.53 | $47.22 | 21.1% |
| 116 | Salt Lake City | UT | $506.96 | $106.41 | 21.0% |
| 117 | Pomona | CA | $390.94 | $81.98 | 21.0% |
| 118 | Phoenix | AZ | $2,345.88 | $485.61 | 20.7% |
| 119 | Midland | TX | $174.65 | $36.12 | 20.7% |
| 120 | Toledo | OH | $689.35 | $141.82 | 20.6% |
| 121 | Irvine | CA | $470.65 | $96.82 | 20.6% |
| 122 | Fontana | CA | $400.38 | $82.32 | 20.6% |
| 123 | Orange | CA | $271.37 | $55.61 | 20.5% |
| 124 | Montgomery | AL | $269.76 | $55.09 | 20.4% |
| 125 | Pasadena | TX | $265.70 | $54.13 | 20.4% |
| 126 | Fresno | CA | $1,134.47 | $231.04 | 20.4% |
| 127 | Ontario | CA | $558.74 | $113.50 | 20.3% |
| 128 | Oceanside | CA | $364.23 | $73.99 | 20.3% |
| 129 | Hialeah | FL | $509.71 | $103.44 | 20.3% |
| 130 | Jackson | MS | $203.49 | $41.13 | 20.2% |
| 131 | Long Beach | CA | $1,639.25 | $329.34 | 20.1% |
| 132 | Chicago | IL | $7,414.28 | $1,485.67 | 20.0% |
| 133 | Green Bay | WI | $185.29 | $37.09 | 20.0% |
| 134 | Peoria | AZ | $263.26 | $52.67 | 20.0% |
| 135 | West Covina | CA | $275.57 | $55.12 | 20.0% |
| 136 | Murrieta | CA | $232.07 | $46.19 | 19.9% |
| 137 | Scottsdale | AZ | $517.38 | $102.68 | 19.8% |
| 138 | Columbia | MO | $117.99 | $23.22 | 19.7% |
| 139 | Wichita Falls | TX | $139.19 | $27.34 | 19.6% |
| 140 | Broken Arrow | OK | $128.16 | $25.16 | 19.6% |
| 141 | Pueblo | CO | $200.62 | $39.38 | 19.6% |
| 142 | Sterling Heights | MI | $187.33 | $36.63 | 19.6% |
| 143 | Burbank | CA | $375.18 | $73.18 | 19.5% |
| 144 | Elk Grove | CA | $336.32 | $65.50 | 19.5% |
| 145 | Houston | TX | $4,575.80 | $889.76 | 19.4% |
| 146 | Hayward | CA | $406.19 | $78.93 | 19.4% |
| 147 | Fort Worth | TX | $1,558.30 | $302.53 | 19.4% |
| 148 | Little Rock | AR | $386.66 | $74.99 | 19.4% |
| 149 | Simi Valley | CA | $280.94 | $54.47 | 19.4% |
| 150 | San Buenaventura | CA | $286.23 | $55.39 | 19.4% |
| 151 | Lewisville | TX | $145.25 | $28.10 | 19.3% |
| 152 | El Cajon | CA | $208.62 | $40.19 | 19.3% |
| 153 | Santa Maria | CA | $229.44 | $44.18 | 19.3% |
| 154 | Mcallen | TX | $200.74 | $38.54 | 19.2% |
| 155 | Gilbert | AZ | $320.91 | $61.49 | 19.2% |
| 156 | Santa Clara | CA | $382.64 | $73.28 | 19.2% |
| 157 | Spokane | WA | $387.27 | $73.05 | 18.9% |
| 158 | Everett | WA | $214.29 | $40.16 | 18.7% |
| 159 | Shreveport | LA | $431.71 | $80.44 | 18.6% |
| 160 | Birmingham | AL | $594.33 | $110.41 | 18.6% |
| 161 | Escondido | CA | $302.07 | $56.10 | 18.6% |
| 162 | Lansing | MI | $261.61 | $48.58 | 18.6% |
| 163 | Des Moines | IA | $389.70 | $71.93 | 18.5% |
| 164 | Tulsa | OK | $598.41 | $109.96 | 18.4% |
| 165 | Berkeley | CA | $398.79 | $73.19 | 18.4% |
| 166 | Kansas City | MO | $1,374.63 | $252.25 | 18.4% |
| 167 | Pearland | TX | $147.20 | $26.98 | 18.3% |
| 168 | Billings | MT | $151.96 | $27.72 | 18.2% |
| 169 | Arlington | TX | $614.84 | $111.40 | 18.1% |
| 170 | Gainesville | FL | $308.80 | $55.84 | 18.1% |
| 171 | Grand Prairie | TX | $290.50 | $52.26 | 18.0% |
| 172 | Baton Rouge | LA | $860.88 | $153.45 | 17.8% |
| 173 | Topeka | KS | $273.98 | $48.75 | 17.8% |
| 174 | West Jordan | UT | $128.54 | $22.84 | 17.8% |
| 175 | Mesquite | TX | $214.78 | $37.86 | 17.6% |
| 176 | Chula Vista | CA | $485.48 | $85.34 | 17.6% |
| 177 | Salem | OR | $294.64 | $51.36 | 17.4% |
| 178 | Ann Arbor | MI | $250.73 | $43.49 | 17.3% |
| 179 | Renton | WA | $191.52 | $33.15 | 17.3% |
| 180 | Mobile | AL | $376.26 | $64.57 | 17.2% |
| 181 | Amarillo | TX | $343.99 | $58.80 | 17.1% |
| 182 | Columbia | SC | $326.78 | $55.83 | 17.1% |
| 183 | Cape Coral | FL | $409.30 | $69.47 | 17.0% |
| 184 | Sunnyvale | CA | $411.10 | $69.38 | 16.9% |
| 185 | El Monte | CA | $282.36 | $47.64 | 16.9% |
| 186 | Modesto | CA | $443.44 | $74.81 | 16.9% |
| 187 | Kent | WA | $232.48 | $39.18 | 16.9% |
| 188 | Louisville | KY | $1,087.28 | $183.16 | 16.8% |
| 189 | Reno | NV | $565.42 | $94.27 | 16.7% |
| 190 | Round Rock | TX | $183.25 | $30.50 | 16.6% |
| 191 | Davenport | IA | $172.04 | $28.45 | 16.5% |
| 192 | Greeley | CO | $175.84 | $29.02 | 16.5% |
| 193 | Corona | CA | $480.07 | $78.94 | 16.4% |
| 194 | College Station | TX | $118.48 | $19.38 | 16.4% |
| 195 | Thornton | CO | $267.03 | $43.43 | 16.3% |
| 196 | Temecula | CA | $297.07 | $48.30 | 16.3% |
| 197 | Newark | NJ | $986.10 | $159.37 | 16.2% |
| 198 | Dallas | TX | $2,651.43 | $427.10 | 16.1% |
| 199 | Rancho Cucamonga | CA | $386.75 | $61.81 | 16.0% |
| 200 | San Antonio | TX | $2,703.44 | $432.04 | 16.0% |
| 201 | Palmdale | CA | $346.86 | $54.91 | 15.8% |
| 202 | Memphis | TN | $2,330.92 | $366.30 | 15.7% |
| 203 | Baltimore | MD | $3,174.03 | $496.77 | 15.7% |
| 204 | Santa Rosa | CA | $523.61 | $81.75 | 15.6% |
| 205 | Lancaster | CA | $393.31 | $61.18 | 15.6% |
| 206 | Wichita | KS | $677.25 | $104.57 | 15.4% |
| 207 | Jersey City | NJ | $748.83 | $114.28 | 15.3% |
| 208 | Gresham | OR | $226.38 | $34.50 | 15.2% |
| 209 | Olathe | KS | $293.70 | $44.46 | 15.1% |
| 210 | Fort Collins | CO | $367.86 | $55.47 | 15.1% |
| 211 | Madison | WI | $598.82 | $90.18 | 15.1% |
| 212 | St. Paul | MN | $933.44 | $140.38 | 15.0% |
| 213 | West Valley | UT | $203.53 | $30.30 | 14.9% |
| 214 | Denver | CO | $1,601.67 | $236.68 | 14.8% |
| 215 | Grand Rapids | MI | $430.90 | $63.33 | 14.7% |
| 216 | Akron | OH | $454.95 | $66.75 | 14.7% |
| 217 | El Paso | TX | $1,087.06 | $158.98 | 14.6% |
| 218 | Elizabeth | NJ | $359.21 | $52.52 | 14.6% |
| 219 | Fremont | CA | $594.99 | $86.93 | 14.6% |
| 220 | Salinas | CA | $440.90 | $64.28 | 14.6% |
| 221 | Bridgeport | CT | $759.87 | $110.36 | 14.5% |
| 222 | Cedar Rapids | IA | $351.96 | $51.09 | 14.5% |
| 223 | Chattanooga | TN | $525.33 | $75.61 | 14.4% |
| 224 | Columbus | OH | $2,482.98 | $356.55 | 14.4% |
| 225 | Victorville | CA | $284.51 | $40.83 | 14.4% |
| 226 | San Angelo | TX | $167.04 | $23.90 | 14.3% |
| 227 | Carlsbad | CA | $310.29 | $44.39 | 14.3% |
| 228 | Allentown | PA | $250.63 | $35.67 | 14.2% |
| 229 | Surprise | AZ | $220.44 | $31.09 | 14.1% |
| 230 | Visalia | CA | $322.22 | $45.35 | 14.1% |
| 231 | Denton | TX | $243.58 | $34.23 | 14.1% |
| 232 | Irving | TX | $438.96 | $61.57 | 14.0% |
| 233 | Wilmington | NC | $368.43 | $51.25 | 13.9% |
| 234 | Norwalk | CA | $250.61 | $34.85 | 13.9% |
| 235 | Mckinney | TX | $225.17 | $31.07 | 13.8% |
| 236 | Providence | RI | $692.99 | $94.87 | 13.7% |
| 237 | Sioux Falls | SD | $276.86 | $37.88 | 13.7% |
| 238 | San Diego | CA | $3,333.04 | $453.15 | 13.6% |
| 239 | Richardson | TX | $210.06 | $28.47 | 13.6% |
| 240 | Bellevue | WA | $376.55 | $50.98 | 13.5% |
| 241 | Bakersfield | CA | $908.55 | $121.82 | 13.4% |
| 242 | Portland | OR | $1,645.45 | $219.63 | 13.3% |
| 243 | Huntsville | AL | $425.57 | $56.53 | 13.3% |
| 244 | Abilene | TX | $247.01 | $32.77 | 13.3% |
| 245 | Honolulu | HI | $2,085.72 | $276.38 | 13.3% |
| 246 | Boulder | CO | $399.55 | $52.29 | 13.1% |
| 247 | Lexington | KY | $430.06 | $56.27 | 13.1% |
| 248 | Santa Clarita | CA | $455.38 | $58.87 | 12.9% |
| 249 | Carrollton | TX | $208.32 | $25.92 | 12.4% |
| 250 | San Jose | CA | $2,828.94 | $347.23 | 12.3% |
| 251 | Stamford | CT | $505.51 | $61.88 | 12.2% |
| 252 | Paterson | NJ | $459.28 | $56.08 | 12.2% |
| 253 | Durham | NC | $745.78 | $91.03 | 12.2% |
| 254 | Fayetteville | NC | $619.84 | $75.51 | 12.2% |
| 255 | Philadelphia | PA | $5,655.75 | $670.32 | 11.9% |
| 256 | Detroit | MI | $2,426.90 | $284.40 | 11.7% |
| 257 | Knoxville | TN | $597.44 | $69.45 | 11.6% |
| 258 | Lincoln | NE | $441.27 | $51.28 | 11.6% |
| 259 | Minneapolis | MN | $1,685.51 | $193.45 | 11.5% |
| 260 | Charlotte | NC | $3,260.44 | $364.88 | 11.2% |
| 261 | Kansas City | KS | $437.78 | $48.65 | 11.1% |
| 262 | Sandy Springs | GA | $235.90 | $26.10 | 11.1% |
| 263 | Boston | MA | $3,374.02 | $369.82 | 11.0% |
| 264 | Westminster | CO | $278.96 | $30.51 | 10.9% |
| 265 | High Point | NC | $337.43 | $36.39 | 10.8% |
| 266 | Alexandria | VA | $866.36 | $91.42 | 10.6% |
| 267 | Seattle | WA | $2,572.85 | $267.70 | 10.4% |
| 268 | Greensboro | NC | $946.00 | $98.42 | 10.4% |
| 269 | Winston-Salem | NC | $879.26 | $88.52 | 10.1% |
| 270 | Pittsburgh | PA | $1,114.20 | $108.84 | 9.8% |
| 271 | Clarksville | TN | $382.96 | $36.04 | 9.4% |
| 272 | New Orleans | LA | $890.37 | $83.60 | 9.4% |
| 273 | Frisco | TX | $354.19 | $33.07 | 9.3% |
| 274 | Rochester | MN | $394.17 | $35.94 | 9.1% |
| 275 | Richmond | VA | $1,059.44 | $94.97 | 9.0% |
| 276 | Anchorage | AK | $1,404.48 | $124.35 | 8.9% |
| 277 | Raleigh | NC | $1,518.86 | $124.71 | 8.2% |
| 278 | Manchester | NH | $309.35 | $24.49 | 7.9% |
| 279 | Murfreesboro | TN | $482.03 | $37.15 | 7.7% |
| 280 | Lowell | MA | $357.74 | $25.88 | 7.2% |
| 281 | Norfolk | VA | $1,056.78 | $73.62 | 7.0% |
| 282 | Fargo | ND | $386.10 | $26.58 | 6.9% |
| 283 | Nashville | TN | $2,881.91 | $197.45 | 6.9% |
| 284 | Hartford | CT | $795.52 | $53.36 | 6.7% |
| 285 | Newport News | VA | $781.72 | $50.97 | 6.5% |
| 286 | Yonkers | NY | $1,628.00 | $106.08 | 6.5% |
| 287 | Rochester | NY | $1,739.35 | $112.31 | 6.5% |
| 288 | Worcester | MA | $743.11 | $47.60 | 6.4% |
| 289 | Springfield | MA | $699.20 | $44.20 | 6.3% |
| 290 | San Francisco | CA | $8,454.63 | $524.93 | 6.2% |
| 291 | Waterbury | CT | $549.38 | $33.26 | 6.1% |
| 292 | Cary | NC | $539.60 | $32.29 | 6.0% |
| 293 | Virginia Beach | VA | $1,630.18 | $97.55 | 6.0% |
| 294 | Syracuse | NY | $991.80 | $58.79 | 5.9% |
| 295 | Hampton | VA | $509.50 | $29.86 | 5.9% |
| 296 | Buffalo | NY | $1,782.62 | $100.20 | 5.6% |
| 297 | Cambridge | MA | $700.95 | $38.08 | 5.4% |
| 298 | New York | NY | $99,982.17 | $5,423.43 | 5.4% |
| 299 | Chesapeake | VA | $860.99 | $46.06 | 5.3% |
| 300 | New Haven | CT | $816.92 | $41.38 | 5.1% |
| 301 | Washington DC | DC | $13,236.02 | $613.75 | 4.6% |
Police Spending on a Per-capita Basis
In the graphic below, we list the 15 cities that spend the most and least per resident on policing when adjusted for the cost of living.

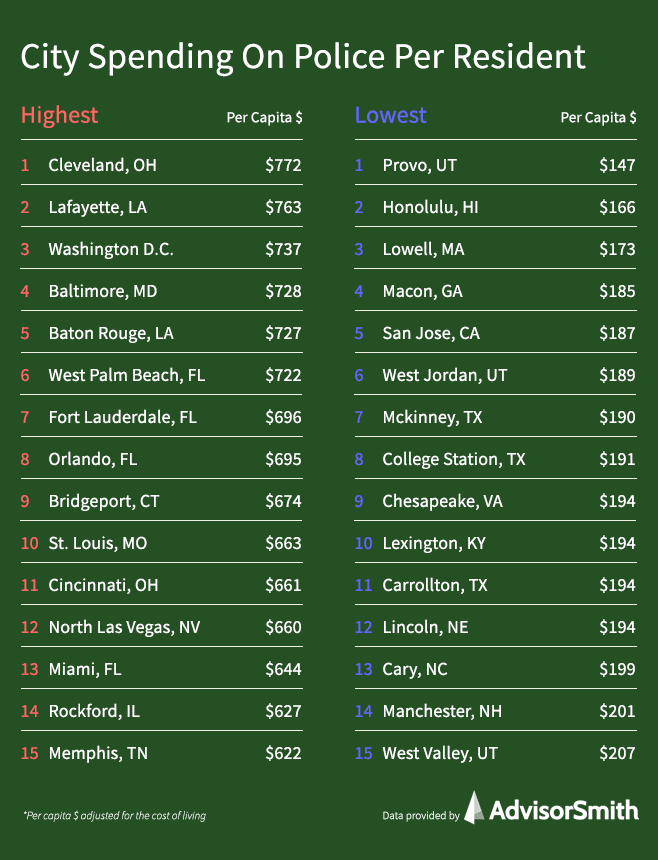
Cities spending the most per capita on policing, after adjusting for the cost of living, included the major cities of Cleveland, OH; Washington D.C.; Baltimore, MD; Miami, FL; St. Louis, MO; Orlando, FL; and Memphis, TN. Other cities in Florida also made the top 15, including West Palm Beach and Fort Lauderdale. Cities spending the least on policing per capita, adjusted for cost of living, included San Jose, CA; Honolulu, HI; and Provo, UT.
The table below shows cities ranked based upon how much they spend on police on a per-capita basis when adjusted for the cost of living in each city. We display the amount spent in each city on a per-capita basis, as well as the adjusted figure which considers the cost of living. These figures include spending both directly from the city as well as spending at the overlying county level that benefits the city.
| Rank | City | State | Police Spending (per capita $) | Police Spending (per capita $, adjusted for cost of living) |
|---|---|---|---|---|
| 1 | Cleveland | OH | $705.18 | $771.54 |
| 2 | Lafayette | LA | $697.38 | $763.00 |
| 3 | Washington DC | DC | $913.00 | $737.48 |
| 4 | Baltimore | MD | $798.86 | $728.22 |
| 5 | Baton Rouge | LA | $671.27 | $727.27 |
| 6 | West Palm Beach | FL | $814.83 | $722.37 |
| 7 | Fort Lauderdale | FL | $785.44 | $696.32 |
| 8 | Orlando | FL | $714.73 | $694.58 |
| 9 | Bridgeport | CT | $747.55 | $674.08 |
| 10 | St. Louis | MO | $603.20 | $662.86 |
| 11 | Cincinnati | OH | $616.30 | $661.26 |
| 12 | North Las Vegas | NV | $679.99 | $659.54 |
| 13 | Miami | FL | $726.84 | $644.36 |
| 14 | Rockford | IL | $557.62 | $627.25 |
| 15 | Memphis | TN | $558.58 | $622.03 |
| 16 | Hollywood | FL | $692.61 | $614.02 |
| 17 | Henderson | NV | $619.20 | $600.58 |
| 18 | St. Petersburg | FL | $612.99 | $597.46 |
| 19 | Milwaukee | WI | $564.61 | $595.58 |
| 20 | Charleston | SC | $604.44 | $582.88 |
| 21 | Springfield | IL | $512.48 | $580.39 |
| 22 | Savannah | GA | $571.35 | $578.29 |
| 23 | Davie | FL | $652.13 | $578.13 |
| 24 | Kansas City | MO | $530.63 | $571.80 |
| 25 | Toledo | OH | $506.88 | $570.81 |
| 26 | Ontario | CA | $662.93 | $567.58 |
| 27 | Birmingham | AL | $519.66 | $566.69 |
| 28 | Clearwater | FL | $576.53 | $561.92 |
| 29 | Tampa | FL | $569.25 | $554.83 |
| 30 | Las Vegas | NV | $568.03 | $550.95 |
| 31 | Pompano Beach | FL | $621.43 | $550.91 |
| 32 | Rochester | NY | $535.30 | $546.78 |
| 33 | Tucson | AZ | $537.81 | $539.43 |
| 34 | North Charleston | SC | $557.97 | $538.06 |
| 35 | Coral Springs | FL | $605.39 | $536.69 |
| 36 | Springfield | MO | $469.46 | $535.92 |
| 37 | Chicago | IL | $546.09 | $535.39 |
| 38 | Vista | CA | $735.32 | $533.22 |
| 39 | Lakeland | FL | $515.34 | $532.93 |
| 40 | Tempe | AZ | $557.73 | $527.16 |
| 41 | Dayton | OH | $467.35 | $523.35 |
| 42 | Inglewood | CA | $747.63 | $521.36 |
| 43 | Los Angeles | CA | $743.75 | $518.66 |
| 44 | Salt Lake City | UT | $552.30 | $512.81 |
| 45 | Torrance | CA | $716.60 | $499.72 |
| 46 | Pasadena | CA | $705.81 | $492.20 |
| 47 | Pembroke Pines | FL | $555.12 | $492.13 |
| 48 | Moreno Valley | CA | $566.63 | $485.12 |
| 49 | Burbank | CA | $694.89 | $484.58 |
| 50 | Long Beach | CA | $694.60 | $484.38 |
| 51 | New York | NY | $634.29 | $484.19 |
| 52 | Naperville | IL | $491.97 | $482.32 |
| 53 | Alexandria | VA | $595.55 | $481.06 |
| 54 | Providence | RI | $529.40 | $474.37 |
| 55 | Lansing | MI | $422.24 | $472.30 |
| 56 | Shreveport | LA | $407.92 | $467.80 |
| 57 | Chattanooga | TN | $428.15 | $462.36 |
| 58 | Miramar | FL | $517.30 | $458.60 |
| 59 | Miami Gardens | FL | $511.31 | $453.29 |
| 60 | Thousand Oaks | CA | $609.76 | $450.01 |
| 61 | Clovis | CA | $476.32 | $449.35 |
| 62 | Detroit | MI | $420.02 | $449.22 |
| 63 | Columbia | SC | $417.26 | $448.67 |
| 64 | Atlanta | GA | $454.27 | $444.93 |
| 65 | Charlotte | NC | $441.15 | $443.82 |
| 66 | Wilmington | NC | $442.08 | $441.20 |
| 67 | Topeka | KS | $383.09 | $440.34 |
| 68 | Columbus | OH | $419.42 | $439.18 |
| 69 | Cedar Rapids | IA | $391.75 | $439.18 |
| 70 | Chandler | AZ | $464.52 | $439.05 |
| 71 | Beaumont | TX | $393.33 | $438.98 |
| 72 | Gainesville | FL | $429.12 | $438.78 |
| 73 | Minneapolis | MN | $470.75 | $437.91 |
| 74 | Tallahassee | FL | $428.51 | $437.26 |
| 75 | St. Paul | MN | $466.60 | $434.05 |
| 76 | Newark | NJ | $565.25 | $431.49 |
| 77 | Stockton | CA | $490.17 | $430.73 |
| 78 | Richmond | VA | $431.11 | $429.39 |
| 79 | Peoria | IL | $376.03 | $429.26 |
| 80 | Vallejo | CA | $542.32 | $423.69 |
| 81 | Little Rock | AR | $378.75 | $423.66 |
| 82 | Syracuse | NY | $407.83 | $422.18 |
| 83 | Riverside | CA | $490.58 | $420.02 |
| 84 | Fresno | CA | $444.26 | $419.11 |
| 85 | Sacramento | CA | $505.35 | $417.99 |
| 86 | Fayetteville | NC | $373.90 | $412.24 |
| 87 | Corona | CA | $480.70 | $411.56 |
| 88 | Scottsdale | AZ | $433.55 | $409.78 |
| 89 | Boston | MA | $554.33 | $409.71 |
| 90 | Philadelphia | PA | $427.65 | $406.13 |
| 91 | Lakewood | CO | $466.73 | $405.85 |
| 92 | Austin | TX | $436.21 | $405.02 |
| 93 | Tacoma | WA | $523.02 | $404.50 |
| 94 | Hartford | CT | $430.27 | $404.39 |
| 95 | Glendale | CA | $578.07 | $403.11 |
| 96 | Aurora | IL | $410.97 | $402.91 |
| 97 | Elgin | IL | $410.82 | $402.76 |
| 98 | Yonkers | NY | $527.47 | $402.65 |
| 99 | Knoxville | TN | $374.79 | $402.57 |
| 100 | Jacksonville | FL | $401.21 | $400.01 |
| 101 | Houston | TX | $387.49 | $399.88 |
| 102 | Winston-Salem | NC | $366.95 | $398.43 |
| 103 | Albuquerque | NM | $376.00 | $397.89 |
| 104 | Lubbock | TX | $356.69 | $396.76 |
| 105 | Buffalo | NY | $388.25 | $396.58 |
| 106 | Richmond | CA | $724.96 | $396.15 |
| 107 | Oakland | CA | $723.22 | $395.20 |
| 108 | Boulder | CO | $487.13 | $394.44 |
| 109 | Glendale | AZ | $416.34 | $393.52 |
| 110 | Evansville | IN | $345.84 | $392.56 |
| 111 | Rialto | CA | $457.89 | $392.03 |
| 112 | South Bend | IN | $345.41 | $391.18 |
| 113 | Oklahoma City | OK | $348.05 | $391.07 |
| 114 | Hialeah | FL | $436.32 | $386.81 |
| 115 | Pueblo | CO | $359.93 | $386.19 |
| 116 | Independence | MO | $358.00 | $385.78 |
| 117 | Stamford | CT | $480.16 | $383.51 |
| 118 | Cape Coral | FL | $396.45 | $383.41 |
| 119 | Warren | MI | $358.06 | $382.95 |
| 120 | Green Bay | WI | $352.59 | $382.83 |
| 121 | Las Cruces | NM | $345.54 | $381.39 |
| 122 | Pittsburgh | PA | $357.55 | $378.36 |
| 123 | Roseville | CA | $457.42 | $378.34 |
| 124 | Waco | TX | $338.54 | $374.49 |
| 125 | Pomona | CA | $534.86 | $372.99 |
| 126 | San Buenaventura | CA | $504.93 | $372.64 |
| 127 | Ann Arbor | MI | $371.51 | $372.62 |
| 128 | Akron | OH | $337.93 | $372.17 |
| 129 | Greensboro | NC | $344.93 | $372.09 |
| 130 | Mobile | AL | $332.35 | $370.93 |
| 131 | Mesa | AZ | $392.01 | $370.52 |
| 132 | Temecula | CA | $431.25 | $369.22 |
| 133 | San Bernardino | CA | $430.79 | $368.83 |
| 134 | Des Moines | IA | $341.99 | $366.54 |
| 135 | Anchorage | AK | $416.32 | $366.48 |
| 136 | Oxnard | CA | $494.88 | $365.22 |
| 137 | Pasadena | TX | $352.01 | $363.28 |
| 138 | Port St. Lucie | FL | $373.88 | $362.99 |
| 139 | Fort Worth | TX | $363.05 | $362.32 |
| 140 | Anaheim | CA | $517.04 | $360.56 |
| 141 | Reno | NV | $390.46 | $360.53 |
| 142 | Murrieta | CA | $420.58 | $360.09 |
| 143 | Hillsboro | OR | $427.06 | $359.78 |
| 144 | High Point | NC | $330.03 | $358.34 |
| 145 | Laredo | TX | $327.81 | $357.87 |
| 146 | Olathe | KS | $331.07 | $356.76 |
| 147 | Huntington Beach | CA | $511.52 | $356.71 |
| 148 | Madison | WI | $362.25 | $356.19 |
| 149 | Downey | CA | $508.65 | $354.71 |
| 150 | West Covina | CA | $508.09 | $354.32 |
| 151 | Omaha | NE | $329.22 | $351.35 |
| 152 | Overland Park | KS | $324.20 | $349.35 |
| 153 | Eugene | OR | $383.15 | $348.96 |
| 154 | Durham | NC | $353.32 | $348.44 |
| 155 | Kansas City | KS | $321.53 | $346.47 |
| 156 | Grand Rapids | MI | $324.58 | $344.20 |
| 157 | Joliet | IL | $350.14 | $343.28 |
| 158 | Spokane | WA | $342.51 | $342.86 |
| 159 | Fontana | CA | $396.80 | $339.73 |
| 160 | Tyler | TX | $312.69 | $336.23 |
| 161 | Fort Wayne | IN | $294.07 | $334.93 |
| 162 | Visalia | CA | $348.60 | $334.23 |
| 163 | Amarillo | TX | $296.01 | $332.22 |
| 164 | San Francisco | CA | $606.98 | $331.68 |
| 165 | Berkeley | CA | $604.99 | $330.60 |
| 166 | Jersey City | NJ | $432.40 | $330.08 |
| 167 | Santa Ana | CA | $473.05 | $329.88 |
| 168 | Boise | ID | $327.43 | $328.42 |
| 169 | Dallas | TX | $328.52 | $327.86 |
| 170 | Elk Grove | CA | $392.39 | $324.56 |
| 171 | Costa Mesa | CA | $464.14 | $323.67 |
| 172 | Huntsville | AL | $296.60 | $323.44 |
| 173 | Rochester | MN | $320.25 | $321.86 |
| 174 | Santa Rosa | CA | $467.20 | $321.54 |
| 175 | Santa Clara | CA | $580.64 | $320.62 |
| 176 | Simi Valley | CA | $429.62 | $317.06 |
| 177 | Modesto | CA | $354.12 | $317.03 |
| 178 | Mcallen | TX | $274.76 | $316.55 |
| 179 | Bakersfield | CA | $326.04 | $314.71 |
| 180 | Jurupa Valley | CA | $367.17 | $314.36 |
| 181 | Davenport | IA | $277.33 | $314.08 |
| 182 | San Antonio | TX | $293.94 | $313.70 |
| 183 | Corpus Christi | TX | $293.97 | $312.73 |
| 184 | Elizabeth | NJ | $407.08 | $310.75 |
| 185 | Fort Collins | CO | $344.14 | $310.32 |
| 186 | Aurora | CO | $356.69 | $310.17 |
| 187 | Montgomery | AL | $274.63 | $309.62 |
| 188 | Tulsa | OK | $272.51 | $307.23 |
| 189 | Oceanside | CA | $421.11 | $305.38 |
| 190 | Wichita | KS | $268.15 | $304.71 |
| 191 | Wichita Falls | TX | $261.11 | $303.62 |
| 192 | Seattle | WA | $391.11 | $302.48 |
| 193 | Rancho Cucamonga | CA | $352.71 | $301.98 |
| 194 | Denver | CO | $346.76 | $301.53 |
| 195 | Abilene | TX | $269.22 | $300.47 |
| 196 | Colorado Springs | CO | $310.80 | $298.56 |
| 197 | Sterling Heights | MI | $277.41 | $296.70 |
| 198 | Allentown | PA | $296.72 | $296.12 |
| 199 | Norfolk | VA | $298.77 | $295.52 |
| 200 | Salem | OR | $312.14 | $295.03 |
| 201 | Phoenix | AZ | $310.69 | $293.66 |
| 202 | Portland | OR | $347.35 | $292.62 |
| 203 | Fullerton | CA | $418.13 | $291.58 |
| 204 | Salinas | CA | $408.42 | $291.52 |
| 205 | Concord | CA | $533.20 | $291.37 |
| 206 | Peoria | AZ | $307.56 | $290.70 |
| 207 | Paterson | NJ | $379.54 | $289.73 |
| 208 | Fairfield | CA | $529.99 | $289.61 |
| 209 | Murfreesboro | TN | $294.53 | $287.91 |
| 210 | Everett | WA | $371.81 | $287.55 |
| 211 | Santa Maria | CA | $420.39 | $286.76 |
| 212 | San Mateo | CA | $524.29 | $286.50 |
| 213 | Arlington | TX | $287.03 | $286.45 |
| 214 | New Haven | CT | $317.49 | $286.29 |
| 215 | Victorville | CA | $334.05 | $286.00 |
| 216 | El Monte | CA | $408.16 | $284.63 |
| 217 | Nashville | TN | $290.84 | $284.30 |
| 218 | Carlsbad | CA | $391.26 | $283.73 |
| 219 | Thornton | CO | $325.41 | $282.96 |
| 220 | Indianapolis | IN | $258.36 | $282.36 |
| 221 | Bellevue | WA | $364.61 | $281.99 |
| 222 | El Cajon | CA | $387.64 | $281.10 |
| 223 | Garden Grove | CA | $401.05 | $279.67 |
| 224 | Grand Prairie | TX | $278.25 | $277.70 |
| 225 | Newport News | VA | $279.49 | $276.44 |
| 226 | Waterbury | CT | $305.68 | $275.64 |
| 227 | Orange | CA | $394.43 | $275.06 |
| 228 | Palm Bay | FL | $282.01 | $273.80 |
| 229 | Hayward | CA | $498.64 | $272.48 |
| 230 | Jackson | MS | $240.99 | $272.31 |
| 231 | Raleigh | NC | $276.47 | $272.12 |
| 232 | Midland | TX | $271.68 | $270.06 |
| 233 | Lewisville | TX | $270.11 | $269.57 |
| 234 | Escondido | CA | $370.42 | $268.62 |
| 235 | Clarksville | TN | $241.59 | $267.24 |
| 236 | Greeley | CO | $287.61 | $267.05 |
| 237 | Norman | OK | $237.58 | $266.94 |
| 238 | Broken Arrow | OK | $236.11 | $266.19 |
| 239 | Springfield | MA | $286.40 | $266.18 |
| 240 | Lancaster | CA | $379.73 | $264.80 |
| 241 | Gresham | OR | $312.04 | $262.88 |
| 242 | Irvine | CA | $376.85 | $262.80 |
| 243 | Columbus | GA | $233.38 | $261.05 |
| 244 | Mesquite | TX | $261.49 | $260.97 |
| 245 | Brownsville | TX | $231.72 | $260.94 |
| 246 | Denton | TX | $261.19 | $260.67 |
| 247 | El Paso | TX | $233.41 | $260.50 |
| 248 | Irving | TX | $260.23 | $259.71 |
| 249 | Killeen | TX | $230.98 | $259.23 |
| 250 | Billings | MT | $251.36 | $258.07 |
| 251 | San Angelo | TX | $237.90 | $257.74 |
| 252 | Louisville | KY | $239.86 | $257.36 |
| 253 | Richardson | TX | $256.88 | $256.37 |
| 254 | Pearland | TX | $247.90 | $255.84 |
| 255 | Renton | WA | $330.74 | $255.79 |
| 256 | Cambridge | MA | $344.94 | $254.94 |
| 257 | Odessa | TX | $245.13 | $254.55 |
| 258 | Plano | TX | $253.55 | $253.04 |
| 259 | Sunnyvale | CA | $457.21 | $252.46 |
| 260 | Daly City | CA | $458.27 | $250.42 |
| 261 | Vancouver | WA | $296.16 | $249.50 |
| 262 | Round Rock | TX | $262.90 | $244.10 |
| 263 | Sandy Springs | GA | $247.75 | $242.66 |
| 264 | Antioch | CA | $443.89 | $242.56 |
| 265 | Palmdale | CA | $346.79 | $241.83 |
| 266 | Fargo | ND | $224.23 | $240.59 |
| 267 | Kent | WA | $308.62 | $238.69 |
| 268 | San Diego | CA | $324.86 | $235.58 |
| 269 | Centennial | CO | $270.57 | $235.28 |
| 270 | Gilbert | AZ | $248.39 | $234.78 |
| 271 | Westminster | CO | $269.70 | $234.52 |
| 272 | Sioux Falls | SD | $220.85 | $234.20 |
| 273 | Chula Vista | CA | $321.13 | $232.87 |
| 274 | Surprise | AZ | $242.13 | $228.86 |
| 275 | Augusta | GA | $212.96 | $228.50 |
| 276 | New Orleans | LA | $214.57 | $227.54 |
| 277 | Athens | GA | $219.05 | $227.47 |
| 278 | Norwalk | CA | $325.25 | $226.81 |
| 279 | Santa Clarita | CA | $322.79 | $225.10 |
| 280 | Worcester | MA | $257.55 | $224.55 |
| 281 | Garland | TX | $218.22 | $217.79 |
| 282 | Hampton | VA | $218.83 | $216.45 |
| 283 | Frisco | TX | $214.15 | $213.72 |
| 284 | Virginia Beach | VA | $215.47 | $213.12 |
| 285 | Columbia | MO | $194.96 | $212.84 |
| 286 | Fremont | CA | $374.37 | $206.72 |
| 287 | West Valley | UT | $222.47 | $206.57 |
| 288 | Manchester | NH | $222.19 | $200.54 |
| 289 | Cary | NC | $202.12 | $198.94 |
| 290 | Lincoln | NE | $184.89 | $194.42 |
| 291 | Carrollton | TX | $194.67 | $194.28 |
| 292 | Lexington | KY | $178.94 | $193.87 |
| 293 | Chesapeake | VA | $195.65 | $193.52 |
| 294 | College Station | TX | $179.63 | $191.30 |
| 295 | Mckinney | TX | $190.76 | $190.37 |
| 296 | West Jordan | UT | $204.03 | $189.44 |
| 297 | San Jose | CA | $338.13 | $186.71 |
| 298 | Macon | GA | $163.78 | $184.65 |
| 299 | Lowell | MA | $233.75 | $172.76 |
| 300 | Honolulu | HI | $276.73 | $166.21 |
| 301 | Provo | UT | $150.37 | $146.99 |
Methodology
This study used data about city- and county-level finances from the U.S. Census Bureau’s Annual Survey of State and Local Government Finances. Data was collected from the most recent survey data available, which was from 2017. This data set includes line-item expenditures and revenues for cities, counties, and states across the country.
Our study examined 301 of the largest U.S. cities, with populations of 100,000 residents or more. Our study determined the percentage of city budgets that was spent on policing, as well as the per-capita police spending, adjusted for the cost of living, in each of the cities.
To determine each city’s budget, we made several adjustments. First, we included the following expenditures: direct expenditures by the city, payments to the state, payments to other local governments, costs of construction, acquisition costs of land and buildings, and interest payments.
We subtracted from expenditures user fees and payments received from other local governments. User fees are payments to a government for services such as school tuition, airport fees, highway tolls, utilities charges, and mass transit revenue. Our rationale for excluding user fees was to equalize cities that operate infrastructure, such as water utilities, airports, and universities, with cities that do not have such infrastructure. By removing user fees from expenditures, only the city’s net contribution after fees for the infrastructure is considered part of the city’s budget expenditures. Payments received from other local governments similarly reduce a city’s net expenditure, as some cities provide services to other cities and are reimbursed.
Secondly, since cities and counties provide different proportions of services in different cities across the country, we standardized the budgets in each city by allocating a portion of the county budget of the county that each city was located in. The allocation was made based on the population of the city as a proportion of the county’s population. For example, if a city contained 30% of a county’s population, then 30% of the county’s budget would be allocated to the city. Our rationale for making this adjustment is that counties provide high levels of services in some cities, while counties are not operating entities in other cities. This adjustment allows us to compare similar levels of services across cities.
To measure each city’s police spending, we calculated the amount of direct expenditure, along with payments made to other local governments and payments to the state. We made the same calculation for the overlying counties.
We calculated the proportion of each city’s budget that was allocated to the police by adding the city and the city’s proportion of county spending on police and dividing this number by the total budget of the city plus the city’s proportion of the county’s total budget. We then ranked cities by this proportion of budget spent on the police.
We also calculated the per-capita spending on police adjusted for the cost of living in each city. To determine the per-capita spending on police, we took the total dollars spent on policing in the city and the city’s allocation of the county’s spending on police. We divided this number by the population of each city to determine the per-capita spending. We then adjusted this per-capita number by the cost of living in each city. We determined the cost of living by assigning each city to its overlying metropolitan area and then referenced the AdvisorSmith Cost of Living Index to determine the cost of living in each metropolitan area. Each city’s per-capita spending on police was adjusted by the index value to normalize the cities based upon their relative costs of living. We then ranked the cities by their per-capita spending on police adjusted by cost of living.
Sources
1. U.S. Census Bureau, Annual Survey of State and Local Government Finances
2. AdvisorSmith Cost of Living Index