


With fewer COVID restrictions in place in the U.S., many Americans are moving about more freely and considering vacationing again. However, as the Delta variant has caused a summer surge in infections, people are wary of being able to travel safely, especially parents whose children are under 12 and unable to receive a COVID vaccine.
We conducted a study to find the best states for traveling with children during the pandemic, analyzing 10 factors in three major categories. Our analysis examines states offering activities and accommodations that are naturally socially distanced, and we also took a look at safety factors such as coronavirus infection, hospitalization, and vaccination rates, as well as mask mandates. Finally, we looked at factors that would impact families traveling by car, such as gas prices and traffic safety, as many Americans are opting to road trip during the pandemic.
Best States for Family Travel During COVID

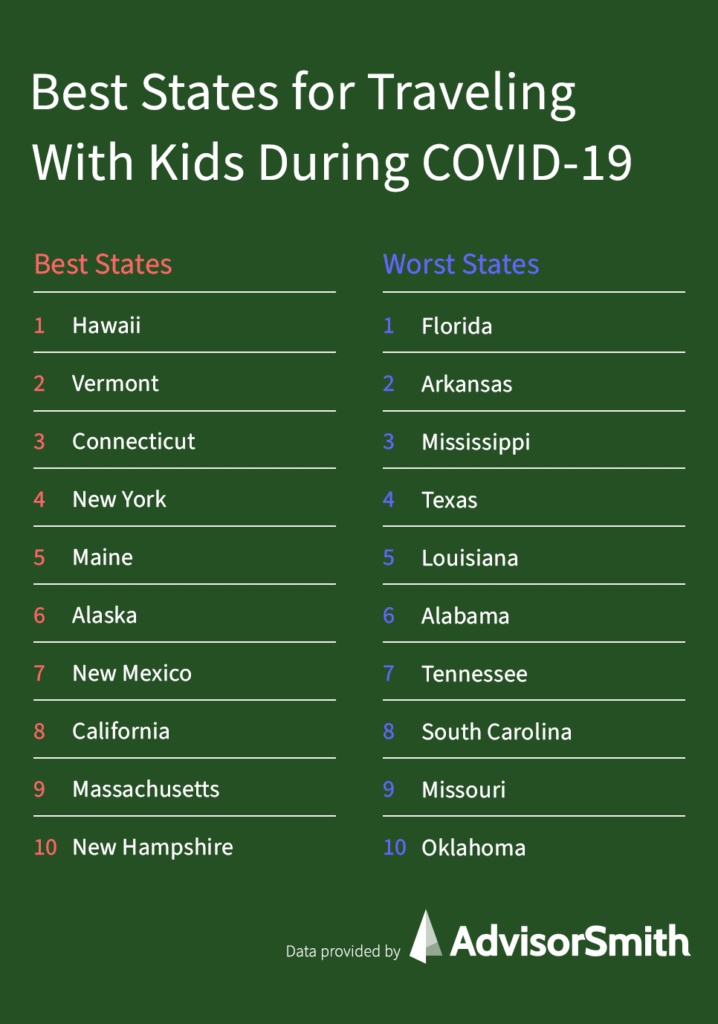
1. Hawaii
Hawaii has been one of the most popular vacation destinations during the pandemic, particularly as its COVID case rates have been extremely low (Hawaii has had the lowest cumulative case rate in the nation) and requirements for incoming travel have been strict. Hawaii also saw quick adoption of the COVID vaccine, with historically high vaccination rates that today exceed 70% for at least one dose.
Hawaii is also one of the most family-friendly destinations in the nation, with an abundance of beautiful beaches (Hawaii ranks #4 in miles of coastline), two national parks and seven national park sites, and great weather all year round. Families can enjoy a variety of outdoor activities, from hiking to sailing to whale watching, allowing for natural social distancing and lower risk of COVID exposure.
Currently, for fully vaccinated out-of-state visitors, Hawaii does not require any pre-travel testing or quarantining. All other travelers must submit a negative COVID test or quarantine for 10 days upon arrival. Hawaii has a mask mandate for most indoor settings.
2. Vermont
Vermont is an incredibly beautiful state, known for its colorful fall foliage, ski mountains like Killington, Manchester, Stowe, and Mount Snow, and variety of attractions for families and kids. An abundance of outdoor activities contributed to Vermont’s #2 ranking in our study, as visitors can spend time camping, fishing, backpacking, hiking, swimming, and boating in Vermont’s 55 state parks.
Vermont scores highly on COVID safety, with a vaccination rate of over 75% with at least one dose, and a case rate that has been low throughout the pandemic (Vermont has had the second-lowest cumulative case rate in the nation). Vermont also has one of the lowest infection rates in the current Delta surge.
3. Connecticut
Connecticut is a perfect destination for families looking for outdoor activities and relaxation, with over 100 state parks and forests, in addition to historic sites and seaports dotted throughout its 300 miles of coastline. The state has a little bit of something for everyone, from picturesque farms, villages, vineyards, and wineries in western Connecticut to fine dining and art museums in the capital city of Hartford.
Connecticut, along with much of the Northeast, has been well protected against COVID after seeing high vaccination rates throughout the region. Connecticut’s vaccination rate of one dose or more is over 70%, and case rates have remained relatively low throughout the summer surge.
4. New York
While you might be thinking about crowded subways and streets when you envision New York, the bustling Big Apple is just one part of this great state. Outside of New York City lies an abundance of activities and sights for families with a penchant for the outdoors, from deep-sea fishing off the shores of Long Island to tranquil hiking and paddling in the Adirondack Mountains. New York boasts nearly 200 state parks, including the nation’s first state park, Niagara Falls State Park.
New York, while early on during the pandemic was greatly impacted, has benefited from high vaccination rates of nearly 65% for at least one dose. During the summer surge, New York has seen relatively low case rates and even lower hospitalization rates. New York City recently announced a vaccination requirement for indoor restaurants, gyms, and entertainment venues.
5. Maine
Maine is well known for its stunning outdoor attractions, from the magnificent Acadia National Park to the iconic Cape Elizabeth’s Portland Head Light. With 32 state parks, Maine is blessed with over 500,000 acres of preserved land, perfect for families looking to enjoy all that the state’s natural beauty has to offer.
Maine scored highly in our COVID safety category, with one of the lowest COVID case rates in the nation (both recent and cumulative), in addition to a nearly 70% vaccination rate for at least one dose.
| State | Overall Score | Coronavirus Case Rate (per 100,000) - Last 7 Days (August 10, 2021) | Vaccination Rate (1 or more dose) | Hospitalization Rate (per 100,000) - Last 7 Days (August 10, 2021) | National Park Acres | Vacation Rentals Per Capita | Tolls Per Lane Mile | Traffic Deaths Per 100M Miles | Average Cost of Regular Gas Per Gallon |
|---|---|---|---|---|---|---|---|---|---|
| Alabama | 2.98 | 67 | 45% | 42% | 22,747 | 4.54 | $4,238 | 1.34 | $3.68 |
| Alaska | 5.00 | 43 | 52% | 14% | 54,653,962 | 5.04 | $5,717 | 1.46 | $2.85 |
| Arizona | 3.93 | 33 | 54% | 19% | 2,947,211 | 3.12 | $7,766 | 1.53 | $2.88 |
| Arkansas | 2.28 | 76 | 49% | 41% | 104,982 | 1.76 | $3,127 | 1.41 | $3.12 |
| California | 4.80 | 29 | 66% | 14% | 8,210,924 | 2.33 | $24,544 | 1.02 | $4.39 |
| Colorado | 4.53 | 18 | 61% | 8% | 738,668 | 8.83 | $6,643 | 1.17 | $3.64 |
| Connecticut | 5.19 | 15 | 71% | 6% | 7,782 | 0.61 | $14,798 | 0.93 | $3.18 |
| Delaware | 4.30 | 19 | 62% | 10% | 904 | 3.50 | $31,037 | 1.09 | $3.01 |
| Florida | 1.85 | 127 | 60% | 62% | 2,638,605 | 10.00 | $21,065 | 1.41 | $3.02 |
| Georgia | 3.36 | 51 | 47% | 32% | 67,524 | 2.12 | $4,900 | 1.14 | $2.97 |
| Hawaii | 5.60 | 36 | 72% | 13% | 371,494 | 28.00 | $45,968 | 1.07 | $4.09 |
| Idaho | 4.03 | 29 | 42% | 12% | 806,298 | 3.85 | $4,173 | 1.30 | $3.00 |
| Illinois | 4.27 | 22 | 64% | 10% | 115 | 0.64 | $13,115 | 0.96 | $3.81 |
| Indiana | 3.88 | 26 | 48% | 16% | 15,575 | 0.75 | $5,887 | 1.05 | $3.40 |
| Iowa | 3.60 | 19 | 54% | 10% | 2,713 | 0.77 | $4,150 | 0.96 | $3.12 |
| Kansas | 3.80 | 37 | 55% | 19% | 11,628 | 0.71 | $2,553 | 1.26 | $2.94 |
| Kentucky | 3.59 | 46 | 54% | 23% | 97,504 | 0.88 | $6,000 | 1.46 | $2.96 |
| Louisiana | 2.90 | 116 | 45% | 48% | 27,000 | 1.52 | $5,951 | 1.53 | $2.82 |
| Maine | 5.00 | 10 | 69% | 5% | 182,007 | 8.05 | $9,722 | 0.93 | $3.04 |
| Maryland | 4.46 | 12 | 66% | 9% | 74,059 | 1.73 | $22,700 | 0.84 | $3.07 |
| Massachusetts | 4.78 | 15 | 74% | 4% | 59,500 | 2.25 | $19,774 | 0.54 | $3.12 |
| Michigan | 4.35 | 15 | 54% | 6% | 718,190 | 1.46 | $7,735 | 0.95 | $3.28 |
| Minnesota | 4.49 | 14 | 60% | 6% | 301,352 | 1.07 | $5,227 | 0.63 | $3.03 |
| Mississippi | 2.69 | 80 | 42% | 43% | 119,301 | 1.30 | $3,569 | 1.63 | $2.87 |
| Missouri | 3.28 | 47 | 50% | 36% | 83,545 | 1.63 | $3,765 | 1.20 | $2.79 |
| Montana | 3.61 | 22 | 50% | 14% | 1,274,133 | 7.05 | $2,432 | 1.43 | $3.29 |
| Nebraska | 4.20 | 18 | 55% | 10% | 66,569 | 0.66 | $2,792 | 1.10 | $2.93 |
| Nevada | 4.05 | 35 | 55% | 39% | 801,172 | 2.39 | $7,511 | 1.17 | $3.13 |
| New Hampshire | 4.76 | 12 | 66% | 3% | 21,190 | 4.14 | $13,200 | 1.07 | $3.03 |
| New Jersey | 4.50 | 14 | 67% | 7% | 99,598 | 1.27 | $29,972 | 0.73 | $3.00 |
| New Mexico | 4.92 | 25 | 67% | 11% | 483,504 | 4.40 | $2,748 | 1.43 | $3.20 |
| New York | 5.06 | 17 | 64% | 7% | 97,419 | 0.50 | $25,685 | 0.76 | $3.10 |
| North Carolina | 3.90 | 41 | 53% | 14% | 410,459 | 3.45 | $10,309 | 1.19 | $4.05 |
| North Dakota | 4.18 | 12 | 46% | 8% | 72,568 | 1.29 | $1,601 | 1.07 | $3.23 |
| Ohio | 4.16 | 15 | 51% | 11% | 34,555 | 0.57 | $10,800 | 0.93 | $3.05 |
| Oklahoma | 3.33 | 51 | 49% | 28% | 10,241 | 1.23 | $5,648 | 1.44 | $2.89 |
| Oregon | 4.13 | 28 | 62% | 13% | 203,385 | 4.75 | $9,047 | 1.37 | $3.76 |
| Pennsylvania | 4.52 | 12 | 67% | 7% | 116,509 | 0.95 | $14,805 | 1.17 | $3.28 |
| Rhode Island | 4.69 | 14 | 69% | 5% | 331 | 2.63 | $15,059 | 0.74 | $3.06 |
| South Carolina | 3.04 | 55 | 48% | 20% | 32,564 | 7.66 | $5,696 | 1.83 | $2.88 |
| South Dakota | 4.48 | 6 | 54% | 5% | 296,584 | 2.83 | $1,168 | 1.34 | $3.18 |
| Tennessee | 3.03 | 47 | 46% | 19% | 389,245 | 3.80 | $6,496 | 1.28 | $2.89 |
| Texas | 2.89 | 43 | 53% | 31% | 1,260,150 | 1.93 | $9,359 | 1.29 | $2.84 |
| Utah | 4.28 | 26 | 53% | 12% | 2,117,689 | 5.60 | $5,630 | 0.81 | $3.87 |
| Vermont | 5.27 | 12 | 76% | 2% | 23,237 | 10.21 | $5,743 | 0.93 | $2.98 |
| Virginia | 4.44 | 19 | 63% | 8% | 371,635 | 1.43 | $10,242 | 0.96 | $3.10 |
| Washington | 4.76 | 36 | 65% | 12% | 1,967,552 | 2.14 | $11,336 | 0.88 | $3.88 |
| West Virginia | 3.98 | 20 | 46% | 14% | 92,697 | 1.63 | $6,297 | 1.51 | $3.03 |
| Wisconsin | 4.35 | 21 | 57% | 8% | 133,757 | 1.58 | $6,768 | 0.89 | $3.03 |
| Wyoming | 3.97 | 38 | 42% | 15% | 2,396,431 | 5.21 | $2,920 | 1.06 | $3.58 |
Methodology
In order to determine the best states for traveling with kids during the pandemic, we examined 10 criteria in three major categories. These categories included (1) accommodations and outdoor destinations, (2) auto-related criteria, and (3) coronavirus-related criteria.
We assigned a weight of 40% to the accommodations and outdoor destinations factor. Since many medical experts believe outdoor activities are less risky for the spread of coronavirus compared with indoor activities, we focused on states offering outdoor recreation destinations as measured by the area of national parks and miles of shoreline (including lake shorelines) in each state. Additionally, we focused on two forms of socially distanced accommodation, which were the number of campsites per capita and the number of vacation rental listings per capita in each state.
The auto-related criteria accounted for 15% of the score, as many families are opting to travel by car for their vacations. These criteria included practical considerations such as the number of traffic deaths per 100 million miles driven, the number of car thefts per 1,000 population, the average cost of gas, and the total costs of tolls per lane mile in each state.
The third category we considered was coronavirus-related criteria, which accounted for 45% of our analysis. For the following coronavirus-related data, we based our analysis on data as of August 10, 2021. We looked at the number of new coronavirus cases per capita and average hospitalization rate as reported by each state in the last 7 days. We also considered the vaccination rate in each state, looking at those people who had received at least one dose of a COVID-19 vaccine. We also examined the current state of masking and vaccination requirements in each state.
In aggregate, we combined the scores from each of these areas for each of the states to create an overall score for each state. We then ranked the 50 states in order to determine the best states for traveling with kids during COVID-19.
Sources
- National Park Service Acreage Reports
- National Oceanic and Atmospheric Administration, Office for Coastal Management, Shoreline Mileage Of the United States
- U.S. Census Bureau, Population and Housing Unit Counts
- U.S. Census Bureau, State Population Totals and Components of Change: 2010-2019
- USCAmpgrounds.info
- National Safety Council, Injury Facts, Motor-Vehicle Deaths by State
- National Motorists Association, State Collected Road-User Fees (2011 data) $ per lane mile
- FBI’s Uniform Crime Reporting, Motor Vehicle Theft
- AAA Average Gas Prices (accessed August 10, 2021)
- U.S. Centers for Disease Control and Prevention, COVID Data Tracker (accessed August 10, 2021)
- AARP, List of Coronavirus-Related Restrictions in Every State
- Tripping, Vacation Rentals
Note: The data in this study was accurate as of August 10, 2021. Please follow all guidance from the CDC, state and local authorities, and your medical professionals about how to protect yourself and others from coronavirus before making any travel plans.