


Americans choose places to live and work based on a variety of factors, which usually include living costs, commutes, and the quality of life in various cities. However, the coronavirus pandemic has upended the work lives of many Americans, with millions being asked or required to work from home by their employers. With arrangements for working from home expected to continue for an extended period, or in some cases indefinitely, some workers are making the choice to move to different cities in order to better support the new work-from-home lifestyle.
In this analysis, AdvisorSmith examined 2,493 U.S. cities to determine the best small, midsize, and large cities for working from home. We examined five major factors that are important to workers choosing a place to call home: availability of high-speed internet, housing prices, crime levels, parkland per capita, and weather quality.
Internet quality is of utmost importance to those working from home, as video calls, online chat, and uploading files are crucial for remote workers to stay connected and productive. Additionally, we examined housing prices, since remote workers do not need to commute, a lower price of housing is beneficial for those working remotely.
We also used three quality of life factors in our analysis: crime, weather, and parks. Since many experts believe that outdoor activities are less likely to lead to the spread of COVID-19, we took into account the availability of outdoor amenities such as parks, and good weather conditions which allow for social distancing. Since workers also need to feel safe while outside, as well as in their homes, we used crime rates as a factor as well.
Due to social distancing regulations, amenities commonly used by telecommuters such as coffee shops and coworking spaces are generally unavailable, so these were not included in our analysis. Read on to discover the best cities for working from home.
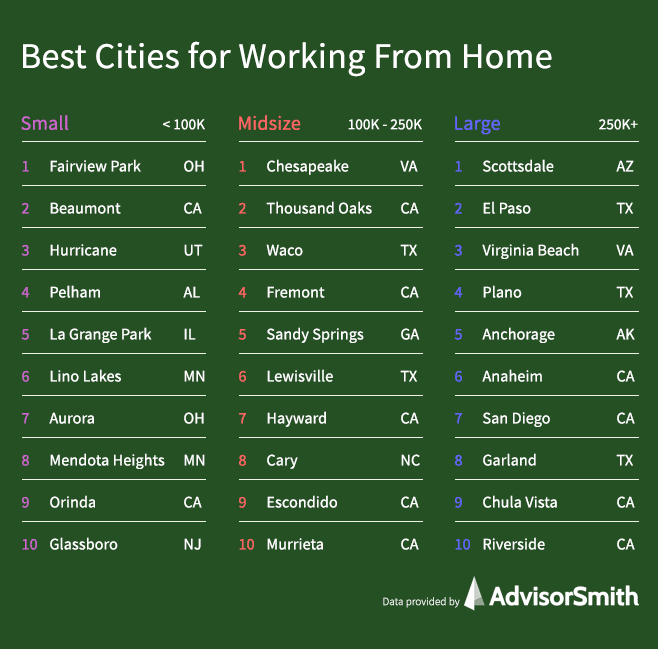
Best Cities for Working From Home

Best Large Cities for Working From Home
1. Scottsdale, Arizona
The best large city for working from home is Scottsdale, Arizona. Located in the northeastern part of the Phoenix metropolitan area, Scottsdale scored highly in all five of our work-from-home categories. The city experiences warm, sunny, and dry weather year round, along with low crime and moderate housing prices. Additionally, 93% of residents have at least one broadband provider with 100 Mbps internet access, and the city offers 0.14 acres of parkland per resident.
The surrounding mountains of the Phoenix metropolitan area provide numerous opportunities for hiking, rock climbing, and other outdoor activities. Golf is another popular outdoor activity, and the city boasts over 200 golf courses, including several highly ranked golf resorts and courses.
| Rank | City | Overall Score | Weather Score | Broadband Score | Park Score | Crime Score | Housing Score |
|---|---|---|---|---|---|---|---|
| 1 | Scottsdale, AZ | 87.8 | 90.3 | 85.7 | 92.1 | 87.8 | 85.5 |
| 2 | El Paso, TX | 79.1 | 88.4 | 92.7 | 30.7 | 84.8 | 96.6 |
| 3 | Virginia Beach, VA | 76.1 | 78.5 | 90.0 | 23.8 | 89.1 | 93.2 |
| 4 | Plano, TX | 75.9 | 80.2 | 97.4 | 11.0 | 90.2 | 92.1 |
| 5 | Anchorage, AK | 75.6 | 46.4 | 74.6 | 100.0 | 51.9 | 91.3 |
| 6 | Anaheim, CA | 74.8 | 100.0 | 99.9 | 8.8 | 83.0 | 82.5 |
| 7 | San Diego, CA | 74.6 | 93.0 | 93.9 | 20.6 | 84.9 | 80.3 |
| 8 | Garland, TX | 74.5 | 81.0 | 98.5 | 7.8 | 82.0 | 94.6 |
| 9 | Chula Vista, CA | 74.3 | 93.0 | 93.3 | 11.7 | 88.5 | 85.1 |
| 10 | Riverside, CA | 74.0 | 93.4 | 99.8 | 7.3 | 77.3 | 88.8 |
| 11 | Corpus Christi, TX | 73.7 | 91.5 | 97.9 | 13.9 | 66.8 | 95.3 |
| 12 | San Antonio, TX | 73.4 | 86.8 | 96.9 | 13.1 | 69.8 | 95.5 |
| 13 | Santa Ana, CA | 73.3 | 100.0 | 100.0 | 1.0 | 82.1 | 83.2 |
| 14 | Fort Wayne, IN | 73.2 | 73.2 | 98.2 | 5.1 | 80.5 | 96.5 |
| 15 | Henderson, NV | 73.1 | 91.7 | 82.8 | 16.7 | 87.3 | 91.3 |
| 16 | Austin, TX | 73.0 | 83.6 | 96.4 | 13.1 | 76.1 | 89.5 |
| 17 | Greensboro, NC | 72.6 | 76.7 | 93.8 | 15.6 | 72.4 | 96.0 |
| 18 | Pittsburgh, PA | 72.1 | 73.1 | 98.2 | 7.7 | 73.4 | 95.5 |
| 19 | Fort Worth, TX | 72.0 | 81.8 | 91.3 | 9.8 | 77.5 | 95.0 |
| 20 | Arlington, TX | 71.9 | 81.8 | 93.8 | 7.6 | 75.9 | 94.5 |
| 21 | Jersey City, NJ | 71.7 | 75.0 | 98.2 | 4.0 | 85.0 | 85.0 |
| 22 | Columbus, OH | 71.7 | 73.9 | 97.6 | 8.5 | 71.2 | 95.5 |
| 23 | Bakersfield, CA | 71.7 | 91.2 | 90.4 | 8.4 | 75.0 | 93.8 |
| 24 | Chandler, AZ | 71.5 | 90.3 | 87.5 | 3.8 | 86.0 | 91.3 |
| 25 | Sacramento, CA | 71.4 | 88.1 | 94.3 | 5.4 | 75.3 | 90.7 |
| 26 | Phoenix, AZ | 71.3 | 90.3 | 86.0 | 19.9 | 69.9 | 92.7 |
| 27 | Long Beach, CA | 71.2 | 93.5 | 99.9 | 3.4 | 75.3 | 80.7 |
| 28 | Dallas, TX | 70.9 | 81.0 | 95.4 | 9.3 | 67.5 | 94.3 |
| 29 | New York, NY | 70.9 | 75.6 | 99.2 | 1.9 | 84.9 | 81.2 |
| 30 | Los Angeles, CA | 70.8 | 93.5 | 98.0 | 6.8 | 73.9 | 79.6 |
| 31 | Aurora, CO | 70.8 | 74.8 | 90.6 | 24.1 | 66.8 | 89.8 |
| 32 | Newark, NJ | 70.8 | 72.6 | 98.1 | 2.1 | 75.3 | 92.9 |
| 33 | Cincinnati, OH | 70.7 | 73.3 | 96.5 | 14.8 | 61.7 | 95.8 |
| 34 | San Jose, CA | 70.7 | 88.1 | 99.4 | 6.9 | 81.7 | 71.9 |
| 35 | Minneapolis, MN | 70.5 | 70.4 | 98.2 | 10.6 | 67.7 | 91.5 |
| 36 | Philadelphia, PA | 70.3 | 73.9 | 98.1 | 4.6 | 67.0 | 95.9 |
| 37 | Atlanta, GA | 69.8 | 75.1 | 98.4 | 7.0 | 64.3 | 92.5 |
| 38 | Fresno, CA | 69.4 | 84.2 | 88.5 | 4.0 | 74.9 | 93.2 |
| 39 | Portland, OR | 69.3 | 67.7 | 95.3 | 14.1 | 68.4 | 87.4 |
| 40 | Boston, MA | 69.2 | 70.9 | 96.4 | 5.6 | 78.3 | 82.1 |
| 41 | Chicago, IL | 69.0 | 72.8 | 95.2 | 2.4 | 69.6 | 93.7 |
| 42 | Durham, NC | 69.0 | 75.0 | 90.4 | 6.1 | 72.2 | 93.6 |
| 43 | Colorado Springs, CO | 69.0 | 74.5 | 90.2 | 5.4 | 75.2 | 91.6 |
| 44 | Albuquerque, NM | 68.6 | 82.0 | 87.7 | 27.5 | 48.6 | 94.3 |
| 45 | Mesa, AZ | 68.2 | 90.3 | 78.0 | 2.8 | 83.7 | 92.6 |
| 46 | Denver, CO | 68.0 | 77.4 | 93.9 | 4.0 | 70.3 | 86.3 |
| 47 | Milwaukee, WI | 67.8 | 72.8 | 94.7 | 6.1 | 57.9 | 96.5 |
| 48 | Houston, TX | 67.3 | 80.4 | 86.5 | 11.6 | 59.4 | 95.4 |
| 49 | Tulsa, OK | 67.0 | 77.1 | 87.5 | 12.5 | 56.1 | 96.6 |
| 50 | Tucson, AZ | 66.4 | 88.6 | 81.4 | 7.2 | 63.9 | 94.3 |
Best Midsize Cities for Working From Home
1. Chesapeake, Virginia
Located just next to the coastal cities of Norfolk and Virginia Beach, Chesapeake, Virginia is the best midsize city for working from home. Chesapeake offers almost half an acre of parkland per resident, along with affordable housing, with an average 3-bedroom home costing under $240,000. The city has low-to-moderate levels of crime, and it also supports great broadband access, with 98% of residents having access to 100 Mbps broadband. Chesapeake’s weakest score was for weather, with higher than average rainfall and moderately cold winters.
| Ranks | City | Overall Score | Weather Score | Broadband Score | Park Score | Crime Score | Housing Score |
|---|---|---|---|---|---|---|---|
| 1 | Chesapeake, VA | 89.3 | 76.2 | 89.7 | 100.0 | 80.2 | 93.8 |
| 2 | Thousand Oaks, CA | 87.0 | 88.9 | 98.7 | 66.8 | 93.4 | 82.1 |
| 3 | Waco, TX | 86.9 | 81.7 | 98.0 | 78.1 | 72.0 | 96.5 |
| 4 | Fremont, CA | 81.5 | 92.1 | 99.5 | 52.0 | 88.7 | 71.3 |
| 5 | Sandy Springs, GA | 79.9 | 75.1 | 95.1 | 40.7 | 90.8 | 87.7 |
| 6 | Lewisville, TX | 78.6 | 80.9 | 96.8 | 27.7 | 86.8 | 93.0 |
| 7 | Hayward, CA | 78.6 | 92.1 | 98.9 | 36.2 | 81.6 | 81.0 |
| 8 | Cary, NC | 76.9 | 75.4 | 98.6 | 12.5 | 94.7 | 91.5 |
| 9 | Escondido, CA | 76.5 | 93.0 | 93.7 | 25.5 | 85.3 | 84.9 |
| 10 | Murrieta, CA | 76.4 | 93.4 | 100.0 | 2.7 | 94.3 | 88.5 |
| 11 | North Las Vegas, NV | 76.4 | 91.7 | 82.5 | 47.2 | 72.3 | 93.1 |
| 12 | Simi Valley, CA | 76.2 | 88.9 | 90.4 | 24.1 | 92.3 | 84.8 |
| 13 | Glendale, CA | 76.2 | 93.5 | 100.0 | 18.5 | 92.6 | 72.9 |
| 14 | Orange, CA | 76.1 | 100.0 | 99.9 | 8.4 | 91.7 | 80.4 |
| 15 | Naperville, IL | 75.4 | 71.7 | 98.6 | 9.4 | 92.7 | 91.3 |
| 16 | Charleston, SC | 75.4 | 79.7 | 90.6 | 26.5 | 83.5 | 91.5 |
| 17 | Corona, CA | 75.4 | 93.4 | 99.9 | 3.4 | 90.3 | 86.9 |
| 18 | Palmdale, CA | 75.4 | 93.5 | 87.9 | 20.5 | 85.9 | 91.7 |
| 19 | Arvada, CO | 75.4 | 73.5 | 92.5 | 29.2 | 84.6 | 87.5 |
| 20 | Carlsbad, CA | 75.3 | 93.0 | 95.3 | 21.6 | 89.0 | 76.3 |
| 21 | Temecula, CA | 75.3 | 93.4 | 100.0 | 2.1 | 89.6 | 87.9 |
| 22 | Fontana, CA | 75.2 | 92.6 | 100.0 | 3.9 | 86.7 | 89.1 |
| 23 | Santa Clarita, CA | 75.1 | 93.5 | 93.1 | 11.1 | 93.2 | 84.6 |
| 24 | Irvine, CA | 75.0 | 100.0 | 82.5 | 31.1 | 94.2 | 76.1 |
| 25 | Round Rock, TX | 74.8 | 83.5 | 94.9 | 8.1 | 88.7 | 93.1 |
| 26 | Midland, TX | 74.5 | 87.8 | 97.0 | 5.9 | 84.1 | 93.1 |
| 27 | Irving, TX | 74.5 | 81.0 | 96.8 | 6.9 | 85.5 | 94.1 |
| 28 | Rancho Cucamonga, CA | 74.5 | 92.6 | 99.6 | 1.2 | 89.2 | 86.2 |
| 29 | Burbank, CA | 74.4 | 93.5 | 100.0 | 14.2 | 86.8 | 74.4 |
| 30 | Sterling Heights, MI | 74.4 | 75.1 | 97.4 | 3.2 | 91.2 | 94.1 |
| 31 | Carrollton, TX | 74.2 | 81.0 | 98.5 | 6.5 | 83.6 | 92.7 |
| 32 | Grand Prairie, TX | 74.2 | 81.0 | 94.0 | 14.2 | 80.8 | 94.6 |
| 33 | Elgin, IL | 74.1 | 70.9 | 97.9 | 6.1 | 87.6 | 94.6 |
| 34 | Moreno Valley, CA | 74.1 | 93.4 | 99.9 | 1.2 | 82.0 | 90.7 |
| 35 | Fullerton, CA | 74.1 | 100.0 | 100.0 | 3.7 | 85.0 | 81.8 |
| 36 | Roswell, GA | 74.1 | 75.1 | 97.6 | 5.5 | 90.7 | 90.1 |
| 37 | Hillsboro, OR | 74.0 | 70.3 | 99.3 | 10.1 | 86.7 | 89.4 |
| 38 | West Covina, CA | 74.0 | 93.5 | 99.9 | 2.6 | 86.7 | 83.9 |
| 39 | Gilbert, AZ | 73.9 | 90.3 | 91.5 | 3.5 | 92.2 | 91.3 |
| 40 | Columbus, GA | 73.9 | 76.4 | 97.0 | 12.9 | 75.1 | 97.7 |
| 41 | Allen, TX | 73.9 | 80.2 | 91.8 | 5.7 | 93.1 | 92.8 |
| 42 | El Monte, CA | 73.8 | 93.5 | 100.0 | 0.2 | 86.6 | 85.7 |
| 43 | Pearland, TX | 73.8 | 83.5 | 92.4 | 3.6 | 91.1 | 93.7 |
| 44 | Garden Grove, CA | 73.6 | 100.0 | 100.0 | 0.5 | 85.9 | 81.7 |
| 45 | Norwalk, CA | 73.6 | 93.5 | 100.0 | 0.6 | 85.0 | 85.5 |
| 46 | Provo, UT | 73.5 | 74.6 | 97.6 | 2.0 | 89.2 | 92.5 |
| 47 | Ontario, CA | 73.4 | 92.6 | 100.0 | 1.1 | 82.2 | 87.5 |
| 48 | Sugar Land, TX | 73.4 | 81.8 | 89.6 | 5.6 | 92.1 | 93.9 |
| 49 | Huntington Beach, CA | 73.4 | 100.0 | 100.0 | 2.7 | 87.9 | 76.2 |
| 50 | Allentown, PA | 73.3 | 69.6 | 99.5 | 5.3 | 81.8 | 95.5 |
| 51 | Beaverton, OR | 73.3 | 70.3 | 97.8 | 7.3 | 88.0 | 89.3 |
| 52 | Denton, TX | 73.2 | 80.9 | 94.8 | 7.0 | 82.9 | 93.7 |
| 53 | Frisco, TX | 73.2 | 80.2 | 93.1 | 7.0 | 87.9 | 91.4 |
| 54 | Downey, CA | 73.1 | 93.5 | 100.0 | 0.6 | 85.0 | 82.9 |
| 55 | Richmond, CA | 73.0 | 91.3 | 94.9 | 27.8 | 68.0 | 81.4 |
| 56 | Rialto, CA | 73.0 | 92.6 | 100.0 | 0.6 | 78.3 | 89.8 |
| 57 | Richardson, TX | 72.8 | 81.0 | 92.4 | 6.4 | 86.4 | 92.2 |
| 58 | Torrance, CA | 72.8 | 93.5 | 100.0 | 1.5 | 90.2 | 75.6 |
| 59 | Roseville, CA | 72.7 | 71.7 | 97.2 | 7.5 | 86.9 | 87.6 |
| 60 | Yonkers, NY | 72.6 | 72.2 | 99.6 | 2.6 | 89.9 | 85.1 |
| 61 | Surprise, AZ | 72.6 | 90.3 | 87.9 | 1.1 | 91.9 | 92.9 |
| 62 | Newport News, VA | 72.6 | 77.2 | 95.2 | 12.3 | 73.8 | 95.3 |
| 63 | Madison, WI | 72.6 | 69.2 | 90.4 | 17.5 | 82.8 | 92.3 |
| 64 | Pasadena, CA | 72.5 | 93.5 | 100.0 | 7.4 | 85.3 | 73.2 |
| 65 | Centennial, CO | 72.5 | 74.4 | 93.2 | 8.6 | 89.7 | 87.2 |
| 66 | Mesquite, TX | 72.5 | 81.0 | 96.3 | 4.9 | 77.4 | 95.2 |
| 67 | Huntsville, AL | 72.3 | 71.6 | 94.0 | 29.1 | 59.8 | 95.8 |
| 68 | Pomona, CA | 72.3 | 93.5 | 100.0 | 0.8 | 76.8 | 87.2 |
| 69 | Elk Grove, CA | 72.3 | 88.1 | 89.1 | 4.3 | 90.7 | 88.7 |
| 70 | Warren, MI | 72.2 | 75.1 | 97.3 | 1.7 | 79.6 | 96.0 |
| 71 | Joliet, IL | 72.1 | 72.3 | 87.1 | 10.0 | 88.0 | 95.8 |
| 72 | Costa Mesa, CA | 72.0 | 100.0 | 100.0 | 3.0 | 80.8 | 76.4 |
| 73 | Victorville, CA | 72.0 | 92.6 | 94.8 | 0.9 | 77.4 | 93.4 |
| 74 | High Point, NC | 72.0 | 76.7 | 97.0 | 5.4 | 74.3 | 96.3 |
| 75 | Gresham, OR | 72.0 | 67.7 | 98.5 | 9.4 | 78.3 | 90.4 |
| 76 | Oceanside, CA | 71.9 | 93.0 | 89.6 | 11.4 | 83.0 | 84.3 |
| 77 | Pasadena, TX | 71.9 | 80.4 | 88.4 | 10.1 | 80.5 | 95.9 |
| 78 | Ann Arbor, MI | 71.8 | 73.2 | 89.7 | 9.5 | 88.5 | 90.0 |
| 79 | Concord, CA | 71.8 | 91.3 | 97.4 | 2.8 | 80.8 | 83.6 |
| 80 | Aurora, IL | 71.6 | 70.9 | 89.4 | 6.7 | 86.6 | 95.1 |
| 81 | Peoria, AZ | 71.5 | 90.3 | 88.2 | 1.4 | 86.2 | 92.6 |
| 82 | Lakewood, CO | 71.5 | 73.5 | 90.8 | 30.1 | 67.1 | 87.4 |
| 83 | Inglewood, CA | 71.5 | 93.5 | 100.0 | 0.5 | 78.0 | 82.0 |
| 84 | Columbia, MO | 71.4 | 74.3 | 85.3 | 15.3 | 81.1 | 95.6 |
| 85 | Daly City, CA | 71.3 | 88.6 | 99.8 | 4.2 | 89.5 | 69.1 |
| 86 | Fargo, ND | 71.3 | 69.6 | 95.7 | 7.3 | 76.2 | 94.6 |
| 87 | Hampton, VA | 71.3 | 78.0 | 90.0 | 4.1 | 82.7 | 95.6 |
| 88 | Providence, RI | 71.3 | 69.1 | 97.9 | 4.5 | 76.9 | 93.6 |
| 89 | Rochester, MN | 71.3 | 67.3 | 89.0 | 6.7 | 88.2 | 94.1 |
| 90 | Montgomery, AL | 71.1 | 75.3 | 98.1 | 3.2 | 69.8 | 97.8 |
| 91 | Clovis, CA | 71.1 | 84.2 | 88.8 | 1.0 | 87.8 | 91.5 |
| 92 | Oxnard, CA | 71.1 | 88.9 | 92.3 | 3.1 | 83.1 | 86.3 |
| 93 | Chattanooga, TN | 70.9 | 71.8 | 98.1 | 22.7 | 53.7 | 95.1 |
| 94 | Lafayette, LA | 70.9 | 75.8 | 96.7 | 5.0 | 71.0 | 95.5 |
| 95 | Independence, MO | 70.8 | 74.9 | 91.9 | 11.6 | 70.5 | 96.6 |
| 96 | Odessa, TX | 70.8 | 87.4 | 96.6 | 3.3 | 67.5 | 94.6 |
| 97 | West Jordan, UT | 70.8 | 78.1 | 92.6 | 2.1 | 83.8 | 90.0 |
| 98 | Westminster, CO | 70.7 | 74.8 | 92.5 | 17.7 | 70.7 | 88.9 |
| 99 | Kenosha, WI | 70.6 | 72.2 | 86.9 | 5.0 | 86.0 | 95.3 |
| 100 | Grand Rapids, MI | 70.4 | 70.8 | 94.6 | 3.9 | 75.4 | 95.2 |
Best Small Cities for Working From Home
1. Fairview Park, Ohio
With 0.16 acres of park per resident, and near universal broadband actress, Fairview Park, Ohio was the top small city for working from home. Ninety-nine percent of residents in Fairview Park had access to two or more providers of high-speed 100 Mbps broadband internet access. The city, which is located just west of Cleveland, offers low crime, as well as affordable homes, with an average 3-bedroom costing roughly $190,000.
| Rank | City | Overall Score | Weather Score | Broadband Score | Park Score | Crime Score | Housing Score |
|---|---|---|---|---|---|---|---|
| 1 | Fairview Park, OH | 95.4 | 74.7 | 99.5 | 100.0 | 95.0 | 95.1 |
| 2 | Beaumont, CA | 94.3 | 93.4 | 99.3 | 100.0 | 85.2 | 90.7 |
| 3 | Hurricane, UT | 93.6 | 84.2 | 99.8 | 95.5 | 88.5 | 92.1 |
| 4 | Pelham, AL | 92.2 | 73.0 | 92.9 | 100.0 | 90.1 | 95.0 |
| 5 | La Grange Park, IL | 91.9 | 72.8 | 88.7 | 100.0 | 98.3 | 91.7 |
| 6 | Lino Lakes, MN | 91.9 | 69.7 | 91.5 | 100.0 | 95.7 | 91.5 |
| 7 | Aurora, OH | 91.4 | 71.8 | 91.9 | 94.5 | 95.5 | 93.0 |
| 8 | Mendota Heights, MN | 90.7 | 70.5 | 91.9 | 100.0 | 91.2 | 89.2 |
| 9 | Orinda, CA | 90.4 | 91.3 | 99.7 | 100.0 | 97.7 | 59.2 |
| 10 | Glassboro, NJ | 89.8 | 73.8 | 97.0 | 83.2 | 88.0 | 95.3 |
| 11 | Avondale, AZ | 89.0 | 90.3 | 85.0 | 100.0 | 79.0 | 93.4 |
| 12 | Poway, CA | 88.8 | 93.0 | 90.0 | 88.0 | 93.3 | 81.1 |
| 13 | Canton, IL | 88.7 | 72.3 | 97.6 | 70.4 | 92.1 | 98.2 |
| 14 | Zion, IL | 88.3 | 72.1 | 89.9 | 96.6 | 77.3 | 96.9 |
| 15 | Ringwood, NJ | 87.6 | 71.1 | 76.3 | 100.0 | 98.0 | 90.1 |
| 16 | Kinnelon, NJ | 86.8 | 70.0 | 75.0 | 100.0 | 99.4 | 87.0 |
| 17 | Issaquah, WA | 86.5 | 59.1 | 92.2 | 100.0 | 86.0 | 78.6 |
| 18 | Taunton, MA | 86.4 | 70.5 | 98.8 | 69.3 | 88.1 | 91.0 |
| 19 | Vandalia, OH | 86.0 | 74.0 | 92.2 | 69.4 | 88.6 | 96.5 |
| 20 | Strongsville, OH | 84.9 | 74.7 | 99.9 | 48.1 | 94.8 | 94.4 |
| 21 | Collinsville, IL | 84.2 | 74.3 | 93.9 | 59.6 | 86.6 | 96.8 |
| 22 | Sharonville, OH | 84.1 | 73.3 | 96.3 | 46.9 | 96.6 | 95.6 |
| 23 | Winfield, KS | 84.0 | 75.9 | 71.1 | 100.0 | 77.7 | 97.7 |
| 24 | Maryland Heights, MO | 84.0 | 75.0 | 99.6 | 54.9 | 82.7 | 95.3 |
| 25 | Loves Park, IL | 84.0 | 70.8 | 74.9 | 90.1 | 84.8 | 97.1 |
| 26 | Superior, WI | 83.8 | 64.6 | 74.5 | 100.0 | 78.3 | 96.6 |
| 27 | Gulf Shores, AL | 83.3 | 74.7 | 75.1 | 100.0 | 74.3 | 92.4 |
| 28 | Anacortes, WA | 83.3 | 54.9 | 77.4 | 100.0 | 87.3 | 85.7 |
| 29 | Meridian, MS | 83.2 | 74.7 | 82.0 | 80.8 | 76.6 | 98.2 |
| 30 | Claremont, CA | 82.9 | 93.5 | 99.9 | 48.5 | 86.7 | 82.5 |
| 31 | Spearfish, SD | 82.8 | 67.7 | 98.4 | 60.8 | 78.3 | 93.3 |
| 32 | Big Rapids, MI | 82.7 | 68.6 | 92.6 | 54.5 | 89.0 | 96.9 |
| 33 | Spartanburg, SC | 82.6 | 76.1 | 85.1 | 100.0 | 50.5 | 96.7 |
| 34 | Mineral Wells, TX | 82.3 | 81.4 | 62.8 | 100.0 | 79.6 | 97.1 |
| 35 | Solon, OH | 82.3 | 74.7 | 91.8 | 46.6 | 96.1 | 93.9 |
| 36 | Gainesville, GA | 82.1 | 73.1 | 91.1 | 65.3 | 77.3 | 94.5 |
| 37 | Trotwood, OH | 82.1 | 74.0 | 81.1 | 84.7 | 68.5 | 98.5 |
| 38 | Tinton Falls, NJ | 82.0 | 72.7 | 95.1 | 45.3 | 96.0 | 89.8 |
| 39 | North Adams, MA | 82.0 | 65.5 | 75.3 | 100.0 | 68.0 | 96.2 |
| 40 | Rancho Santa Margarita, CA | 81.9 | 100.0 | 87.4 | 51.6 | 95.8 | 80.8 |
| 41 | Aliso Viejo, CA | 81.8 | 100.0 | 85.7 | 53.7 | 95.3 | 81.3 |
| 42 | Marana, AZ | 81.7 | 88.6 | 88.5 | 48.1 | 90.4 | 93.2 |
| 43 | San Dimas, CA | 81.6 | 93.5 | 99.8 | 40.6 | 87.8 | 83.1 |
| 44 | La Quinta, CA | 81.5 | 93.4 | 98.2 | 37.3 | 88.3 | 88.0 |
| 45 | Knightdale, NC | 81.0 | 75.4 | 96.3 | 41.9 | 86.4 | 94.6 |
| 46 | Geneva, IL | 80.8 | 70.9 | 97.1 | 32.7 | 97.9 | 92.3 |
| 47 | Highland, CA | 80.7 | 92.6 | 99.8 | 32.1 | 84.4 | 91.1 |
| 48 | Yucca Valley, CA | 80.6 | 92.6 | 71.8 | 70.1 | 85.4 | 93.6 |
| 49 | Shawnee, KS | 80.5 | 75.4 | 99.5 | 33.9 | 88.0 | 93.7 |
| 50 | New Franklin, OH | 80.4 | 74.0 | 83.5 | 48.2 | 95.6 | 95.7 |
| 51 | Sierra Madre, CA | 80.1 | 93.5 | 100.0 | 37.5 | 96.5 | 69.9 |
| 52 | Richland, WA | 80.0 | 85.5 | 99.7 | 30.1 | 86.0 | 91.6 |
| 53 | Decatur, AL | 79.8 | 72.7 | 94.2 | 57.0 | 67.7 | 96.8 |
| 54 | California City, CA | 79.8 | 91.2 | 49.5 | 100.0 | 83.4 | 95.8 |
| 55 | Berea, OH | 79.8 | 74.7 | 99.9 | 19.0 | 96.5 | 96.2 |
| 56 | Yucaipa, CA | 79.6 | 92.6 | 99.3 | 22.8 | 90.5 | 89.6 |
| 57 | Chino Hills, CA | 79.5 | 92.6 | 100.0 | 24.3 | 93.6 | 83.5 |
| 58 | Walker, MI | 79.4 | 70.8 | 90.2 | 47.9 | 84.2 | 94.3 |
| 59 | Mequon, WI | 79.4 | 72.5 | 89.2 | 40.4 | 96.9 | 89.6 |
| 60 | Georgetown, TX | 79.4 | 83.5 | 74.5 | 57.3 | 93.9 | 92.1 |
| 61 | Union City, CA | 79.3 | 92.1 | 99.7 | 38.9 | 85.5 | 76.5 |
| 62 | Greendale, WI | 79.2 | 72.8 | 91.6 | 36.6 | 92.3 | 93.4 |
| 63 | Keene, NH | 79.1 | 64.8 | 75.0 | 71.6 | 84.3 | 95.0 |
| 64 | Homer Glen, IL | 79.1 | 72.3 | 86.8 | 40.2 | 97.8 | 91.4 |
| 65 | Benicia, CA | 79.1 | 88.7 | 92.5 | 37.9 | 92.5 | 82.1 |
| 66 | Beachwood, NJ | 79.0 | 72.8 | 97.0 | 26.2 | 93.5 | 93.7 |
| 67 | Lake Forest, IL | 78.9 | 72.1 | 87.8 | 44.2 | 97.6 | 85.0 |
| 68 | North Olmsted, OH | 78.8 | 74.7 | 99.6 | 18.0 | 93.9 | 95.5 |
| 69 | Ramsey, MN | 78.8 | 69.7 | 89.2 | 39.4 | 93.4 | 92.5 |
| 70 | Medford, MA | 78.7 | 68.5 | 99.2 | 35.3 | 93.8 | 81.5 |
| 71 | Eagan, MN | 78.7 | 70.5 | 95.5 | 32.0 | 91.5 | 91.5 |
| 72 | Antioch, IL | 78.7 | 72.1 | 76.6 | 54.1 | 93.5 | 94.8 |
| 73 | Benbrook, TX | 78.7 | 81.8 | 91.7 | 29.8 | 90.7 | 94.4 |
| 74 | Novato, CA | 78.7 | 85.1 | 78.8 | 64.4 | 91.2 | 77.0 |
| 75 | Agoura Hills, CA | 78.6 | 93.5 | 95.7 | 30.5 | 93.0 | 79.2 |
| 76 | Cedar Hill, TX | 78.5 | 81.0 | 91.5 | 34.4 | 85.4 | 94.7 |
| 77 | Spencer, IA | 78.4 | 70.2 | 99.9 | 21.1 | 89.3 | 96.6 |
| 78 | Montgomery, IL | 78.3 | 70.9 | 99.2 | 22.9 | 89.5 | 95.2 |
| 79 | Golden Valley, MN | 78.3 | 70.4 | 88.0 | 42.8 | 91.2 | 90.5 |
| 80 | Winona, MN | 78.2 | 68.4 | 99.9 | 23.6 | 88.0 | 95.4 |
| 81 | Eden Prairie, MN | 78.2 | 70.4 | 92.9 | 31.7 | 94.3 | 90.5 |
| 82 | Conyers, GA | 78.1 | 75.5 | 86.2 | 57.5 | 70.0 | 96.0 |
| 83 | Grand Rapids, MN | 78.1 | 64.9 | 98.2 | 21.5 | 93.7 | 95.6 |
| 84 | Kingsport, TN | 78.1 | 74.1 | 98.8 | 49.6 | 59.2 | 96.3 |
| 85 | Huntersville, NC | 78.0 | 77.2 | 96.8 | 23.2 | 90.5 | 92.7 |
| 86 | Red Wing, MN | 78.0 | 68.6 | 97.8 | 34.5 | 79.5 | 95.1 |
| 87 | Grapevine, TX | 77.9 | 81.8 | 97.3 | 23.5 | 88.5 | 90.9 |
| 88 | Plainfield, IL | 77.9 | 72.3 | 98.1 | 17.4 | 94.8 | 93.9 |
| 89 | Twinsburg, OH | 77.9 | 74.0 | 97.0 | 16.1 | 96.1 | 94.6 |
| 90 | Imperial Beach, CA | 77.8 | 93.0 | 91.4 | 36.1 | 87.8 | 81.6 |
| 91 | Trenton, MI | 77.8 | 74.8 | 99.6 | 12.8 | 93.4 | 95.8 |
| 92 | Monrovia, CA | 77.8 | 93.5 | 100.0 | 26.0 | 87.5 | 78.6 |
| 93 | Highland Village, TX | 77.7 | 80.9 | 99.7 | 11.7 | 96.2 | 90.9 |
| 94 | Hudson, OH | 77.7 | 74.0 | 89.0 | 27.4 | 98.3 | 92.5 |
| 95 | Tipp City, OH | 77.7 | 74.1 | 75.0 | 51.2 | 92.6 | 94.9 |
| 96 | Bay Village, OH | 77.5 | 74.7 | 100.0 | 9.2 | 97.6 | 93.5 |
| 97 | New Ulm, MN | 77.4 | 70.3 | 73.4 | 52.4 | 93.7 | 95.8 |
| 98 | Yorba Linda, CA | 77.4 | 100.0 | 100.0 | 13.3 | 95.1 | 78.8 |
| 99 | Oswego, IL | 77.4 | 72.0 | 99.0 | 12.5 | 96.0 | 94.1 |
| 100 | Woodland Park, NJ | 77.4 | 71.1 | 92.0 | 29.6 | 94.5 | 89.3 |
Methodology
In this study, AdvisorSmith examined 2,493 U.S. incorporated cities to determine the best small, midsize, and large cities to work from home. To determine the best cities for working from home, we examined five primary criteria in each city: access to broadband internet, parkland per capita, the cost of housing, the quality of weather, and the amount of crime in each city.
These five categories were chosen because they are among the most important factors that affect the daily lives of people working from home. Broadband access is essential for workers to be able to communicate and stay in touch with their employers and coworkers. The cost of housing is usually the largest expense for most households. Parkland, safety, and weather are primary determinants of the quality of life for workers who may be social distancing due to the coronavirus pandemic and conducting the majority of their leisure activities outdoors.
For each of these five categories, we assigned a score to each city, and we then calculated a weighted average of the scores to determine an overall score. The weights used for each category were 30% for broadband access, 20% for parkland, 20% for housing costs, 20% for crime, and 10% for weather.
We also divided the cities by their population sizes, with large cities having over 250,000 residents; midsize cities with between 100,000 to 250,000 residents; and small cities having between 10,000 and 100,000 residents.
To determine broadband availability, we examined the percentage of the population with access to at least one or more, and two or more providers of high-speed broadband internet with at least 100 Mbps download speeds. Cities with two or more providers had higher scores because the availability of additional choices generally reduces internet access costs. We used data from the Federal Communications Commission to determine the number of city residents with access to broadband providers.
In order to determine the cost of housing, we used the average home price from Zillow for a 3-bedroom housing unit in each city, and we assigned each city a scaled score with higher scores for lower housing costs.
Our study used data from the ParkServe Dataset from The Trust for Public Land, which contains data about all the parks in the U.S. We calculated the acres of park in each city by adding all the park acres within each city’s city limits, and we then divided the acres of park by the number of residents in the city. We capped the maximum score for parkland at 20 times the median acres of park per capita, as there are diminishing returns to park usage once the park has reached a large enough size.
We calculated a weather score for each city using data from the NOAA, which includes data on maximum and minimum temperatures for counties around the U.S., along with data on precipitation. We assigned each city to a county, and we assigned that county’s weather score to the underlying cities. The county-level data was based upon the number of degrees that the maximum and minimum temperature was outside and ideal range of between 60 to 80 degrees Fahrenheit. Weather scores also were reduced based upon the amount of precipitation in each city, as rain generally reduces the ability to enjoy outdoor activities.
Finally, we used a crime score for each city based upon values calculated by AdvisorSmith’s Safest Cities in America report, with cities experiencing lower crime rates scoring more highly in this study.
Sources
1. Federal Communications Commission, Fixed Broadband Deployment
2. Zillow Home Value Index (Data Provided by Zillow Group)
3. The Trust for Public Land, U.S. ParkServe Dataset
4. National Oceanic and Atmospheric Administration, National Centers for Environmental Information, Climate at a Glance
5. Federal Bureau of Investigation, Uniform Crime Reporting, Return A, 2018
6. AdvisorSmith, Safest Cities in America