


Plumbers, pipefitters, and steamfitters are an essential part of our cities and businesses, providing and maintaining the systems that facilitate clean drinking water, sanitation, chemical transport, and energy production. As the economy and housing market continue to grow at a steady clip, demand for plumbers, pipefitters, and steamfitters is increasing. The Bureau of Labor Statistics predicts a 14% growth in employment for plumbers, pipefitters, and steamfitters over the next ten years. Given this high demand, plumbers have the option to settle down in a variety of cities, but where exactly are the best opportunities?
Our study at AdvisorSmith ranked 349 U.S. cities to determine the most attractive cities for plumbers, pipefitters, and steamfitters to pursue their careers in. We list the top 50 cities for plumbers, pipefitters, and steamfitters below, and we also break down the top small, midsize, and large cities for plumbers, pipefitters, and steamfitters.
Our analysis found that many of the best cities for plumbers, pipefitters, and steamfitters are small and midsize cities. Smaller cities have, on average, older populations as compared to big cities, and many plumbers, pipefitters, and steamfitters are needed to replace those who are expected to retire over the next 10 years.
Moreover, many of the top cities in our study are experiencing high growth in their local economies, hot housing markets, or job growth related to the energy sector. High demand for housing means faster development of new construction and more home sales, meaning greater demand for plumbers to tackle home renovations, maintenance, and new plumbing installation. With cities tied closely to new energy projects, like natural gas or oil pipelines, there is a greater need for pipefitters and steamfitters.
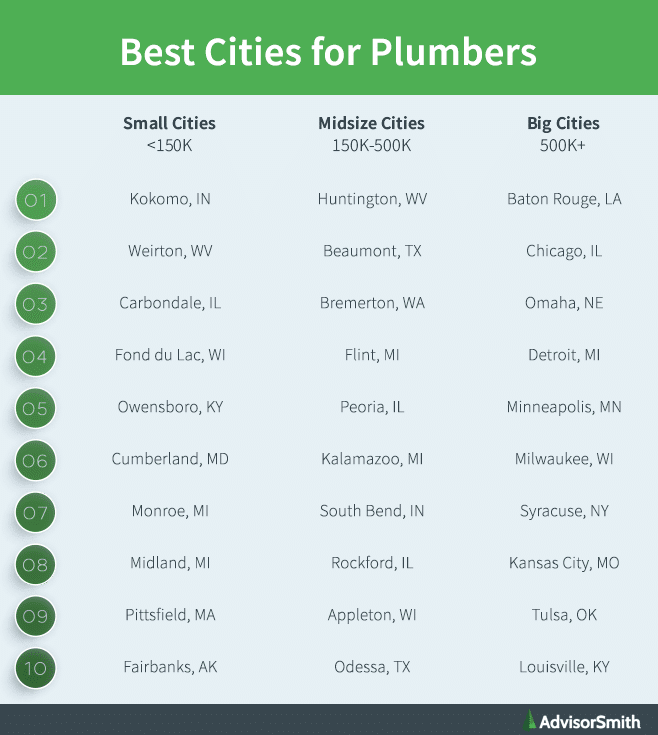
Top Cities for Plumbers by City Size
Thirty-nine of the top 50 best cities for plumbers, pipefitters, and steamfitters are small or midsize cities, but the small town atmosphere may not be ideal for everyone. In order to highlight this distinction in lifestyle preference, our study segments cities into different sizes based on metro area population, listing the top 10 small (population under 150,000), midsize (population of 150,000-500,000), and large (greater than 500,000 population) cities for plumbers.

Best Cities for Plumbers
1. Kokomo, IN
Located 50 miles north of Indianapolis, Kokomo is the top city in our study of the best cities for plumbers, pipefitters, and steamfitters. Kokomo, Indiana’s 13th-largest city, has historically been known for its manufacturing industry, with top employers including Fiat Chrysler Automobiles, General Motors, and Haynes International. During the late 2000s, Kokomo was hard hit by the Great Depression, particularly because of its close ties to the auto industry and that industry’s steep decline. Since then, however, Kokomo has experienced a tremendous rebound, with unemployment dropping to 3.1% in December 2017, down from its peak of 20.2% in June 2009. Much of this can be attributed to the auto bailout, but Kokomo has also made efforts to diversify its economy and reinvest stimulus funds into its local economy to improve quality of life and housing.
The city of Kokomo has 211% more jobs for plumbers, pipefitters, and steamfitters than the average American city. Plumbers, pipefitters, and steamfitters earned an average salary of $71,480 in Kokomo, which exceeds the national average by 23%. Those salaries go far in Kokomo, as the city boasts a cost of living 22% below the average U.S. city.
2. Huntington, WV
Huntington is the #1 midsize city in our study for plumbers, pipefitters, and steamfitters. Located on the western edge of West Virginia, sharing its northern border with Ohio and close to the eastern border of Kentucky, Huntington is part of the Huntington-Ashland metropolitan area, often called the “Tri-State area.” Huntington has an economy that has historically been fueled by the natural resources available, including steel, coal, oil, and natural gas, and some of the top-paying industries in the city include Utilities, Mining, and Oil and Gas Extraction. Top employers in the Huntington area include CSX Huntington, Marathon Petroleum, and Steel of West Virginia.
Plumbers, pipefitters, and steamfitters in Huntington earned an average annual salary of $85,050, the highest salary in our study, which is 46% above the national average. The city also has a cost of living that is 18% lower than the average U.S. city.
3. Weirton, WV
Weirton is located in the Northern Panhandle region of West Virginia, sandwiched in between Ohio and Pennsylvania, and is part of the Weirton-Steubenville metropolitan area. Weirton’s economy has historically been dominated by the steel industry, with ArcelorMittal as the top industry employer. As that industry has declined in recent years, however, the energy industry has been the driving force behind Weirton’s economy. The growing shale industry has served as a boon to the Northern Panhandle, with natural gas production fueling other economic areas as well, including the metal, chemical, and construction industries.
Weirton hosts an incredible 118% more jobs for plumbers, pipefitters, and steamfitters on a per-capita basis compared with the U.S. average. Additionally, salaries for plumbers in Weirton average $68,480, 23% above the average, while the cost of living is 19% below the national average.
4. Beaumont, TX
Situated about 85 miles east of Houston, Beaumont is part of the Beaumont-Port Arthur metropolitan area, a major industrial area on the Texas Gulf Coast. Beaumont’s economy and history has been significantly influenced by the discovery of oil at Spindletop in the early 1900s. This oil field was one of the largest discovered in American history, and to this day, it continues to drive Beaumont’s economy. Beaumont is one of the major petrochemical refining areas in the nation, and top employers in the area include ExxonMobil Corporation, Goodyear Tire and Rubber Company, and Valero Energy.
Beaumont plumbers earn on average $58,550 annually, just a touch higher than the national average. Beaumont also boasts 208% more jobs for plumbers, pipefitters, and steamfitters compared with the average U.S. city, with a cost of living that is 18% below the national average.
5. Bremerton, WA
Located just west of Seattle, Bremerton is part of the Bremerton-Silverdale metroplitan area, a group of island communities across Puget Sound’s main channel. Just a 30-minute ferry ride from Seattle, Bremerton has seen a jump in the local housing market as home buyers seek out affordability that offers a manageable commute to downtown Seattle. Much of the housing boom from nearby King County, which includes cities Seattle and Bellevue, has spilled over to Bremerton, with prices in Bremerton up over 20% in the last year, multiple offers the norm, and homes sitting on the market for less than 10 days on average.
Bremerton benefits from a strong demand for plumbers, hosting 331% more jobs for plumbers on a per-capita basis compared with the national average. Plumbers, pipefitters, and steamfitters in Bremerton also enjoy an above average salary of $63,970, exceeding the national average by 10%.
Top 50 Cities for Plumbers
Below, we list the top 50 cities for plumbers, pipefitters, and steamfitters. In addition to the ranking, we provide the total number of jobs for plumbers, along with the average annual salary, location quotient, cost of living, and the size of the city.
| Rank | City | City Size | Average Annual Salary | Total Jobs | Location Quotient | Cost of Living |
|---|---|---|---|---|---|---|
| 1 | Kokomo, IN | Small | $71,480 | 370 | 3.11 | 78 |
| 2 | Huntington, WV | Midsize | $85,050 | 360 | 0.92 | 82 |
| 3 | Weirton, WV | Small | $68,480 | 240 | 2.18 | 81 |
| 4 | Beaumont, TX | Midsize | $58,550 | 1,490 | 3.08 | 82 |
| 5 | Bremerton, WA | Midsize | $63,970 | 1,160 | 4.31 | 124 |
| 6 | Flint, MI | Midsize | $67,040 | 780 | 1.88 | 82 |
| 7 | Peoria, IL | Midsize | $76,580 | 750 | 1.46 | 89 |
| 8 | Carbondale, IL | Small | $74,030 | 200 | 1.25 | 84 |
| 9 | Kalamazoo, MI | Midsize | $68,960 | 810 | 1.89 | 87 |
| 10 | South Bend, IN | Midsize | $66,420 | 730 | 1.82 | 84 |
| 11 | Rockford, IL | Midsize | $74,420 | 470 | 1.04 | 84 |
| 12 | Appleton, WI | Midsize | $67,100 | 890 | 2.40 | 95 |
| 13 | Fond du Lac, WI | Small | $65,730 | 260 | 1.90 | 88 |
| 14 | Odessa, TX | Midsize | $43,990 | 850 | 3.67 | 87 |
| 15 | Baton Rouge, LA | Large | $58,510 | 3,150 | 2.63 | 92 |
| 16 | Erie, PA | Midsize | $71,980 | 420 | 1.13 | 88 |
| 17 | Owensboro, KY | Small | $59,280 | 330 | 2.09 | 87 |
| 18 | Champaign, IL | Midsize | $65,500 | 480 | 1.59 | 90 |
| 19 | Canton, OH | Midsize | $62,050 | 750 | 1.46 | 85 |
| 20 | Cumberland, MD | Small | $64,050 | 140 | 1.26 | 85 |
| 21 | Elizabethtown, KY | Midsize | $55,220 | 350 | 2.13 | 87 |
| 22 | Evansville, IN | Midsize | $57,980 | 850 | 1.80 | 86 |
| 23 | Billings, MT | Midsize | $63,710 | 570 | 2.21 | 103 |
| 24 | Cedar Rapids, IA | Midsize | $56,530 | 970 | 2.27 | 93 |
| 25 | Fort Wayne, IN | Midsize | $60,320 | 910 | 1.39 | 84 |
| 26 | St. Cloud, MN | Midsize | $60,760 | 680 | 2.13 | 99 |
| 27 | Chicago, IL | Large | $83,080 | 12,890 | 0.92 | 109 |
| 28 | Omaha, NE | Large | $61,650 | 2,170 | 1.46 | 89 |
| 29 | Kennewick, WA | Midsize | $71,770 | 450 | 1.31 | 103 |
| 30 | Monroe, MI | Small | $67,030 | 120 | 1.04 | 92 |
| 31 | Detroit, MI | Large | $65,490 | 5,640 | 0.95 | 89 |
| 32 | Jefferson City, MO | Midsize | $66,240 | 230 | 1.00 | 91 |
| 33 | Minneapolis, MN | Large | $81,320 | 5,700 | 0.96 | 111 |
| 34 | Milwaukee, WI | Large | $75,350 | 2,320 | 0.90 | 102 |
| 35 | Midland, MI | Small | $52,690 | 230 | 2.17 | 91 |
| 36 | Corpus Christi, TX | Midsize | $51,180 | 1,130 | 1.99 | 86 |
| 37 | Pittsfield, MA | Small | $76,480 | 130 | 1.07 | 108 |
| 38 | Syracuse, NY | Large | $63,350 | 1,010 | 1.10 | 90 |
| 39 | Gulfport, MS | Midsize | $50,490 | 1,010 | 2.22 | 90 |
| 40 | Kansas City, MO | Large | $64,780 | 3,690 | 1.15 | 94 |
| 41 | Sioux City, IA | Midsize | $59,500 | 300 | 1.19 | 87 |
| 42 | Rochester, MN | Midsize | $57,960 | 720 | 2.05 | 101 |
| 43 | Fairbanks, AK | Small | $74,980 | 180 | 1.64 | 120 |
| 44 | Topeka, KS | Midsize | $51,930 | 500 | 1.51 | 82 |
| 45 | Homosassa Springs, FL | Small | $48,510 | 230 | 2.30 | 91 |
| 46 | Tulsa, OK | Large | $55,710 | 1,890 | 1.44 | 87 |
| 47 | Mankato, MN | Small | $70,270 | 150 | 0.94 | 100 |
| 48 | Louisville, KY | Large | $57,600 | 2,580 | 1.31 | 88 |
| 49 | Lexington, KY | Large | $60,330 | 1,080 | 1.30 | 92 |
| 50 | Lima, OH | Small | $56,750 | 180 | 1.17 | 85 |
Related Articles for Plumbers
Methodology
AdvisorSmith’s study weighed several factors in determining the best cities for plumbers, pipefitters, and steamfitters.
1. Average annual compensation for plumbers
Our study used the average annual salaries that plumbers, pipefitters, and steamfitters in each city were paid, with cities with higher salaries scoring more highly in our study.
In 2018, the average annual salary for plumbers, pipefitters, and steamfitters in the U.S. was $58,150.
2. Cost of living index for each city
Our analysis adjusted the salaries earned in each city by a cost of living index, in order to equalize comparisons across cities. The cost of living, including necessities such as rent, transportation, and groceries, varies by city, so it is important to normalize the salaries so that the cities can be compared fairly. Cities with a lower cost of living were ranked more highly in our study.
3. The density of jobs for plumbers in each city
The location quotient measures the availability of jobs for plumbers, pipefitters, and steamfitters in a given city, relative to the total number of jobs in the city. Cities with a higher location quotient have a higher concentration of jobs for plumbers, which means more career opportunities for plumbers in those cities. Cities with higher location quotients ranked more highly in our study of the best cities for plumbers, pipefitters, and steamfitters.
In 2018, there were 500,300 jobs for plumbers, pipefitters, and steamfitters in the United States, according to the Bureau of Labor Statistics. The BLS also predicts that employment for plumbers, pipefitters, and steamfitters will grow at a 14% pace over the 10-year period of 2018-2028, which is almost three times faster than the national job growth outlook.
Demand for plumbers continues to be bolstered by new construction in housing and commercial buildings, as well as changes in building codes that require retrofitting of existing plumbing systems. While employment can vary based on how the economy is doing—there is generally less new construction when the economy is in a downturn—repairs and maintenance of existing plumbing and pipes provides stable work for plumbers, pipefitters, and steamfitters.
Sources
[1] Bureau of Labor Statistics Occupational Outlook Handbook
[2] Bureau of Labor Statistics Occupational Employment Statistics
[3] Sperling’s Best Places Cost of Living Index