


With climate change spurring intense and longer wildfire seasons, fire safety and preparation is no longer an option. As seen in the United States and across the world in Australia and the Amazon, wildfires are devastating and can dramatically affect the economy of a region.
With the growing frequency and severity of wildfires, firefighters are needed more than ever to protect cities and communities. It’s also important to note that today’s firefighters do much more than fight fires. These brave men and women are often the first to be called on to respond to medical, environmental, and chemical emergencies. While a promising occupation, firefighting is not without extreme dangers, necessitating good employee pay, benefits, as well as solid insurance coverage like workers’ compensation.
In 2018, there were 332,400 jobs for firefighters, and according to the Bureau of Labor Statistics, employment for firefighters is expected to grow by 5% over the next ten years. With so many areas in need of firefighters, where are the best cities for firefighters to work in the United States?
Here at AdvisorSmith, we conducted a study on 311 U.S. cities to determine the best places for firefighters to pursue their careers in. Our rankings were based on several key factors including average annual salary, cost of living, and location quotient, and cities were categorized into small, midsize, and large cities based on metropolitan statistical area population. After careful analysis, we determined the top 50 most attractive cities for firefighters.
Top Cities for Firefighters by City Size
The majority of the top cities in our study—41 out of 50—were small or midsized cities. Many small and midsized city fire departments are made up almost entirely of volunteer or part-time firefighters, and much of the job growth for firefighters is occurring where volunteer positions are converted to full-time paid positions.
In our study, cities were categorized into different sizes to account for a variety of lifestyle preferences. These are the ten best small (population less than 150,000), midsize (population between 150,000 and 500,000), and large (population greater than 500,000) cities for firefighters in the United States.

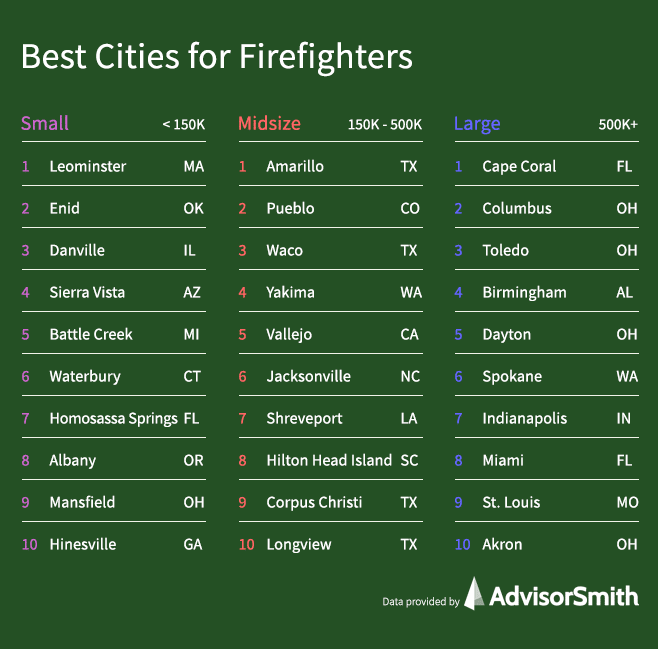
Best Cities for Firefighters
1. Amarillo, TX
Amarillo, Texas, was the best city for firefighters in our study. Located in northern Texas, in a region known as the Panhandle, Amarillo shares a semi-arid climate with many cities and regions in the South. Texas has one of the highest levels of wildfire risk in the nation, and this danger is only exacerbated in Amarillo by the dense acres of prairieland and tall grasses all around. Amarillo is the regional economic center for the Panhandle, and with a low unemployment rate of 2.6% and projected annual job growth of 1.1%, there are ample opportunities for firefighters.
The average firefighter salary in Amarillo is $61,450, 15% higher than the average firefighter salary in the U.S. There are 85% more firefighting jobs in Amarillo on a per-capita basis than the average U.S. city, and the cost of living is 16% below the national average.
2. Pueblo, CO
Pueblo, Colorado, is a midsized city situated on the Front Range of the Rocky Mountains. It is bounded by dense national forests to the west and the Great Plains to the east. Together, both of these grass-heavy areas pose a serious wildfire risk to Pueblo, naturally increasing the demand for firefighters in the area. Pueblo is home to Colorado State University, Pueblo, one of the fastest growing universities in the state, and the city has been consistently rated as one of the most affordable places to live in the nation.
Pueblo pays firefighters an average annual salary of $58,030, which is 9% higher than the national firefighter salary. It also offers 90% more firefighting jobs per capita than the average U.S. city, which is bolstered by a cost of living 15% below the national average.
3. Leominster, MA
Leominster, Massachusetts, is a small city located in Worcester County. As the top small city for firefighters in our study, we found Leominster to be a pleasant city to live in with great public schools and a vibrant local culture. There is a high demand for firefighters in the area, however, due to an aging population in Worcester County. Naturally, this has led to an increase in emergency calls over the years. Fire departments in the area tend to rely heavily on volunteer firefighters but are in need of a full roster of firefighters in order to respond quickly and effectively. Understandably, Leominster has the third-most jobs for firefighters on a per-capita basis among all cities in our study.
The average firefighter salary in Leominster is $52,970, which is approximately equal to the average national salary paid to firefighters. Although the cost of living in Leominster is 12% higher than the national average, the city boasts 179% more jobs for firefighters on a per-capita basis than the average U.S. city.
4. Waco, TX
Waco, Texas, has a high need for firefighters due to a combination of climate, geography, and location in central Texas. Texas has one of the highest risks for wildfires in the nation due to its abundance of prairie grasslands as well as its proximity to the equator, which causes summertime temperatures to soar above 100°F on a consistent basis. The high prevalence and severity of wildfires naturally heightens demand for capable and professional firefighters. More generally, Waco is home to Baylor University, one of the top colleges in Texas. The city also has fantastic public schools, a diverse community, and a family-friendly feel.
The average annual firefighter salary in Waco is $66,720, 25% higher than the national average. The cost of living is 16% below the national average, and the city has 15% more jobs on a per-capita basis than the average U.S. city.
5. Yakima, WA
Yakima is a midsized city in Washington with a metro area population of 250,193. Located in southern Washington, Yakima shares a moderate to high wildfire risk with the rest of Washington. This risk may only be getting worse as the effects of climate change continue to persist throughout the Northwest. Yakima is situated in the Yakima Valley, which is known to be one of the most productive regions for apples, wine, and hops in the world. With an abundance of outdoor activities and a job growth rate of 2.3%, firefighters should be able to find a healthy balance of work and life in Yakima.
Yakima pays firefighters an annual salary of $55,430 on average, 4% higher than the average salary for firefighters in the U.S. The cost of living in Yakima is 7% below the national average, and there are 116% more jobs for firefighters here than in the average U.S. city.
Top 50 Cities for Firefighters
Below are the top 50 cities for firefighters. In addition to rank, we include for each city its size, average annual salary, total number of available jobs, location quotient, and cost of living.
| Rank | City | City Size | Average Annual Salary | Total Jobs | Location Quotient | Cost of Living |
|---|---|---|---|---|---|---|
| 1 | Amarillo, TX | Midsize | $61,450 | 470 | 1.85 | 84 |
| 2 | Pueblo, CO | Midsize | $58,030 | 250 | 1.90 | 85 |
| 3 | Leominster, MA | Small | $52,970 | 320 | 2.79 | 112 |
| 4 | Waco, TX | Midsize | $66,720 | 300 | 1.15 | 84 |
| 5 | Yakima, WA | Midsize | $55,430 | 440 | 2.16 | 93 |
| 6 | Vallejo, CA | Midsize | $99,610 | 470 | 1.54 | 139 |
| 7 | Enid, OK | Small | $57,790 | 90 | 1.63 | 84 |
| 8 | Jacksonville, NC | Midsize | $42,720 | 290 | 2.77 | 92 |
| 9 | Shreveport, LA | Midsize | $37,690 | 1,080 | 2.78 | 86 |
| 10 | Hilton Head Island, SC | Midsize | $42,680 | 520 | 3.07 | 117 |
| 11 | Danville, IL | Small | $54,480 | 80 | 1.40 | 79 |
| 12 | Corpus Christi, TX | Midsize | $50,180 | 800 | 1.92 | 86 |
| 13 | Longview, TX | Midsize | $61,790 | 280 | 1.35 | 89 |
| 14 | Cape Coral, FL | Large | $58,490 | 1,150 | 1.95 | 105 |
| 15 | Yuma, AZ | Midsize | $49,200 | 280 | 2.08 | 93 |
| 16 | Sierra Vista, AZ | Small | $39,970 | 180 | 2.53 | 91 |
| 17 | Atlantic City, NJ | Midsize | $74,130 | 320 | 1.13 | 104 |
| 18 | Killeen, TX | Midsize | $43,730 | 630 | 2.04 | 82 |
| 19 | Lake Havasu City, AZ | Midsize | $45,910 | 280 | 2.55 | 106 |
| 20 | Battle Creek, MI | Small | $58,040 | 140 | 1.19 | 83 |
| 21 | Tyler, TX | Midsize | $47,590 | 480 | 2.14 | 93 |
| 22 | Columbus, OH | Large | $54,650 | 3,930 | 1.68 | 91 |
| 23 | Beaumont, TX | Midsize | $55,120 | 460 | 1.30 | 82 |
| 24 | Waterbury, CT | Small | $68,190 | 180 | 1.16 | 100 |
| 25 | South Bend, IN | Midsize | $53,160 | 410 | 1.39 | 84 |
| 26 | Homosassa Springs, FL | Small | $48,640 | 130 | 1.87 | 91 |
| 27 | Toledo, OH | Large | $51,130 | 960 | 1.46 | 84 |
| 28 | Albany, OR | Small | $72,920 | 100 | 0.97 | 104 |
| 29 | Montgomery, AL | Midsize | $43,770 | 740 | 2.02 | 89 |
| 30 | Birmingham, AL | Large | $47,030 | 1,900 | 1.67 | 84 |
| 31 | Visalia, CA | Midsize | $66,410 | 370 | 1.10 | 99 |
| 32 | Mansfield, OH | Small | $38,100 | 240 | 2.16 | 83 |
| 33 | Hinesville, GA | Small | $42,630 | 80 | 1.91 | 84 |
| 34 | Dayton, OH | Large | $45,510 | 1,460 | 1.73 | 84 |
| 35 | Spokane, WA | Large | $64,550 | 610 | 1.16 | 99 |
| 36 | Brownsville, TX | Midsize | $42,540 | 510 | 1.66 | 77 |
| 37 | Tuscaloosa, AL | Midsize | $49,040 | 410 | 1.81 | 95 |
| 38 | Crestview, FL | Midsize | $39,370 | 610 | 2.47 | 102 |
| 39 | St. Joseph, MO | Small | $46,700 | 190 | 1.62 | 85 |
| 40 | Longview, WA | Small | $68,950 | 80 | 0.99 | 103 |
| 41 | Indianapolis, IN | Large | $54,060 | 3,070 | 1.33 | 90 |
| 42 | Miami, FL | Large | $69,690 | 7,020 | 1.22 | 113 |
| 43 | Sebastian, FL | Midsize | $39,180 | 270 | 2.36 | 100 |
| 44 | Barnstable Town, MA | Midsize | $63,890 | 480 | 2.08 | 144 |
| 45 | Decatur, IL | Small | $45,920 | 140 | 1.28 | 77 |
| 46 | Muncie, IN | Small | $47,830 | 120 | 1.15 | 77 |
| 47 | St. Louis, MO | Large | $57,940 | 3,250 | 1.07 | 91 |
| 48 | Lubbock, TX | Midsize | $46,830 | 490 | 1.54 | 86 |
| 49 | Texarkana, TX | Midsize | $47,530 | 160 | 1.31 | 81 |
| 50 | Watertown, NY | Small | $47,860 | 140 | 1.62 | 91 |
Methodology
AdvisorSmith analyzed three key factors to determine the best cities for firefighters:
1. Average annual salary for firefighters
We gathered the average annual salary of firefighters in each city and ranked cities higher if they paid firefighters more. The annual average salary for firefighters in the U.S. in 2018 was $53,240.
2. Cost of living index for each city
We adjusted the average annual salary of each city against a national cost of living index in order to standardize the annual salaries for comparison. Cities with a lower cost of living were ranked higher.
3. Density of jobs for firefighters in each city
We utilized a location quotient to determine the density of jobs for firefighters in each city. We calculated the location quotient by measuring the number of jobs for firefighters against the total number of available jobs in each city. Cities with a higher location quotient were ranked higher.
There were 332,400 jobs for firefighters in 2018, and employment for firefighters is expected to grow by 5% from 2018 to 2028. This is similar to the average national job growth outlook for all occupations.
Sources
[1] Bureau of Labor Statistics Occupational Outlook Handbook
[2] Bureau of Labor Statistics Occupational Employment Statistics
[3] Sperling’s Best Places Cost of Living Index