


Entrepreneurship and business ownership is an important driver of economic and job growth in the United States. While the majority of businesses in the United States are owned by men, entrepreneurship by women is a growing trend that adds to the vitality of the country’s economy. In this analysis, AdvisorSmith takes a look at the numbers to understand the states in which female entrepreneurs are having the most success with their businesses.
To find the best and worst states for female entrepreneurs, we examined female-owned businesses with at least one employee in all 50 states and the District of Columbia. These businesses accounted for over 2 million firms and employed more than 18.1 million Americans, having a significant impact on the national economy.

We studied the average number of employees, the average payroll, and the percentage of the female labor force that owned businesses with at least $100K in revenue and at least one employee. Nationwide, female-owned businesses had 9 employees on average, and an average payroll of $330,171. Female-owned employer businesses with at least $100K in revenue accounted for 1.7% of the female labor force nationwide. We compared these metrics across the states to find the best and worst states for female entrepreneurs.
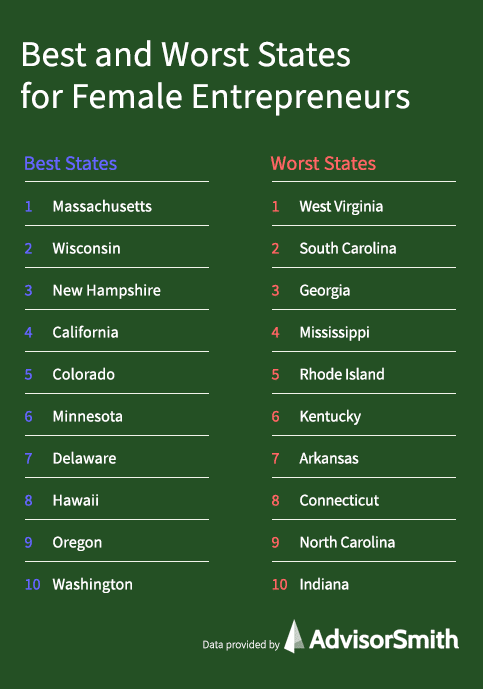
Best States for Female Entrepreneurs
1. Massachusetts
Massachusetts, the Bay State, was the best state for female entrepreneurs nationwide. In Massachusetts, the average female-owned business had 9.7 employees, and an average payroll of $451K, both well above the national averages.
2. Wisconsin
Wisconsin’s female-owned firms were the second largest in the nation by employment count, with an average of 11.6 employees per company. These companies also had an above average payroll of $426K, while the rate of female business ownership was in line with the national average.
3. New Hampshire
New Hampshire had above-average female business ownership, at 1.8%, while also having higher-than-average employee counts of 9.7 and average payroll of $383K.
| Rank | State | Female-Owned Businesses with Employees | Total Employees | Average Employees per Company | Average Payroll per Company | Proportion of Female-Owned Businesses |
|---|---|---|---|---|---|---|
| 1 | Massachusetts | 39,543 | 384,378 | 9.7 | $451,059 | 1.8% |
| 2 | Wisconsin | 35,538 | 413,344 | 11.6 | $425,831 | 1.7% |
| 3 | New Hampshire | 8,744 | 84,683 | 9.7 | $383,225 | 1.8% |
| 4 | California | 272,123 | 2,453,283 | 9.0 | $375,636 | 2.0% |
| 5 | Colorado | 50,939 | 419,483 | 8.2 | $327,402 | 2.3% |
| 6 | Minnesota | 36,388 | 356,327 | 9.8 | $346,337 | 1.8% |
| 7 | Delaware | 6,113 | 54,597 | 8.9 | $383,391 | 1.8% |
| 8 | Hawaii | 9,106 | 87,140 | 9.6 | $319,668 | 1.9% |
| 9 | Oregon | 35,104 | 299,517 | 8.5 | $299,964 | 2.3% |
| 10 | Washington | 63,892 | 532,557 | 8.3 | $321,332 | 2.3% |
| 11 | District of Columbia | 4,175 | 50,158 | 12.0 | $588,009 | 1.4% |
| 12 | New Jersey | 54,448 | 493,818 | 9.1 | $372,766 | 1.7% |
| 13 | Texas | 156,541 | 1,641,465 | 10.5 | $387,830 | 1.5% |
| 14 | Oklahoma | 24,187 | 238,397 | 9.9 | $334,653 | 1.7% |
| 15 | South Dakota | 8,555 | 56,001 | 6.5 | $215,522 | 2.8% |
| 16 | Alaska | 7,125 | 39,268 | 5.5 | $323,646 | 2.2% |
| 17 | Idaho | 16,954 | 113,485 | 6.7 | $209,620 | 2.7% |
| 18 | Missouri | 40,548 | 389,272 | 9.6 | $282,205 | 1.7% |
| 19 | Arizona | 44,237 | 424,934 | 9.6 | $315,691 | 1.7% |
| 20 | Virginia | 51,372 | 465,285 | 9.1 | $360,696 | 1.6% |
| 21 | Utah | 23,596 | 190,845 | 8.1 | $284,029 | 2.0% |
| 22 | Kansas | 18,505 | 166,947 | 9.0 | $287,031 | 1.8% |
| 23 | Michigan | 49,572 | 546,520 | 11.0 | $369,703 | 1.4% |
| 24 | Wyoming | 7,793 | 41,662 | 5.3 | $182,338 | 4.0% |
| 25 | Vermont | 5,366 | 34,712 | 6.5 | $214,412 | 2.6% |
| 26 | New York | 132,457 | 981,864 | 7.4 | $325,953 | 1.8% |
| 27 | Montana | 13,393 | 82,845 | 6.2 | $162,679 | 3.4% |
| 28 | Illinois | 77,285 | 696,953 | 9.0 | $353,545 | 1.7% |
| 29 | Tennessee | 27,695 | 306,727 | 11.1 | $406,610 | 1.2% |
| 30 | Nebraska | 16,768 | 118,796 | 7.1 | $223,882 | 2.3% |
| 31 | Iowa | 21,621 | 188,087 | 8.7 | $241,909 | 1.9% |
| 32 | Louisiana | 26,089 | 240,663 | 9.2 | $336,456 | 1.6% |
| 33 | Florida | 166,820 | 1,193,680 | 7.2 | $245,302 | 2.0% |
| 34 | Ohio | 51,660 | 566,892 | 11.0 | $363,074 | 1.2% |
| 35 | Pennsylvania | 63,029 | 637,751 | 10.1 | $339,435 | 1.4% |
| 36 | North Dakota | 8,636 | 35,996 | 4.2 | $181,600 | 2.4% |
| 37 | Nevada | 18,997 | 162,014 | 8.5 | $309,179 | 1.7% |
| 38 | Maine | 10,815 | 68,935 | 6.4 | $208,119 | 2.2% |
| 39 | Maryland | 34,205 | 296,852 | 8.7 | $358,016 | 1.5% |
| 40 | Alabama | 19,037 | 193,307 | 10.2 | $362,575 | 1.1% |
| 41 | New Mexico | 12,426 | 112,264 | 9.0 | $265,824 | 1.7% |
| 42 | Indiana | 33,450 | 329,844 | 9.9 | $321,491 | 1.4% |
| 43 | North Carolina | 56,766 | 536,377 | 9.4 | $303,764 | 1.5% |
| 44 | Connecticut | 17,652 | 153,832 | 8.7 | $356,703 | 1.4% |
| 45 | Arkansas | 16,649 | 148,402 | 8.9 | $248,192 | 1.6% |
| 46 | Kentucky | 18,826 | 180,656 | 9.6 | $295,775 | 1.2% |
| 47 | Rhode Island | 8,273 | 54,311 | 6.6 | $270,867 | 1.6% |
| 48 | Mississippi | 11,548 | 110,972 | 9.6 | $280,145 | 1.1% |
| 49 | Georgia | 56,964 | 461,830 | 8.1 | $266,577 | 1.4% |
| 50 | South Carolina | 24,327 | 209,744 | 8.6 | $264,695 | 1.3% |
| 51 | West Virginia | 7,512 | 64,349 | 8.6 | $239,677 | 1.2% |
Worst States for Female Entrepreneurs
1. West Virginia
West Virginia’s female-owned firms had a below-average employee count of 8.6 employees per firm, as well as below-average employee payroll at $241K per firm. Additionally, the state’s female-owned business proportion was only 1.2%.
2. South Carolina
South Carolina’s female-owned businesses had similar statistics to West Virginia’s, with slightly higher employee, payroll, and women-owned business ownership.
3. Georgia
Georgia’s female-owned businesses had 8.1 employees on average, with an average payroll of $267K. In Georgia, the proportion of female-owned businesses was 1.4%, below the national average.
| Rank | State | Female-Owned Businesses with Employees | Total Employees | Average Employees per Company | Average Payroll per Company | Proportion of Female-Owned Businesses |
|---|---|---|---|---|---|---|
| 1 | West Virginia | 7,512 | 64,349 | 8.6 | $239,677 | 1.2% |
| 2 | South Carolina | 24,327 | 209,744 | 8.6 | $264,695 | 1.3% |
| 3 | Georgia | 56,964 | 461,830 | 8.1 | $266,577 | 1.4% |
| 4 | Mississippi | 11,548 | 110,972 | 9.6 | $280,145 | 1.1% |
| 5 | Rhode Island | 8,273 | 54,311 | 6.6 | $270,867 | 1.6% |
| 6 | Kentucky | 18,826 | 180,656 | 9.6 | $295,775 | 1.2% |
| 7 | Arkansas | 16,649 | 148,402 | 8.9 | $248,192 | 1.6% |
| 8 | Connecticut | 17,652 | 153,832 | 8.7 | $356,703 | 1.4% |
| 9 | North Carolina | 56,766 | 536,377 | 9.4 | $303,764 | 1.5% |
| 10 | Indiana | 33,450 | 329,844 | 9.9 | $321,491 | 1.4% |
| 11 | New Mexico | 12,426 | 112,264 | 9.0 | $265,824 | 1.7% |
| 12 | Alabama | 19,037 | 193,307 | 10.2 | $362,575 | 1.1% |
| 13 | Maryland | 34,205 | 296,852 | 8.7 | $358,016 | 1.5% |
| 14 | Maine | 10,815 | 68,935 | 6.4 | $208,119 | 2.2% |
| 15 | Nevada | 18,997 | 162,014 | 8.5 | $309,179 | 1.7% |
| 16 | North Dakota | 8,636 | 35,996 | 4.2 | $181,600 | 2.4% |
| 17 | Pennsylvania | 63,029 | 637,751 | 10.1 | $339,435 | 1.4% |
| 18 | Ohio | 51,660 | 566,892 | 11.0 | $363,074 | 1.2% |
| 19 | Florida | 166,820 | 1,193,680 | 7.2 | $245,302 | 2.0% |
| 20 | Louisiana | 26,089 | 240,663 | 9.2 | $336,456 | 1.6% |
| 21 | Iowa | 21,621 | 188,087 | 8.7 | $241,909 | 1.9% |
| 22 | Nebraska | 16,768 | 118,796 | 7.1 | $223,882 | 2.3% |
| 23 | Tennessee | 27,695 | 306,727 | 11.1 | $406,610 | 1.2% |
| 24 | Illinois | 77,285 | 696,953 | 9.0 | $353,545 | 1.7% |
| 25 | Montana | 13,393 | 82,845 | 6.2 | $162,679 | 3.4% |
| 26 | New York | 132,457 | 981,864 | 7.4 | $325,953 | 1.8% |
| 27 | Vermont | 5,366 | 34,712 | 6.5 | $214,412 | 2.6% |
| 28 | Wyoming | 7,793 | 41,662 | 5.3 | $182,338 | 4.0% |
| 29 | Michigan | 49,572 | 546,520 | 11.0 | $369,703 | 1.4% |
| 30 | Kansas | 18,505 | 166,947 | 9.0 | $287,031 | 1.8% |
| 31 | Utah | 23,596 | 190,845 | 8.1 | $284,029 | 2.0% |
| 32 | Virginia | 51,372 | 465,285 | 9.1 | $360,696 | 1.6% |
| 33 | Arizona | 44,237 | 424,934 | 9.6 | $315,691 | 1.7% |
| 34 | Missouri | 40,548 | 389,272 | 9.6 | $282,205 | 1.7% |
| 35 | Idaho | 16,954 | 113,485 | 6.7 | $209,620 | 2.7% |
| 36 | Alaska | 7,125 | 39,268 | 5.5 | $323,646 | 2.2% |
| 37 | South Dakota | 8,555 | 56,001 | 6.5 | $215,522 | 2.8% |
| 38 | Oklahoma | 24,187 | 238,397 | 9.9 | $334,653 | 1.7% |
| 39 | Texas | 156,541 | 1,641,465 | 10.5 | $387,830 | 1.5% |
| 40 | New Jersey | 54,448 | 493,818 | 9.1 | $372,766 | 1.7% |
| 41 | District of Columbia | 4,175 | 50,158 | 12.0 | $588,009 | 1.4% |
| 42 | Washington | 63,892 | 532,557 | 8.3 | $321,332 | 2.3% |
| 43 | Oregon | 35,104 | 299,517 | 8.5 | $299,964 | 2.3% |
| 44 | Hawaii | 9,106 | 87,140 | 9.6 | $319,668 | 1.9% |
| 45 | Delaware | 6,113 | 54,597 | 8.9 | $383,391 | 1.8% |
| 46 | Minnesota | 36,388 | 356,327 | 9.8 | $346,337 | 1.8% |
| 47 | Colorado | 50,939 | 419,483 | 8.2 | $327,402 | 2.3% |
| 48 | California | 272,123 | 2,453,283 | 9.0 | $375,636 | 2.0% |
| 49 | New Hampshire | 8,744 | 84,683 | 9.7 | $383,225 | 1.8% |
| 50 | Wisconsin | 35,538 | 413,344 | 11.6 | $425,831 | 1.7% |
| 51 | Massachusetts | 39,543 | 384,378 | 9.7 | $451,059 | 1.8% |
Methodology
AdvisorSmith studied the characteristics of female-owned businesses to determine the best and worst states for female entrepreneurs. We used data from the U.S. Census Bureau’s Annual Business Survey, which collects data on employer firms, which are businesses that have at least one employee. Using this data, we focused on female-owned employer firms, which we defined as businesses that were either majority female-owned or equally male and female-owned. We studied all 50 states plus the District of Columbia.
We considered three factors in determining the best states for female entrepreneurs: the average employee headcount for female-owned firms in each state, the average payroll per female-owned firm, and the percentage of female-owned firms with over $100,000 in revenue as a proportion of the working-age female population in each state. We weighted these factors at 25%, 25%, and 50%, respectively.
To find the average employee headcount, we added the total number of employees at female-owned firms and divided it by the number of female-owned firms in each state. To find the average payroll per female-owned firm, we added the total payroll for female-owned firms and divided it by the number of female-owned firms in each state.
To determine the working-age female population, we counted the number of female residents of each state between 20 and 64 years of age. We then divided the number of female-owned firms that reported at least $100,000 in annual revenue by the total working-age female population to find the proportion of female entrepreneurs in the state.
Sources
- U.S. Census Bureau, Annual Business Survey, 2019
- U.S. Census Bureau, American Community Survey