


With a large, dynamic, and varied economy, the United States is one of the best countries in the world for entrepreneurs. The country’s large population, highly developed economy, and high incomes provide great opportunities for would-be small business owners and startup founders. As a federal nation, states within the United States have wide latitude to set many of their own policies that relate to businesses, from taxation to financial regulation to licensing and employment policies. In effect, the nation has a living laboratory of 50 state-level entities and the District of Columbia in which more or less business-friendly policies can be tested and enacted.
In this analysis, AdvisorSmith examined over 20 indicators of the health of the business environment in states across the nation using data from numerous sources, including the U.S. Bureau of Labor Statistics and the Small Business Administration. Some of the factors we considered included personal and corporate tax policies, rates of business formation and hiring for new businesses, funding availability, and business survival rates. We ranked all 50 states and the District of Columbia based upon an aggregated score considering all these factors.

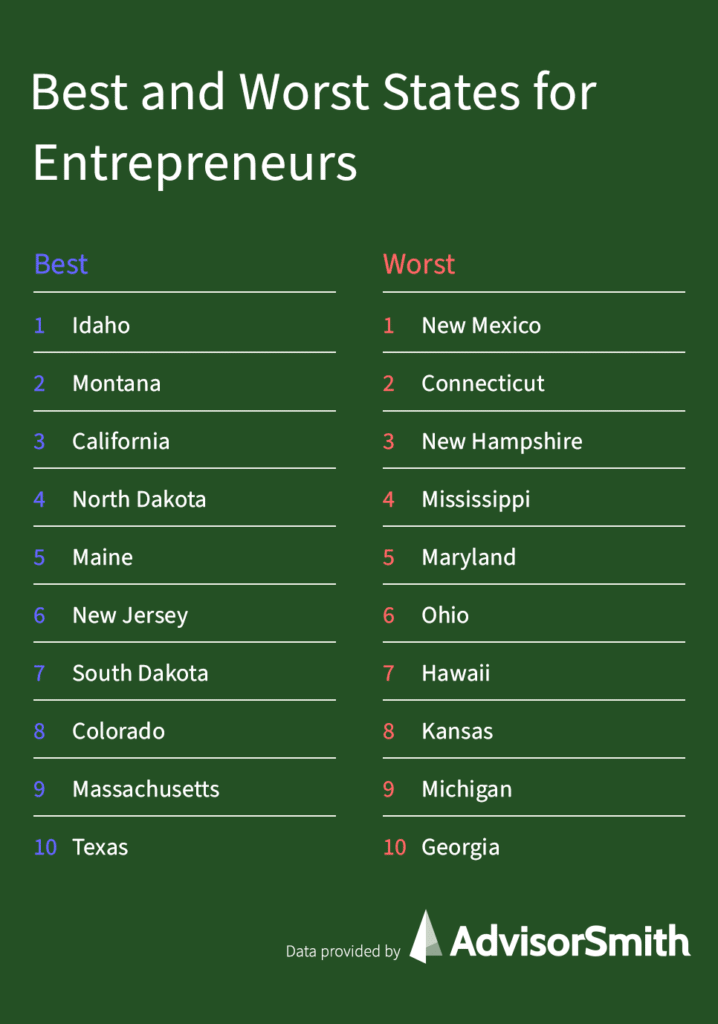
Top 10 States for Entrepreneurs
The top states for entrepreneurs are listed in the table below, along with select metrics around each state’s attractiveness for entrepreneurs. Several Midwestern states led the list, including Idaho (#1), Montana (#2), North Dakota (#4), and South Dakota (#7). Several states with very unfavorable tax environments made the top 10 as well, including California (#3), and New Jersey (#6), owing to their high rates of entrepreneurship and business survival.
| Rank | State | New Businesses per 100K Population | New Entrepreneurs Per 100K Population | Value of New Business Loans per Business | Business Survival Rate |
|---|---|---|---|---|---|
| 1 | Idaho | 172 | 371 | $9,091 | 58% |
| 2 | Montana | 172 | 370 | $8,730 | 60% |
| 3 | California | 136 | 436 | $7,857 | 58% |
| 4 | North Dakota | 136 | 362 | $12,267 | 56% |
| 5 | Maine | 130 | 351 | $8,667 | 57% |
| 6 | New Jersey | 118 | 320 | $8,965 | 57% |
| 7 | South Dakota | 134 | 293 | $11,111 | 58% |
| 8 | Colorado | 163 | 334 | $7,864 | 54% |
| 9 | Massachusetts | 111 | 251 | $7,133 | 60% |
| 10 | Texas | 118 | 410 | $7,633 | 55% |
Worst 10 States for Entrepreneurs
The worst states for entrepreneurs are listed in the following table. New Mexico (#1) topped the list, followed by a grouping of Northeast, Southern, and Rust Belt states, including Connecticut (#2), New Hampshire (#3), Maryland (#5); Mississippi (#4), Georgia (#10); and Ohio (#6) and Michigan (#9). States in the bottom 10 all suffered from low rates of business survival, low rates of business lending, low numbers of entrepreneurs, and low amounts of business formation. Tax policy was also a factor for the majority of the worst 10 states.
| Rank | State | New Businesses per 100K Population | New Entrepreneurs Per 100K Population | Value of New Business Loans per Business | Business Survival Rate |
|---|---|---|---|---|---|
| 1 | New Mexico | 85 | 429 | $6,164 | 52% |
| 2 | Connecticut | 83 | 225 | $7,584 | 46% |
| 3 | New Hampshire | 106 | 263 | $6,812 | 51% |
| 4 | Mississippi | 77 | 331 | $7,170 | 55% |
| 5 | Maryland | 94 | 286 | $6,796 | 53% |
| 6 | Ohio | 71 | 216 | $7,841 | 54% |
| 7 | Hawaii | 83 | 329 | $8,029 | 52% |
| 8 | Kansas | 98 | 285 | $7,752 | 45% |
| 9 | Michigan | 82 | 253 | $7,982 | 53% |
| 10 | Georgia | 119 | 394 | $6,909 | 49% |
Best and Worst States for Entrepreneurs
The table below shows the ranking of each state, along with each state’s ranking on selected subfactors, including Tax Environment Rank, Business Formation Rank, Entrepreneurship Rate Rank, Business Lending Rank, and Business Survival Rank
| Rank | State | Tax Environment Rank | Business Formation Rank | Entrepreneurship Rate Rank | Business Lending Rank | Business Survival Rank |
|---|---|---|---|---|---|---|
| 1 | Idaho | 20 | 1 | 5 | 6 | 4 |
| 2 | Montana | 5 | 4 | 18 | 10 | 1 |
| 3 | California | 49 | 5 | 3 | 24 | 6 |
| 4 | North Dakota | 17 | 8 | 23 | 1 | 16 |
| 5 | Maine | 29 | 6 | 29 | 12 | 8 |
| 6 | New Jersey | 50 | 31 | 7 | 7 | 10 |
| 7 | South Dakota | 2 | 9 | 40 | 2 | 5 |
| 8 | Colorado | 21 | 13 | 2 | 23 | 25 |
| 9 | Massachusetts | 34 | 15 | 11 | 40 | 2 |
| 10 | Texas | 11 | 18 | 12 | 28 | 17 |
| 11 | Illinois | 36 | 24 | 26 | 5 | 27 |
| 12 | Nebraska | 28 | 11 | 20 | 17 | 36 |
| 13 | North Carolina | 10 | 21 | 28 | 21 | 15 |
| 14 | Oregon | 15 | 3 | 21 | 32 | 29 |
| 15 | Utah | 8 | 14 | 13 | 35 | 24 |
| 16 | Missouri | 12 | 17 | 15 | 9 | 46 |
| 17 | Alabama | 41 | 45 | 30 | 3 | 13 |
| 18 | Washington | 16 | 2 | 22 | 18 | 50 |
| 19 | Delaware | 13 | 28 | 10 | 13 | 44 |
| 20 | Minnesota | 46 | 22 | 38 | 33 | 3 |
| 21 | Louisiana | 42 | 49 | 25 | 14 | 12 |
| 22 | Indiana | 9 | 41 | 50 | 4 | 7 |
| 23 | Tennessee | 18 | 36 | 27 | 25 | 14 |
| 24 | New York | 48 | 12 | 8 | 42 | 42 |
| 25 | Oklahoma | 30 | 29 | 14 | 44 | 19 |
| 26 | South Carolina | 33 | 32 | 16 | 22 | 37 |
| 27 | Florida | 4 | 25 | 4 | 50 | 32 |
| 28 | Arkansas | 45 | 30 | 35 | 8 | 40 |
| 29 | Alaska | 3 | 7 | 46 | 31 | 31 |
| 30 | Wisconsin | 25 | 39 | 42 | 11 | 23 |
| 31 | District of Columbia | 46 | 38 | 1 | 29 | 47 |
| 32 | Pennsylvania | 27 | 35 | 45 | 16 | 20 |
| 33 | Wyoming | 1 | 20 | 17 | 47 | 33 |
| 34 | Nevada | 7 | 26 | 6 | 49 | 38 |
| 35 | Rhode Island | 37 | 10 | 39 | 34 | 39 |
| 36 | Iowa | 40 | 27 | 49 | 36 | 11 |
| 37 | Virginia | 26 | 37 | 19 | 37 | 30 |
| 38 | Arizona | 24 | 34 | 24 | 41 | 26 |
| 39 | Kentucky | 19 | 42 | 36 | 38 | 9 |
| 40 | Vermont | 43 | 16 | 41 | 51 | 21 |
| 41 | West Virginia | 22 | 48 | 51 | 15 | 18 |
| 42 | Georgia | 31 | 33 | 9 | 43 | 48 |
| 43 | Michigan | 14 | 47 | 31 | 20 | 35 |
| 44 | Kansas | 35 | 23 | 34 | 27 | 51 |
| 45 | Hawaii | 38 | 46 | 32 | 19 | 43 |
| 46 | Ohio | 39 | 50 | 47 | 26 | 28 |
| 47 | Maryland | 44 | 43 | 33 | 46 | 34 |
| 48 | Mississippi | 32 | 51 | 44 | 39 | 22 |
| 49 | New Hampshire | 6 | 19 | 48 | 45 | 45 |
| 50 | Connecticut | 47 | 44 | 43 | 30 | 49 |
| 51 | New Mexico | 23 | 40 | 37 | 48 | 41 |
The following table shows selected statistics for each state, including new businesses per 100K population, new entrepreneurs per 100K population, value of new business loans per business, and business survival rate. On average, among the states, there were 116 new businesses per 100K population, 305 new entrepreneurs per 100K population, an average value of $7,910 per business for business loans, and a business survival rate over 4 years of 54%.
| Rank | State | New Businesses per 100K Population | New Entrepreneurs Per 100K Population | Value of New Business Loans per Business | Business Survival Rate |
|---|---|---|---|---|---|
| 1 | Idaho | 172 | 371 | $9,091 | 58% |
| 2 | Montana | 172 | 370 | $8,730 | 60% |
| 3 | California | 136 | 436 | $7,857 | 58% |
| 4 | North Dakota | 136 | 362 | $12,267 | 56% |
| 5 | Maine | 130 | 351 | $8,667 | 57% |
| 6 | New Jersey | 118 | 320 | $8,965 | 57% |
| 7 | South Dakota | 134 | 293 | $11,111 | 58% |
| 8 | Colorado | 163 | 334 | $7,864 | 54% |
| 9 | Massachusetts | 111 | 251 | $7,133 | 60% |
| 10 | Texas | 118 | 410 | $7,633 | 55% |
| 11 | Illinois | 105 | 256 | $9,167 | 54% |
| 12 | Nebraska | 116 | 273 | $8,287 | 53% |
| 13 | North Carolina | 111 | 279 | $7,884 | 56% |
| 14 | Oregon | 144 | 285 | $7,557 | 54% |
| 15 | Utah | 167 | 266 | $7,348 | 55% |
| 16 | Missouri | 114 | 348 | $8,856 | 50% |
| 17 | Alabama | 80 | 231 | $9,804 | 56% |
| 18 | Washington | 147 | 301 | $8,037 | 45% |
| 19 | Delaware | 173 | 228 | $8,636 | 51% |
| 20 | Minnesota | 100 | 217 | $7,505 | 59% |
| 21 | Louisiana | 86 | 344 | $8,621 | 56% |
| 22 | Indiana | 80 | 227 | $9,263 | 57% |
| 23 | Tennessee | 89 | 290 | $7,849 | 56% |
| 24 | New York | 137 | 336 | $7,000 | 52% |
| 25 | Oklahoma | 107 | 407 | $6,906 | 55% |
| 26 | South Carolina | 103 | 258 | $7,865 | 53% |
| 27 | Florida | 157 | 470 | $5,964 | 53% |
| 28 | Arkansas | 96 | 309 | $8,880 | 52% |
| 29 | Alaska | 143 | 434 | $7,568 | 53% |
| 30 | Wisconsin | 82 | 236 | $8,677 | 55% |
| 31 | District of Columbia | 118 | 251 | $7,625 | 49% |
| 32 | Pennsylvania | 86 | 189 | $8,455 | 55% |
| 33 | Wyoming | 267 | 429 | $6,429 | 53% |
| 34 | Nevada | 139 | 343 | $6,061 | 52% |
| 35 | Rhode Island | 122 | 157 | $7,453 | 52% |
| 36 | Iowa | 90 | 280 | $7,299 | 56% |
| 37 | Virginia | 99 | 208 | $7,280 | 54% |
| 38 | Arizona | 105 | 363 | $7,038 | 54% |
| 39 | Kentucky | 77 | 253 | $7,222 | 57% |
| 40 | Vermont | 114 | 372 | $5,949 | 55% |
| 41 | West Virginia | 60 | 201 | $8,584 | 55% |
| 42 | Georgia | 119 | 394 | $6,909 | 49% |
| 43 | Michigan | 82 | 253 | $7,982 | 53% |
| 44 | Kansas | 98 | 285 | $7,752 | 45% |
| 45 | Hawaii | 83 | 329 | $8,029 | 52% |
| 46 | Ohio | 71 | 216 | $7,841 | 54% |
| 47 | Maryland | 94 | 286 | $6,796 | 53% |
| 48 | Mississippi | 77 | 331 | $7,170 | 55% |
| 49 | New Hampshire | 106 | 263 | $6,812 | 51% |
| 50 | Connecticut | 83 | 225 | $7,584 | 46% |
| 51 | New Mexico | 85 | 429 | $6,164 | 52% |
Methodology
Our study considered over 20 factors in determining the best and worst states for entrepreneurs in the United States. We ranked all 50 states and the District of Columbia based upon each of the factors and assigned a weighting for each factor. We then aggregated the score given to each state for all of the factors to assign a composite score to each state. We then ranked the states based on their aggregate scores.
Tax factors considered in ranking the states included the rates of corporate taxation, individual income taxation, sales tax, unemployment insurance costs, and property taxes. All of these factors affect small business owners, as businesses can be structured either in corporate form or as pass-through businesses in which case individual income tax rates apply. Additionally, even if businesses rent the spaces which they occupy, property taxes are incorporated into the rents that they pay.
Our study examined four key variables around the formation of new businesses, as compiled by the Kauffman Indicators of Entrepreneurship for years between 2017-2019. These four factors were the average rate of business formation per capita, the percentage of businesses making a payroll within eight quarters of legal formation, the percentage of the population starting a new business, and the average number of jobs created by startup businesses during their first year in business. These factors provide a good measure of the impact of new businesses on their states.
Additionally, we used data from the U.S. Small Business Administration to compile counts of the number of small businesses in each state. We also found the total new lending to businesses for loans of up to $1 million. We divided the total lending, in dollars, by the total number of small businesses to find the new lending per business in each state.
We examined data published by the Bureau of Labor Statistics on the survival rates of small businesses in each state between 2016 through 2019. This data measures the survival rate of small businesses based upon the employment reports that they file with state governments. We calculated the survival rate of small businesses in each state over the study period, as this provides a measure of the success of small businesses.
Sources
- Tax Foundation, Facts and Figures
- Kauffman Indicators of Entrepreneurship, New Employer Business Series
- Kauffman Indicators of Entrepreneurship, Early-Stage Entrepreneurship Series
- U.S. Bureau of Labor Statistics, Establishment Age and Survival Data, Establishment age and survival data by state
- U.S. Small Business Administration, Office of Advocacy, 2021 Small Business Profiles For The States, The District Of Columbia, And The U.S.